Dust emission from 3C radio galaxies and quasars: New ISO††thanks: Based on observations with the Infrared Space Observatory ISO, an ESA project with instruments funded by ESA Member States (especially France, Germany, the Netherlands and the United Kingdom) and with the participation of ISAS and NASA. observations favour the unified scheme.
In order to test the unified scheme for luminous radio galaxies and
quasars we observed 10 galaxy/quasar pairs from the 3CR catalogue with
ISOPHOT at infrared wavelengths between 5 and 180 m. Each pair
was selected such that both the 178 MHz luminosity and the redshift
match as close as possible between the radio galaxy and the quasar in
order to minimize effects of cosmic evolution. 13 of the 20 sources
were detected in at least one waveband.
12 sources show clear evidence of a thermal bump at FIR
wavelength, while in the remaining 7 sources the upper limits
are still compatible with the presence of luminous dust emission.
In agreement with the predictions of the unified scheme, the quasars
and galaxies in our sample cannot be distinguished by their observed mid- and
far-infrared properties.
This is in contrast to the findings on the basis of the IRAS scans
which indicated that radio galaxies radiate significantly less mid- to
far-infrared emission than quasars. However, the IRAS samples are
dominated by low-redshift sources (), while our sample
contains several of the most luminous radio galaxies at redshift . The latter have already been suspected to contain a hidden
quasar for other reasons, e.g. an extended emission line region
aligned with the radio axis. From the ratio between FIR luminosity
emitted by dust and the radio power at 178 MHz, we conclude that the
radio galaxy/quasar unification might be perfectly valid for the most
luminous 3C sources at high redshift (). At lower redshifts
(), however, some of the lobe-dominated FRII radio galaxies
contain active nuclei which emit less UV-optical continuum than the
quasars of similar radio power. As this division is mainly a function
of redshift and less one of absolute radio power, we suggest that it
is caused by the evolution of the nuclear fueling rate with cosmic
epoch. In order to quantify the deviation from the purely
aspect-dependent unified scheme at low redshifts a larger fraction of
3C radio galaxies has to be observed at mid- to far-infrared
wavelengths with sensitivities which suffice to yield secure
detections rather than upper limits.
Key Words.:
Galaxies: fundamental parameters – nuclei – photometry – Quasars: general – Infrared: galaxies1 Introduction
From an observational point of view, at least a dozen classes of Active Galactic Nuclei (AGN) are discernible. Conceptionally, however, there is widespread agreement that most, if not all, of these different AGNs contain a massive black hole ( M☉ ) and that accretion onto this provides the main source of energy. It seems natural, therefore, to explain their differences by observational selection effects and thus restrict the large variety of observed object classes. Such selection effects could be differences in the evolutionary phase or the aspect angle which might be important if AGNs are not spherically symmetric objects.
Indeed, already the earliest “maps” of Cygnus A (= 3C 405) revealed the bi-polar morphology of the radio source (Jennison & Das Gupta, 1953). The detection of very bright spots of radio emission (“hot spots”) in this double lobed radio source by Hargrave and Ryle (1974), which can be connected by a straight line through the central galaxy, led Scheuer (1974) and Blandford and Rees (1974) to the concept of “beams” or “jets” which continuously feed the lobes with kinetic energy. In the hot spots this energy is converted partly into relativistic particles which then emit synchrotron radiation while gyrating around magnetic field lines. The jet model for the most luminous radio galaxies (and quasars) is in itself highly non-symmetric. But the full implications for the emitted radiation pattern were only realized in 1977 when Scheuer and Readhead argued that the apparent super-luminal motions detected in the milliarcsecond structure of some quasars (Whitney et al. 1971) are caused by jet velocities close to the speed of light. The Doppler boosting of the radiation from a relativistic jet generates an extremely anisotropic radiation pattern. A few years later, Miller & Antonucci (1983) detected a broad emission line spectrum (i.e. a Seyfert I spectrum) in the polarized (scattered) light from the Seyfert II galaxy NGC 1068, pointing to the possibility that the appearance of thermal radiation from AGNs also might be aspect dependent.
Many proposals have been put forward to unify observationally distinct classes on the basis of different aspect angles (i.e. the angle between the source axis and the line-of-sight). Most notable of these “unified schemes” are those for flat and steep spectrum quasars (Orr & Browne 1982), for Seyfert I and Seyfert II galaxies (Antonucci & Miller 1985), and for BL Lacertae Objects and FRI radio galaxies (Urry & Padovani 1995). Excellent reviews about unified schemes and their limitations have been given by Lawrence (1991) and Antonucci (1993).
The most radical proposal for the unification of radio-loud objects was presented by Barthel (1989) who argued on the basis of the apparent size distribution that the most luminous radio sources (that is the FR II sources in the 3C catalogue) may represent an intrinsically identical class of objects, only differing by the angle between the radio axis and the line-of-sight. At its time, this was rather revolutionary in the sense that two classes with vastly different optical appearance (some of the brightest optical quasars and some of the faintest galaxies known at that time) were postulated to be intrinsically the same.
A necessary ingredient in this radio galaxy/quasar unification is obviously not only Doppler boosting of the non-thermal radiation from the jet but also a non-spherical obscuration (analogous to that inferred for the Seyfert II galaxies). If the jet axis and the plane of an obscuring disk or “torus” (i.e. a disk with height similar to radius and a central hole) are perpendicular to each other, the emergence of (intrinsically) isotropic thermal radiation also can depend on the aspect angle. Support for this view came from the observations of the so-called “alignment effect” in powerful, high-redshift radio galaxies (Chambers et al. 1987, McCarthy et al. 1987), the emission line regions of which are often very extended and closely aligned with the radio axis. This could naturally be understood if a quasar hidden by the torus obscuration from our line-of-sight provides the immense UV luminosity which is required to excite the emission lines.
Conservation of energy implies that the “hidden quasar light” does not just “disappear” in radio galaxies, but is converted into another form of energy. In the most popular model, in which the quasar is hidden by the dusty torus (on the line-of-sight mag is needed) the quasar light is absorbed by this torus and the UV-optical radiation is heating the dust. The signature of this warm dust is indeed well detected in the mid- and far-infrared spectra of the brightest quasars (see e.g. Haas et al. 2000). Since the thermal dust radiation (at temperatures between 30 and a few hundred Kelvin) is emitted isotropically, and even the large optical depths required for obscuring the optical light completely could hardly suppress the re-radiation at m, one expects that the mid- and far-infrared thermal bump should provide an almost orientation-independent measure of the core UV-optical luminosity (see Fig. 1)
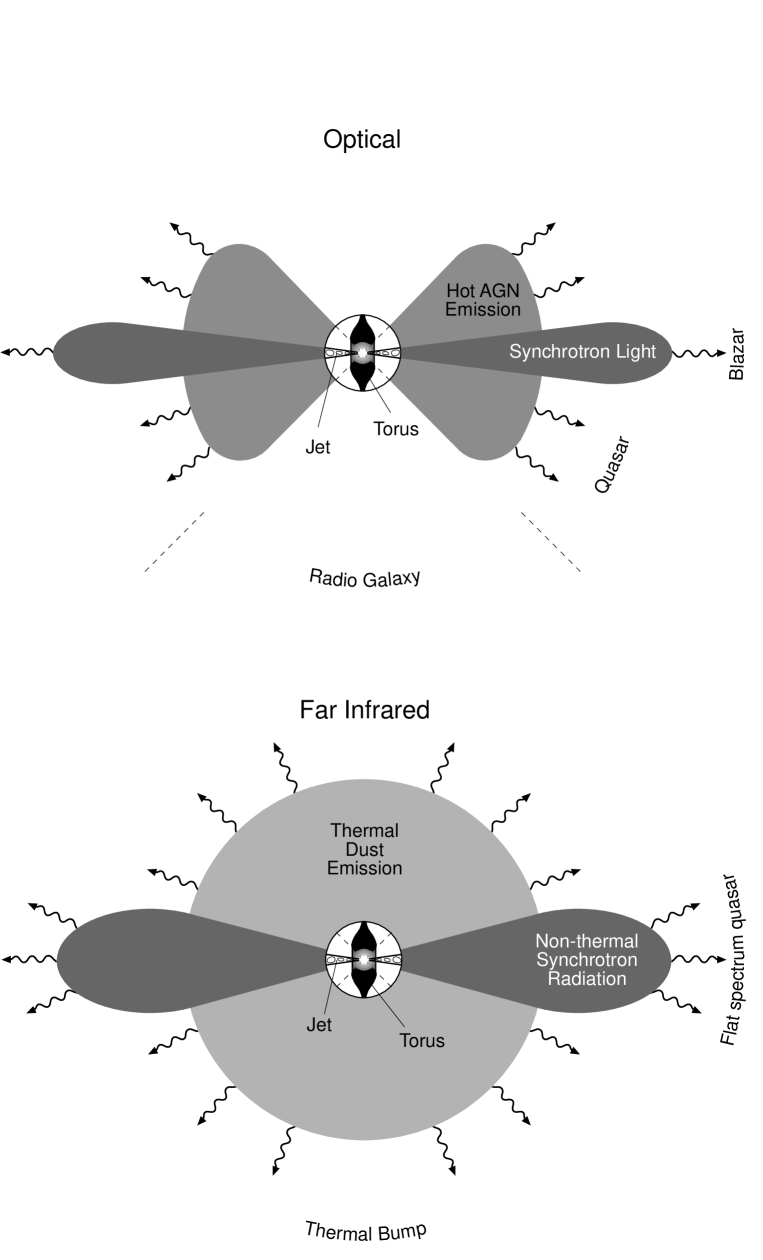
Thus, a direct test of the radio galaxies/quasars unification should be possible when selecting a sample of radio sources on the basis of an isotropically emitted radiation (e.g. the low frequency radiation from the extended lobes, which gives a time average of the kinetic jet power ejected from the core) and measuring their thermal core power by observing the dust emission between 10 and 200 m. If the unified scheme is correct, then the objects classified as a radio “galaxy” must exhibit a mid- and far-infrared bump comparable to those classified as quasars. Note that the infrared radiation could be contaminated by the beamed synchrotron spectrum of flat-spectrum quasars which smoothly runs from the radio to the optical wavelength regimes. Thus the detection of a thermal bump above this synchrotron component is required.
The 3CR sample (Bennett 1962a,1962b) is selected at 178 MHz, a frequency at which most sources are dominated by the very extended radio lobes. This sample, therefore, should suffer from the least possible orientation bias. On the other hand it contains many rather bright quasars which are within the reach of the sensitivity provided by the ISOPHOT instrument on board of the Infrared Space Observatory (ISO) and should therefore provide the best sample to test the radio galaxy/quasar unification by its mid- to far-infrared properties.
First attempts to test the unified scheme along these lines have been undertaken on the basis of the 12 – 100 m data from the IRAS satellite. Heckman et al. (1992) could detect only 6 out of 117 radio galaxies and quasars in their sample of 3CR sources with scanned by IRAS. Since this number is too small to derive a meaningful conclusion, they superimposed all IRAS maps of the radio galaxies and quasars, respectively, thus constructing averaged “super-maps” of the IR emission from the two samples. On that basis they conclude that 3C quasars on average are more luminous at 60 to 100 m than a comparable sample of radio galaxies. This is in pronounced contrast with the expectation from the unified scheme. Later a similar conclusion was reached by Hes, Barthel & Hoekstra (1995) who found that only 6% of the 3CR radio galaxies at but 37% of the quasars are detected on the finally calibrated IRAS scans. Although this observational conflict with the purely aspect-dependant unified scheme already has triggered several theoretical models to produce a pronounced anisotropy of the mid- and far-infrared emission (e.g. Pier & Krolik, 1992, 1993), it cannot be overlooked that the IRAS results are far from conclusive: First, their wavelength coverage and sensitivity are not sufficient to correct for the contribution by a (beamed) synchrotron component to the FIR spectra of the quasars. Second, the “super-maps” could severely be affected by fine-structure in the galactic cirrus such that one single object located in a cirrus depression could alter the result of the whole sample. Therefore, it seems mandatory to reach sensitivities which suffice to detect individual sources and the shape of their spectral energy distributions up to 200 m before firm conclusions can be drawn.
Here we report a comparative study of 3CR radio galaxies and quasars which was undertaken as part of the ISO European Central Quasar Programme . The pointed observations with ISOPHOT led to much deeper detection limits than those reached by IRAS. New millimeter observations with the IRAM 30 m telescope help to determine the synchrotron contribution at mid- to far-infrared wavelengths. We observed 10 radio galaxies and 10 quasars. With 13 of these sources detected we are for the first time in the position to compare radio galaxies and quasars on the basis of individual detections, rather than on the basis of sample averaged “super-maps”. Some preliminary results of our study have already been published (Haas et al. 1998).
2 Sample selection and data base.
For the ISO European Central Quasar Programme we have selected various samples of quasars. In order to test the unified scheme for powerful radio galaxies and quasars, we did not only select quasars from the 3CR catalogue but included the same number of objects which have been classified as radio galaxies (optical identifications from Spinrad et al. 1985). The basic idea has been to observe pairs of radio galaxies and quasars, the members of which are closely matched in their extended lobe luminosity (as measured at 178 MHz) and redshift in order to keep evolutionary effects on a cosmic time scale in check.
Our original sample contained 16 quasar/galaxy pairs in the redshift range . When our observations with the chopped photometry mode of ISOPHOT early in the mission led to less satisfactory results, we decided that an optimum observation strategy had first to be developed before the complete sample was observed. In the end only 17 sources of the original sample could be observed with ISOPHOT. For 3C 273, which was contained in our original sample, we found an observation (by H. Smith) in the public domain of the ISO Data Archive. Two more radio galaxies (3C 437, 3C 405) were later included in our list in order to replace other radio galaxies which had dropped out of the visibility zone. Thus our observed sample of 3CR sources contains 10 quasars and 10 radio galaxies, but only 3 of the originally matched pairs. In order to match the remaining galaxies and quasars as closely as possible along the original idea new pairs had to be formed. Note that one original pair (3C368–3C287) has been broken up in this process and we had to join the prominent sources 3C 405 (Cygnus A) and 3C 48 together although their redshift and 178 MHz power are rather different (see Table 1).
2.1 ISO Data


Top: Far-infrared source flux (averaged 60 and 100 m values) versus background brightness. The symbols are: asterisks = quasars, circles = galaxies, filled = detections, open symbols with arrow = 3–sigma upper limits. All data are observed in chopped mode, except the two cases 3C380 and 3C138 marked with a surrounding box for which more sensitive raster maps were obtained. The three sources with fluxes well above 300 mJy are indicated by upwardly pointing arrows.
Bottom: Histogram of the glitch rates among the 60 and 100 m observations of quasars (asterisks) and radio galaxies (circles). Due to some repeated measurements the total number for quasars and for galaxies sums up to 24 instead of 20.
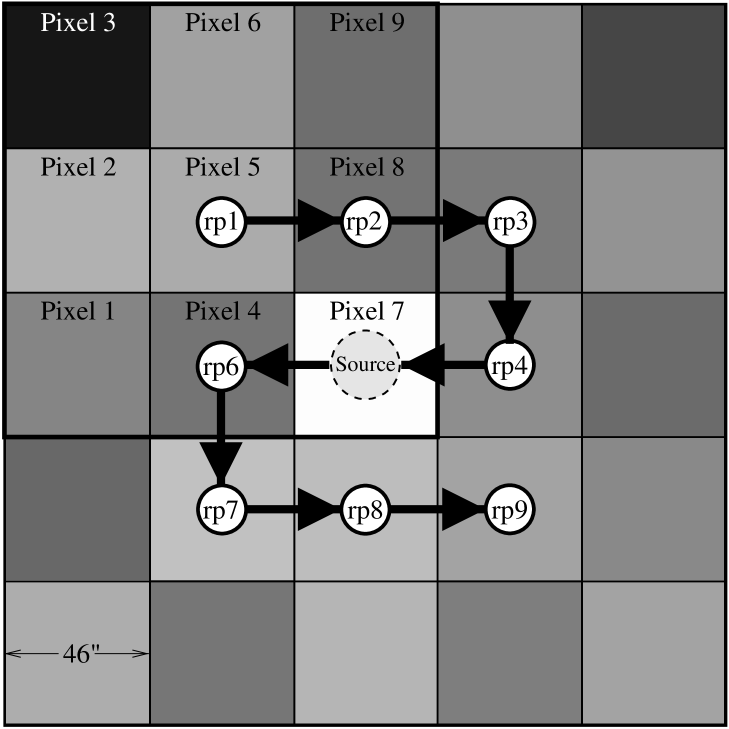
The observations were performed with ISOPHOT (Lemke et al. 1996), the photometer on board ISO (Kessler et al. 1996). The observing modes comprise chopped measurements and, adopted in the course of the ISO mission, small raster maps. The on-source integration time was chosen between 16 and 360 s, depending on the source and cirrus brightness, and the detector and filter combination. The apertures used in flux derivation are 23 circular for 4.8–25m (P1, P2 detectors), and 46 square for 60–100m (i.e. when chopping, then only the central pixel of the pixels C100 array is used). For 120–180m they are 92 square in case of maps (where the source is centered on a pixel of the C200 array) and 184 square in the case of chopped observations (where the source is centered in the mid of the pixels C200 array).
The data were reduced using the Interactive Analysis tool (PIA V7.3 and V8.1) – details and special refinements of the data analysis are described in Haas et al. (2000). The uncertainty of the absolute calibration is about 30%.


Chopped sequence of 3C9 and 3C298, both at similar average background levels, and of the same duration of 128 s, and with a long term detector drift. While the sequence of 3C298 clearly shows the on–off–source oscillation pattern typical for a clear detection with some remaining glitches at the chopper plateaux 5 – 9, that of 3C9 is irregular and disturbed. Increased cosmic rates near the van Allen belt have limited the detections at 60/100 m: 134/158 glitches for 3C9, but only 32/17 for 3C298.
The observations were performed either in chopping mode or by scanning mini-maps (cf. Table 1). For this comparative study it is essential that the different observing modes do not bias the detection statistics. Fortunately, we cannot find any obvious dependence between observing mode and sensitivity: For example, at 60 and 100 m the only two cases with maps are both on QSOs, but one of them (3C138) remains undetected, while one (3C380) which was not detected in the chopped mode, is now detected using the sensitive raster map (Fig. 2). Although this biases the statistics slightly in favour of quasars, 3C380 is by chance just the one case, where the FIR emission is clearly dominated by non-thermal synchrotron radiation (see below).
Furthermore, detections may be hampered by bright cirrus as well as by cosmic particles hitting the detectors. Again, we cannot find any difference with respect to either galaxies or quasars. This is illustrated for the 60 and 100 m data:
Fig. 3 (top) shows source flux versus background brightness. Galaxies and quasars are equally well distributed over the range of background brightness. At low background (less than 8.5 MJy/sr) all five sources are detected, two galaxies and three quasars (one being 3C380 with the lowest flux which is seen only on the raster map). At higher background non-detections are frequent. Remarkably, some chopped data (3C 20, 3C4̇7, 3C 368) yielded rather faint flux detections at a background brightness comparable to that underneath 3C 138, while for this source only upper limits could be achieved on the raster maps. Nevertheless, these detections seem reliable since their 60 to 100 m flux ratio implies a dust temperature well above typical cirrus values.
The fact that a couple of upper limits are at quite high flux levels could be caused by cosmic ray hits. Fig. 4 shows the chopped sequence of 3C 9 and 3C 298, both at the same background level. While the sequence of 3C 298 immediately shows the on–off oscillation pattern typical for a clear source detection, that of 3C 9 is irregular and disturbed. Obviously, increased cosmic rates have limited the detections. We checked that the orbit positions of our galaxy and quasar observations were randomly distributed, and the glitch rates show no significant bias with respect to either galaxies or quasars (Fig. 3, bottom).
2.2 New millimeter data
In order to constrain the synchrotron contribution, additional 1.3 mm continuum observations were obtained for 11 sources of our sample (see Table 1). They were carried out in several campaigns between 1996 and 1999 at the IRAM 30 m telescope on Pico Veleta, Spain, using the MPIfR 19 channel bolometer (Kreysa et al. 1998) in standard ON–OFF–OFF–ON beam switching mode. The atmospheric transmission was determined by measurement series at various zenith distances (sky dips); the calibration was established by observations of Uranus. The absolute uncertainty of the 1.3 mm fluxes is estimated to be around 25%.
2.3 Supplementary data from the literature
Most of the literature flux values were found in the NED and SIMBAD data bases, in particular those for the IRAS detections. The optical fluxes are mainly compiled in Spinrad et al. (1985). The mm fluxes are measured by Steppe et al. (1988, 1992). Further sub-mm data are found for 3C 405 (Robson et al. 1998) and for 3C 324 (Best et al. 1998).
Special monitoring including the years 1983 of the IRAS measurements and 1996 of the ISO measurements was reported for 3C 273 by Stevens et al. (1998), by Türler et al. (1999) and by Hans Ungerechts (IRAM, private communication). Additionally, monitoring data at millimeter wavelengths are available for 3C 380 from Steppe et al. (1988, 1992).
| Object | z | P178 | P1-Detector | P2-Det. | C100-Detector | C200-Detector | IRAM | IRAS | |||||||||||||||||||||||||||
| 3C | M | 4.8 | 7.3 | 12.8 | 20 | 60 | 100 | 120 | 170 | 180 | 1300 | 60 | |||||||||||||||||||||||
| 405 | b | 0.056 | 552 | 1 | 4 | 40 | 1 | 250 | 36 | 590 | 59 | 3034 | 56 | 2155 | 57 | 994 | 216 | 337 | 200 | 419 | 100 | 2329 | |||||||||||||
| 48 | b | 0.367 | 197 | 6 | 7 | 104 | 34 | -23 | 82 | 460 | 85 | 829 | 113 | 739 | 239 | 554 | 142 | 550 | 165 | 740 | |||||||||||||||
| 20 | b | 0.174 | 31 | -17 | 4 | -2 | 12 | -74 | 35 | -73 | 28 | 97 | 26 | 140 | 92 | 167 | 17 | 0.0 | 27.6 | ||||||||||||||||
| 273 | c | 0.158 | 35 | 1124 | 86 | 1348 | 68 | 1546 | 94 | 1292 | 21 | 1056 | 75 | 2060 | |||||||||||||||||||||
| 295 | c | 0.461 | 513 | 16 | 4 | -1 | 9 | 42 | 64 | -218 | 122 | 157 | 26 | 155 | 19 | 106 | 37 | 19.1 | 0.9 | ||||||||||||||||
| 47 | b | 0.425 | 135 | 0 | 3 | 27 | 13 | -22 | 15 | 103 | 30 | 169 | 53 | 164 | 25 | 180 | |||||||||||||||||||
| 427.1 | c | 0.572 | 274 | 1 | 16 | 0 | 5 | -25 | 38 | 36 | 25 | 37 | 45 | 72 | 68 | -1867 | 60 | 0.7 | 0.7 | ||||||||||||||||
| 380 | m | 0.692 | 984 | -1 | 3 | 2 | 1 | -8 | 7 | -39 | 36 | 54 | 16 | 56 | 16 | 83 | 20 | 514.9 | 2.4 | ||||||||||||||||
| 325.0 | c | 0.860 | 452 | 17 | 13 | 3 | 6 | -29 | 25 | -84 | 27 | 160 | 52 | 140 | 19 | 27 | 42 | 0.4 | 0.6 | ||||||||||||||||
| 138 | m | 0.759 | 467 | 8 | 9 | 56 | 69 | 13 | 42 | 25 | 37 | 27 | 39 | ||||||||||||||||||||||
| 280 | c | 0.996 | 1007 | -3 | 1 | -1 | 4 | 26 | 22 | -10 | 68 | 66 | 31 | 58 | 63 | 34 | 77 | 14.7 | 1.0 | ||||||||||||||||
| 286 | c | 0.849 | 699 | 6 | 3 | 41 | 31 | -1 | 39 | 142 | 34 | 126 | 39 | 35 | 62 | 233.4 | 3.5 | ||||||||||||||||||
| 368 | c | 1.131 | 826 | 6 | 2 | 8 | 2 | 22 | 40 | -52 | 54 | 94 | 24 | 72 | 48 | 80 | 56 | 0.14 | 0.6 | ||||||||||||||||
| 309.1 | c | 0.905 | 479 | 22 | 5 | 13 | 13 | 18 | 62 | -85 | 162 | 100 | 10 | -14 | 48 | 272 | 91 | 266.6 | 1.7 | ||||||||||||||||
| 324 | c | 1.206 | 1127 | 3 | 2 | 0 | 1 | 0 | 11 | 37 | 194 | -29 | 34 | 53 | 77 | 236 | 79 | 0.5 | 0.6 | ||||||||||||||||
| 287 | c | 1.055 | 811 | -5 | 6 | 20 | 23 | 34 | 42 | -33 | 52 | -89 | 26 | 81.2 | 1.4 | ||||||||||||||||||||
| 65 | c | 1.176 | 1015 | 10 | 2 | 7 | 41 | -10 | 20 | 129 | 18 | -19 | 43 | 38 | 33 | 0.0 | 8.9 | ||||||||||||||||||
| 298 | c | 1.436 | 5528 | 1 | 4 | 23 | 4 | 29 | 9 | 184 | 24 | 213 | 39 | 243 | 59 | 14.1 | 0.8 | 218 | |||||||||||||||||
| 437 | c | 1.480 | 1853 | 1 | 7 | -2 | 4 | 45 | 34 | -23 | 46 | -31 | 42 | 5 | 82 | -6 | 63 | ||||||||||||||||||
| 9 | c | 2.012 | 5543 | 7 | 3 | 27 | 14 | 9 | 75 | -16 | 48 | -68 | 82 | -148 | 109 | ||||||||||||||||||||
3 Results
3.1 Spectral energy distributions
The ISOPHOT flux measurements of the 10 pairs in our sample are listed in Table 1. Sources which have been detected at least at the level have their 3C number highlighted in bold face. In addition, new IRAM observations at 1300 m have been obtained for 11 sources, seven of which have been detected. Four of the quasars (3C 47, 3C 48, 3C 273, 3C 298) and the nearby radio galaxy Cygnus A (3C 405) had already been detected by IRAS (see 60 m fluxes in the last column). Leaving aside the variable quasar 3C 273 (see below) the ISO fluxes are on average fainter than the IRAS fluxes. With eight new detections in the FIR, we increased the detection rate by more than twofold compared to IRAS. However, seven of 20 sources (3 quasars and 4 radio galaxies) remain undetected at all wavelengths to the limits of the ISO observations.
The measured spectral energy distributions (SEDs) are shown in Fig. 5
supplemented by data from the literature. They reveal signatures of
two emission components:
(A) Synchrotron emission: For one of
the quasars (3C 380) the ISO photometry and the mm flux can be fitted
by a power-law which joins smoothly into the radio
spectrum (near minimum) of this highly variable source. Obviously,
the mid- to far-infrared SED is totally dominated by synchrotron
emission from the radio core which exhibits the flattest radio
spectrum in our sample. Note that the level of the synchrotron
power-law is so high that even a luminous (1011L⊙)
dust component could easily be hidden underneath.
In 1983, at the epoch of the IRAS observations, the mid- to
far-infrared SED of 3C 273 was entirely dominated by synchrotron
emission. However, at the time of the ISO measurments in July 1996 the
60 to 100 m fluxes of 3C 273 were about 50% lower than
measured by IRAS. This low synchrotron activity is consistent with the
results of monitoring the source at other wavelengths (see Fig.1 in
Stevens et al. 1998 and 1.3 and 3.3 mm monitoring with IRAM by Hans
Ungerechts, private communication). The variability alone indicates that the
FIR flux of 3C 273 contains a considerable synchrotron contribution,
at least during the phases of high flux, like in 1983.
Using the mm fluxes in 1996 and a synchrotron spectrum as reference (see Fig. 5), we find that only at the
longest wavelengths (170, 180 m) the ISO measurements are
consistent with a pure synchrotron power-law, while the flux values
between 60 and 120 m straddle significantly above that
power-law. We attribute this to the presence of thermal dust emission,
which only can be detected in 3C 273 when the synchrotron core is in
a low state of activity.
(B) Thermal dust emission: In all detected radio galaxies and at
least four quasars the mid- to far-infrared SED exhibits a “bump”
well in excess of the synchrotron component. We interpret this as
signature of emission from dust with temperatures between 30 and
several hundred Kelvin as is commonly seen in the infrared SEDs of
quasars (e.g. Haas et al. 2000).
Modified blackbodies with an emissivity proportional to are fitted to the data. In the cases with good signal/noise
ratio the dust emission has to be fitted by more than one single
blackbody of a certain temperature (see Fig. 5).
Fortunately, the low synchrotron activity of 3C 273 at the time of the ISO observations enabled the detection of a thermal contribution to the FIR spectrum. In fact, the ISO FIR spectrum between 60 and 100 m with values around 1100 and 1300 mJy lies well above the extrapolation of the mm-submm spectrum towards the IR: F (dashed line in Fig. 5). We take this excess as an indication of the presence of a thermal bump in 3C 273 which contributes roughly 500 mJy at both 60 and 100 m.
Note that in all seven cases for which we derive only upper limits, these limits still allow for the presence of a stong thermal bump well above the synchrotron component.


The long–dashed lines indicate the synchrotron contribution as extrapolated from radio and mm data. Several modified blackbodies are fitted to the data (solid lines) and only the coldest components are plotted individually (dotted lines). Their temperature values refer to the restframe of the object. In cases of non–detection of one member of a pair, the dashed–dotted line illustrates how the blackbody of the partner would appear at the corresponding redshift. This should be compared with the upper limits of our observations.
3.2 Pair-wise comparison of the spectral energy distributions
As outlined above, we intend to test the unified scheme by the comparison of radio galaxy / quasar pairs which are matched both in extended radio luminosity and redshift. Accordingly, our results are presented in a pair-wise manner in Fig. 5. The pairs are sorted according to the redshift of the radio galaxy.
Altogether, seven quasars and six radio galaxies have been detected in at least two ISOPHOT bands. For those five pairs in which both the radio galaxy and the quasar has been detected we indicate the individual multi-temperature black-bodies which best fit the data. The sole exception is 3C 380 for which we cannot find any significant mid- to far-infrared flux above the interpolated synchrotron component. Since also its partner galaxy could not be detected by ISOPHOT this pair remains inconclusive for the purpose of testing the radio galaxy/quasar unification hypothesis. Two more inconclusive pairs are 3C 324 – 3C 287 and 3C 437 – 3C 9, the latter being the pair with the highest redshifts in our sample. In all of these four sources the upper limits are so high that luminous thermal components are still clearly compatible with the data. Thus, our present sample tests the unification hypothesis out to redshifts .
The two detected pairs at the highest redshift are 3C 65 – 3C 298 and 3C 368 – 3C 309.1. As will be seen below, it is of high significance for our conclusion that in both pairs the thermal bump in the radio galaxy and in the quasar are of comparable strength. Moreover, all four sources show detections at mid-infrared wavelengths revealing the existence of a hot dust component commonly found in AGNs.
Our sample contains two pairs (3C 325 – 3C 138 and 3C 280 – 3C 286) in which only one of the partners could be detected at 60 and 100 m. In Fig. 5 we plot the thermal bump of the detected partner underneath the upper limits of the undetected source. This emphazises that the upper limits allow for thermal emission of the same level in both members of the pair. It is, therefore, not astonishing that we find a quasar with its paired galaxy undetected as well as the opposite case.
It should be noted that in our current sample the two pairs at the
lowest redshift are the most problematic ones:
The pair 3C 405 – 3C 48 is rather poorly matched in redshift and
extended radio power because it was formed essentially out of two loose
ends (see sample selection, Section 2, above). Nevertheless, since the radio
power of the galaxy 3C 405 (Cygnus A, Jy) is higher than that of the
quasar despite being at more than lower redshift, the
asymmetries in this pair are balanced and should not bias the
full sample.
The pair 3C 20 – 3C 273 is well matched in redshift and extended radio power. While 3C 20 is an archetypical FR II radio galaxy with hot spots of very high surface brightness111The synchrotron spectrum of one of the hot spots in 3C 20 extends even to optical frequencies (Meisenheimer et al. 1997)., the quasar 3C 273 has rather unique properties: Its radio jet of exceptional surface brightness shows a synchrotron spectrum reaching to optical and even X-ray frequencies (Röser et al. 2000). However, even on the most sensitive VLA maps the source appears one-sided with no trace whatsoever of extended radio emission on the side opposite to the jet. Most of the extended radio emission even at low frequencies originates from the very bright hot spot at the termination point of the radio jet. Thus, the flux at 178 MHz does not refer to “lobe” emission alone. On top of that, the core displays a very strong and highly variable synchrotron spectrum which extends to m. This makes the determination of the thermal FIR emission rather uncertain (see above). We conclude, therefore, that the unique source 3C 273 does not seem ideally suited to investigate the general properties of 3CR sources. In general, it has to be remarked that our sample of 3C quasars contains several flat spectrum quasars, the beamed synchrotron spectra of which extend well into the mid- to far-infrared wavelength region (3C 273, 3C 380, 3C 309.1, and propably 3C 138). As long as the thermal bump from dust emission peaks out well above the synchrotron component this does not affect our comparison. However, it should be noted that – on average – the synchrotron component of the quasars in our sample is more than brighter than that in radio galaxies.
4 Discussion
The present sample of 3CR radio galaxies and quasars has been selected as pairs of objects which match as close as possible in their extended lobe emission at very low frequency and in redshift. As outlined in the introduction, any unified scheme which regards them as members of the same parent population of objects seen under various aspect angles w.r.t. the radio axis, predicts that the dust emission properties should be identical. This obviously holds only for the sample average. Individual pairs might differ by factors of 10 due to different dust masses and the source geometry (see e.g. the wide variety of the IR spectra of PG quasars, Haas et al. 2000).
There are two ways to test the unification hypothesis:
-
(1)
The most straightforward test simply compares the detection statistics. According to this test the 3C radio galaxies and quasars in our sample are indistinguishable: Among the 10 pairs we found 5 for which both the quasar and the radio galaxy is detected by ISOPHOT, one with only the quasar, and one with only the radio galaxy being detected. In the remaining 3 pairs we could neither detect the quasar nor the galaxy. Note that all detected sources show a significant signal at least in one of the 60 and 100 m bands.
If we extend our sample by including the 4 radio galaxy – quasar pairs which have been observed with ISOPHOT by van Bemmel, Barthel & deGrauuw (2000), and have been selected and evaluated along identical lines as ours, we end up with 7 pairs in which both the radio galaxy and the quasar is detected, 3 pairs with only the quasar, and 1 pair with only the radio galaxy being detected. Thus, also the extended sample is in good statistical agreement with the expectation of the unified scheme in its most simple form.
On the other hand, this result is in stark conflict with the results derived from IRAS (Heckman et al. 1992, Hes et al. 1995) which indicate that radio galaxies are about fainter at 60 m than quasars. We therefore perform a second test:
-
(2)
If the unified scheme is correct, not only the detection statistics (which might be misleading due to varying detection limits, see above) but also the emitted FIR power should be the same for objects of identical core luminosity. If we measure the core power by the kinetic energy which is channeled via the jets into the lobes (that is by the radio power at MHz) the ratio of the dust to radio emission: should be identical for galaxies and quasars.
The top panel of Fig. 6 displays this ratio as a function of redshift for our sample. All detected quasars cluster around values of with a total spread of less than a factor of three (exception: 3C 380 in which we only see a synchrotron component). If we assume that only a tiny fraction of the kinetic power in the jets (on the order of a few percent, see Rawlings & Saunders 1991 and Meisenheimer et al. 1997) is converted into synchrotron radiation at 178 MHz, we find that the kinetic jet power and the luminosity emitted by dust closely agree.
In general, we cannot find any remarkable differences between the distribution of quasars and galaxies – again in agreement with the unified scheme. The only exception is Cygnus A at very low redshift and with unusually high radio power (Barthel & Arnaud 1996) showing . Although the total spread of about a factor of ten in the of radio galaxies would be consistent with a spread in FIR luminosities similar to that found in PG quasars (Haas et al. 2000), we note a trend with redshift in the sense that at redshift the typical seems to be 4 times lower than at . We identify two groups: Radio galaxies at with (sole exception: 3C 67 from the van Bemmel et al. sample) and those at with which is also typical for the quasars. The alternative hypothesis that is primarily correlated with radio power is not supported (see bottom panel of Fig. 6) since e.g. the radio galaxies 3C 405, 3C 295, 3C 368, 3C 325 and 3C 65 cover only a factor of 2 in radio power while their varies by more than a factor of 30.
The fact that correlates better with redshift than with luminosity can be understood if the thermal power of a radio source is primarily controlled by the fueling rate which should be higher at large redshifts when violent mergers have been more frequent than today. The dependance of on redshift also provides a natural explanation for the apparent discrepancy between our result (1) and the IRAS results: Counting on the superior sensitivity of the pointed ISOPHOT observations we deliberately biased our sample towards the high-redshift galaxies and quasars in the 3CR sample, while most IRAS samples are dominated by objects at moderate () or low redshift (, Heckman et al. 1994).


Top panel: as function of . Bottom panel: as function of spectral radio power at 178 MHz.
The redshift dependance of the in 3C radio galaxies is in intriguing coincidence with the statistical properties of the so-called “alignment effect” between the orientation of extended emission line regions (EELRs) around luminous radio galaxies and their radio axis (Chambers et al. 1987, McCarthy et al. 1987): Good to perfect alignments () are commonly found in 3C galaxies above while low redshift radio galaxies show hardly any significant alignment (Baum et al. 1988). The most popular explanation for this finding assumes that the aligned radio galaxies at high redshift contain a quasar core which emits its ionizing UV predominantly along the radio axis. In this interpretation the alignment effect could be used as further independent evidence for the unified scheme. In fact, three of the radio galaxies in our sample (3C 280, 3C 324, 3C 368) have long been known for their perfectly aligned and very extended emission line region ( kpc). In one of these sources, 3C 368, we find a strong mid- and far-infrared source with a luminosity of ; in 3C 324 we can only determine a rather high upper limit which is still compatible with a luminous quasar. Only 3C 280 (which has the smallest EELR of the three) seems to lie at the low end of the distribution.
Additionally, our sample contains one radio galaxy, 3C 65, which has been suspected to contain a hidden quasar (Lacy et al. 1995, Simpson et al. 1999). Indeed, together with 3C 351 and the archetypical quasar 3C 48, this radio galaxy exhibits the largest in our sample. From the three radio galaxies at detected with ISOPHOT, only 3C 325 has not been suspected of containing a quasar core on the basis of optical or NIR observations. Unfortunately, our MIR sensitivity for this source does not suffice to draw any conclusions about the presence of warm dust emitting at m. The same is true for the low-redshift galaxies 3C 20 and 3C 460. On the basis of the present data one cannot exclude the possibility that part of the FIR luminosity is generated by a starburst in the radio galaxy without direct connection to the active core. In fact, one might speculate what fraction of the FIR radiation (from dust at temperature K) in the other sources of our sample could be attributed to starburst activity in the host galaxy. Better sampled mid-infrared spectral energy distributions or spectroscopic data would be required to settle this issue. If off-nuclear sturbursts play indeed an important role in the overall FIR emission at m, the significance of the “FIR test” for unified schemes could be considerably weakened.
5 Conclusions
New ISOPHOT observations of 10 pairs of radio galaxies and quasars from the 3CR Catalogue between 5 and 180 m cannot find any statistical difference between the detection rate of radio galaxies and quasars. This is in perfect agreement with the unified scheme proposed by Barthel (1989) which postulates that radio galaxies and quasars are intrinsically identical objects only differing by the angle between the radio axis and the line of sight.
In an attempt to quantify the unification further, we introduce the ratio of the dust to radio emission: . While for quasars scatters by a factor of a few for all redshifts and radio powers, we find a clear trend with redshift for the radio galaxies:
At low redshifts hardly any of the galaxies reach the high dust-to-radio luminosity ratios typical for the quasars. This is roughly consistent with the conclusion drawn from the IRAS results that radio galaxies are about 4 weaker FIR sources than quasars. At the high redshift end , however, several radio galaxies show thermal dust emission in the mid- and far-infrared which is in every aspect comparable to that of the IR brightest quasars. Beyond any doubt, these sources contain a hidden quasar and thus favour the unified scheme. Since our ISOPHOT sample contains a much higher fraction of high redshift radio galaxies than any other radio/galaxy sample observed before in the FIR, we find for the first time a good agreement with the prediction of the unified scheme.
Interestingly, there exists independent evidence from the “alignment effect” between the extended emission line region around radio galaxies and the radio axis that many of the most luminous radio galaxies at contain a quasar.
On the basis of the current knowledge, we therefore propose the following refinement of Barthel’s unified scheme for luminous radio-sources: At every galaxy with extended radio luminosity W contains a quasar. At low redshift, even among the brightest radio galaxies there exist some sources with – compared to the radio power – under-luminous thermal cores. Maybe these “true” radio galaxies suffer from the exhaustion of the circum-nuclear fuel which governs the accretion rate onto the central black hole. The idea that many of today’s massive black holes are starving also finds support in the rapid decline of the density of optically selected quasars between and the local universe.
Acknowledgements.
It is a pleasure for us to thank Hans Ungerechts at IRAM for providing us with the monitoring fluxes of 3C273. For literature search and photometry NED and SIMBAD data bases were used. The development and operation of ISOPHOT and the Postoperation Phase are supported by MPIA and funds from Deutsches Zentrum für Luft-und Raumfahrt (DLR, formerly DARA). The ISOPHOT Data Centre is supported by DLR with funds from Bundesministerium für Bildung und Forschung, grant No. 50 QI98013. The authors are responsible for the contents of this paper. The Interactive Analysis tool PIA is a joint development by the ESA Astrophysics Division and the ISOPHOT consortium. We thank an anonymous referee for valuable comments which greatly improved the original manuscript.References
- (1) Antonucci R.R.J. 1993, Ann.Rev.AA 31, 473
- (2) Antonucci R.R.J., Miller J.S. 1985, ApJ 297, 621
- (3) Barthel P.D. 1989, ApJ 336, 606
- (4) Barthel P.D. and Arnaud, K.A. 1996, MNRAS 283, L45
- (5) Best P.N. Röttgering H.J.A., Bremer M.N., et al. 1998, MNRAS 301 L15
- (6) Baum S.A. Heckman T.M., Bridle A., van Breugel W.J.M., Miley G.K. 1988, ApJS 68, 643
- (7) Bennett A.S. 1962a, MNRAS 125, 75
- (8) Bennett A.S. 1962b, Mem. Royal Astron. Soc. 68, 163
- (9) Blandford R.D., Rees M. 1974, MNRAS 169, 395
- (10) Chambers K.C., Miley G.K., van Breugel W. 1987, Nature 329, 604
- (11) Haas M., Chini R., Meisenheimer K., et al. 1998, ApJ 503, L109
- (12) Haas M., Müller S.A.H., Chini R., et al. 2000, A&A 354, 453
- (13) Hargrave P.J., Ryle M. 1974, MNRAS 166, 305
- (14) Heckman T.M., Chambers K.C., Postman M., 1992, ApJ 391, 39
- (15) Heckman T.M., O’Dea C.P., Baum S.A., Laurikainen E., 1994, ApJ 428, 65
- (16) Hes R., Barthel P.D., Hoekstra H. 1995, A&A 303, 8
- (17) Jennison R.C., Das Gupta M.K. 1953, Nature, 172, 996.
- (18) Kessler M.F., Steinz J.A., Anderegg M.E., et al. 1996, A&A 315, L27
- (19) Kreysa E., Gemünd H.-P., Gromke J. et al. 1998, SPIE 3357, 319
- (20) Lacy M., Rawlings S., Eales S., Dunlop J.S. 1995, MNRAS 273, 821
- (21) Lawrence A., 1991, MNRAS 252, 586
- (22) Lemke D., Klaas U., Abolins J., et al. 1996, A&A 315, L64
- (23) Mc Carthy P.J, van Breugel W., Spinrad H., Djorgovski S. 1987, ApJ 321, L29
- (24) Meisenheimer K., Yates M.G., Röser H.-J. 1997, A&A 325, 57
- (25) Miller J.S., Antonucci R.R.J. 1983, ApJ 271, L7
- (26) Orr M.J.L., Browne I.W.A. 1982, MNRAS 200, 1067
- (27) Pier E.A., Krolik J.H 1992, ApJ 401, 99
- (28) Pier E.A., Krolik J.H 1993, ApJ 418, 673
- (29) Rawlings, S., Saunders, R. 1991, Nature 349, 138.
- (30) Robson E.I., Leeuw L.L., Stevens, J.A., Holland W.S. 1998, MNRAS 301, 935
- (31) Röser, H.-J., Meisenheimer, K., Neumann, M., Conway, R.G, Perley, R.A., 2000, A&A 360, 99.
- (32) Scheuer P.A.G. 1974, MNRAS 166, 513
- (33) Scheuer P.A.G. and Readhead, A.C.S. 1971, Nature 277, 182
- (34) Simpson C., Rawlings S., Lacy M. 1999, MNRAS 306, 828
- (35) Spinrad H., Marr J., Aguilar L., Djorgovski S. 1985, PASP 97, 932
- (36) Steppe H., Salter C.J., Chini R., et al. 1988, A&AS 75, 317
- (37) Steppe H., Liechti S., Mauersberger R., et al. 1992, A&AS 96, 441
- (38) Stevens J. A., Robson E.I., Gear W.K., et al. 1998 ApJ 502, 182
- (39) Türler M., Paltani S., Courvoisier T.J.-L. et al. 1999, A&AS 134, 89
- (40) Urry C.M., Padovani P. 1995, PASP 715, 803
- (41) van Bemmel I., Barthel P., de Graauw Th. 2000, A&A 359, 523
- (42) Whitney, A.R., Shapiro, I.I., Rogers, A.E.E. et al. 1971, Science 173, 225.