Cluster Evolution in the ROSAT North Ecliptic Pole Survey
Abstract
The deepest region of the ROSAT AllSky Survey, at the North Ecliptic Pole, has been studied to produce a complete and unbiased X-ray selected sample of clusters of galaxies. This sample is used to investigate the nature of cluster evolution and explore potential implications for large-scale structure models. The survey is 99.6% optically identified. Spectroscopic redshifts have been measured for all the extragalactic identifications. In this Letter, first results on cluster evolution are presented based on a comparison between the number of the observed clusters in the North Ecliptic Pole survey and the number of expected clusters assuming no-evolution models. At there is a deficit of clusters with respect to the local universe which is significant at 4.7. The evolution appears to commence at L erg s-1 in our data. The negative evolution goes in the same direction as the original EMSS result, the results from the 160 deg2 survey by Vikhlinin et al. (1998) and the recent results from the RDCS (Rosati et al. 2000). At lower redshifts there is no evidence for evolution, a result in agreement with these and other cluster surveys.
1 Introduction
Since the X-ray surveys of the early 1980s, there has been remarkable progress in the construction of homogeneous samples of X-ray selected clusters over large redshift baselines. X-ray surveys are sensitive enough to detect objects at redshifts of order unity (e.g. MS105403 at z0.83, Gioia and Luppino (1994); RXJ0848.9+4452 at , Rosati et al. (1999)). Large optical telescopes have the capability to locate them and measure their redshifts. The properties of clusters in this high redshift range constrain cosmological parameters since some evolution is expected in the look-back time that approaches half the age of the universe. Observations of the highest redshift systems provide the longest lever arm in the attempt to evaluate the evolution of the bulk properties of clusters. In 1986 Kaiser predicted that if one assumes a power-law fluctuation power spectrum and gas heated only by adiabatic compression during the collapse of the cluster dark matter halo, then the comoving number density of clusters should increase, for clusters with fixed X-ray luminosity, rather than decrease with redshift. The observed lack of high-z and X-ray luminous clusters reported in the early years (Gioia et al. 1990a ; Edge et al. (1990); Henry et al. (1992)) is in conflict with this model. However, when models with additional heat (or entropy) are assumed then negative evolution is predicted for only the very bright clusters (L erg s-1), with little evolution at lower luminosities (Kaiser (1991); Evrard (1990); Evrard and Henry (1991); among others).
What do we know today about the evolution of the cluster X-ray luminosity function (XLF)? All the determinations of the cluster XLF derived from existing surveys are in agreement for low redshifts () and for low luminosities (L erg s-1) at high redshift. However, there is no unanimity regarding the most luminous and most distant X-ray clusters known, though there may be an accumulation of evidence in favor of evolution. The Extended Medium Sensitivity Survey (EMSS; Gioia et al. 1990b ; Stocke et al. (1991); Maccacaro et al. (1994); Gioia and Luppino (1994)) was the first dataset where negative evolution was detected (3 confidence level) between low redshift (0.140.2) and high redshift (0.30.6) clusters, but only at luminosities L erg s-1 (Gioia et al. 1990a ; Henry et al. (1992)). Nichol and collaborators (1997) questioned these results. They revisited the EMSS XLF using a combination of the original Einstein Observatory data and ROSAT follow-up observations and reduced the significance of evolution for to only the 1 level. However one of the latest studies of evolution of the EMSS sample by the same group, using the same data (Reichart et al. (1999)), finds a deficit of a factor of 45 for X-ray clusters at redshift at luminosities above erg s-1 in 0.33.5 keV band.
The controversial issue of the cluster XLF evolution inspired many EMSS-style cluster surveys, all based on ROSAT archival deep pointing images. Each one of these surveys covers an area of sky of less than 200 deg2, significantly less than the deg2 of the original EMSS (see Henry et al. 2001 for details on the ROSAT surveys sky coverages), but with sensitivities almost an order of magnitude deeper at the faint end ( erg cm-2 s-1 vs erg cm-2 s-1 in 0.33.5 keV 111The conversion from 0.52.0 keV to 0.33.5 keV is a multiplicative factor of 1.8, assuming a Raymond-Smith model with a kT6.0 keV and the standard 0.3 solar abundance.). Results are available for most of the ROSAT surveys and are summarized here. Collins et al. (1997) and Burke et al. (1997) find no evolution in the Southern SHARC survey (Serendipitous High-Redshift Archival Rosat Cluster) based on 16 clusters in the redshift range 0.30.7 and luminosities up to 3 erg sec-1 in the 0.52.0 keV band. However, in the most recent Bright SHARC sample, (which is a different sample, see Romer et al. (2000) for details) Nichol et al. (1999) find a deficit of high z clusters compared to what is expected from a non-evolving XLF. No significant evolution is found in the RDCS sample (Rosat Deep Cluster Survey; Rosati et al. 1995 and 1998) for L erg s-1 out to z0.8. By adding the most distant clusters out to Rosati et al. (2000) present evidence for negative evolution of the XLF. The 160 deg2 survey by Vikhlinin et al. (1998), detects a deficit of clusters with L erg s-1 of a factor (see also Vikhlinin et al. (2000)). On the other hand, Jones et al. (1998; 2000) exclude a strong negative evolution of the most luminous and distant clusters extracted from the WARPS (Wide Angle Pointed Rosat Survey; Scharf et al. (1997)). Thus, except for the WARPS results, a consistent picture emerges from the existing X-ray surveys. No significant evolution is found for the low luminosity clusters up to , but evolution of the most luminous clusters to is not excluded.
In this Letter we present evidence regarding the evolution of the cluster population based on the ROSAT All-Sky Survey observations around the North Ecliptic Pole region (NEP). By comparing the number of detected NEP clusters with predictions from no-evolution models, we find agreement between the results reported here and the original findings of the EMSS. Throughout this Letter we use H50 km s-1 Mpc -1 and q0.5.
2 The ROSAT NEP survey
The ROSAT NEP survey covers a region of the deepest area of the ROSAT All-Sky Survey (RASS; Trümper et al. (1991); Voges et al. (1999)) where the scan circles converge and the effective exposure time approaches ks (note that only 50% of the sky in the RASS has an exposure time 400 s). An overview of the ROSAT NEP survey and of the X-ray data can be found in Henry et al. 2001 and Voges et al. 2001. The main difference between the NEP survey and the existing X-ray serendipitous cluster surveys described above is that the NEP survey is both deep (median flux limit is f erg cm-2 s-1) and also covers a contiguous area of sky. Thus our database can be used to examine large-scale structure in the cluster distribution. A concentration of 21 groups and clusters was indeed found during the analysis of the NEP sources. The discovery of this supercluster is reported in another Letter in this issue (Mullis et al. 2001).
Here we briefly mention the main properties of the NEP survey. A total of 445 X-ray sources were detected with flux determinations in the keV band using the RASS-II processing (described in detail in Voges et al. (1999)). We have spectroscopically identified all but two sources in the survey. Redshifts have been measured for the extragalactic population (except for the very few previously cataloged objects). We have extracted a complete and unbiased sample of 64 galaxy clusters. Nineteen clusters have a redshift greater than 0.3 with the highest at z0.81.
3 The ROSAT NEP Cluster XLF
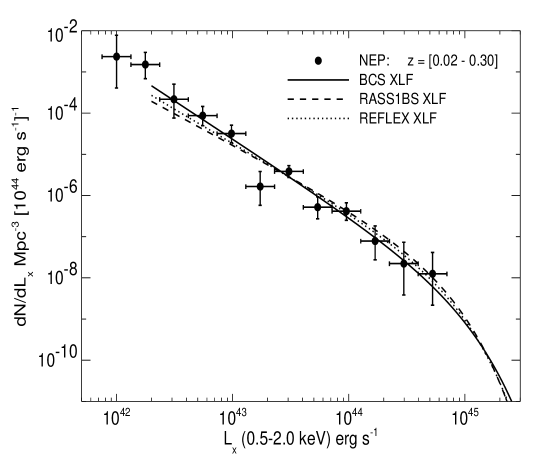
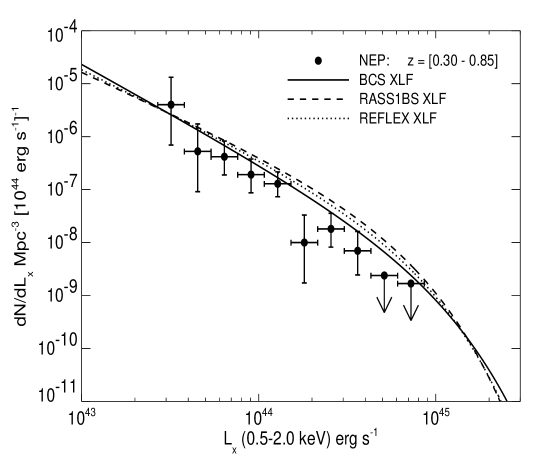
The local cluster XLF has been derived by several authors (Burns et al. (1996); Ebeling et al. (1997); De Grandi et al. (1999) among others) since it provides a crucial reference for cluster evolutionary studies at high redshift. Two determinations of the NEP cluster XLF have been computed, one for clusters with z0.3 and one for clusters with z0.3. A non-parametric representation of the differential XLF has been obtained following the 1/Va method (Avni & Bahcall (1980)). We use three local (z0.3) luminosity functions derived from the southern hemisphere RASS1 Bright Sample (De Grandi et al. (1999)), the southern hemisphere REFLEX sample (Böringer et al. 1998; Guzzo et al. 1999) and the northern hemisphere BCS sample (Ebeling et al. (1997)). All three samples were selected from the ROSAT All-Sky Survey with somewhat different selection procedures and data analysis techniques. The RASS1, REFLEX and BCS contain 126, 452, and 199 cluster respectively. The top panel in Figure 1 shows the NEP cluster luminosity function in the redshift range (0.02z0.3) with the local XLFs overplotted. The vertical error bars are derived from Poisson statistics on the number of clusters in each bin while the horizontal error bars represent the logarithmic bin width. In the bottom panel of Figure 1 the distant cluster (0.3z0.85) XLF is shown. While the NEP local XLF is in agreement with independent determinations by other authors using different datasets, the distant cluster XLF shows deviation from both the RASS1, the REFLEX and BCS XLFs at luminosities greater than erg s-1, the center of our first luminosity bin significantly below the low redshift XLF.
4 A deficit of clusters at high z and high LX
The number of observed clusters has been compared to the number of expected clusters, assuming no-evolution models. We have used a 5 ′ radius detect cell to derive background subtracted counts in the ROSAT keV band. A King profile with =2/3 and a core radius of 0.25 Mpc convolved with the RASS PSF has been integrated out to infinity to compute total cluster fluxes, quoted in the hard keV band. K-corrected luminosities are computed assuming a temperature based on the L relation of White et al. (1997). The three local luminosity functions derived from the RASS1, REFLEX and BCS have been folded through the NEP sky coverage and then integrated in the appropriate redshift and luminosity ranges. The ranges of integration were and in redshift, and erg s-1 in luminosity (0.5-2.0 keV). For the redshift range, the number of clusters expected from the three local samples and observed in the NEP are consistent, with the the significance of difference equal to . For the range a value of 65.5 clusters is expected according to the RASS1, a value of 55.9 according to the REFLEX and a value of 44.2 according to the BCS. Only 19 NEP clusters are observed in the same redshift and luminosity ranges. The significance of deviation is 6.4, 7.2 or 4.7 depending on which of the three local XLF sample determinations is considered (see Table 1 for details). This result goes in the same direction as the evolution derived from the EMSS survey.
5 The NEP Cluster LogN(S)-logS relation
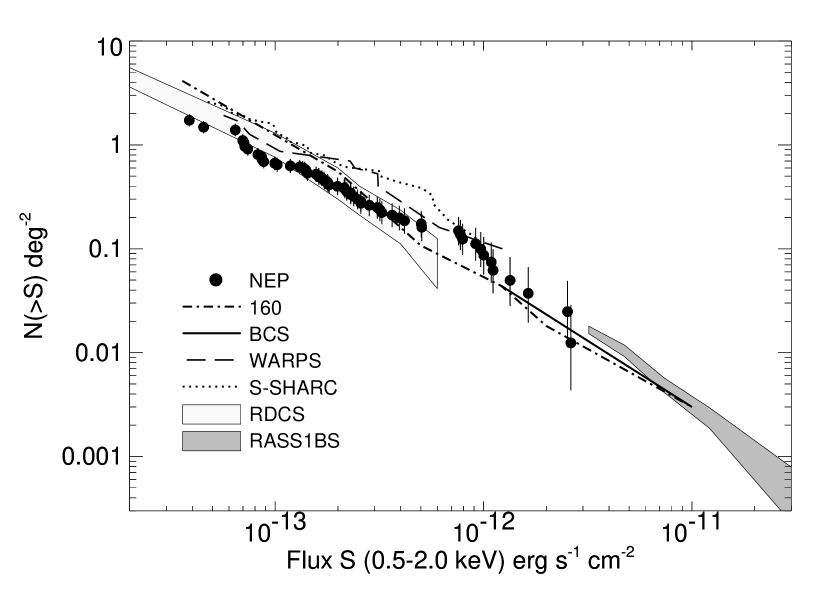
The cumulative (integral) number counts of galaxy clusters are a less stringent constraint than the differential cluster XLF as a test of evolution of the population. It is shown to verify reliability of sky coverage plus completeness of identifications. It is useful to compare the number counts of the NEP clusters with the existing LogN(S)-logS relations derived by other investigators. The observed cumulative LogN(S)-logS for the NEP clusters is given in Figure 2. Shown are also the number counts derived from the 160 deg2 (Vikhlinin et al. 1998), the BCS (Ebeling et al. 1997), the WARPS (Jones et al. 1998), the S-SHARC (Burke et al. 2001), the RDCS (Rosati et al 1998), and the RASS1-BS (De Grandi et al. 1999). The NEP cluster number counts are in agreement within the errors with all the other independent determinations.
6 Conclusions
In the last nine years we have spectroscopically identified all but two of the 445 NEP sources, thus reaching an identification rate of 99.6%. The resulting complete cluster sample contains 64 clusters, 19 at a redshift 0.3. We find evidence for a deficit of clusters at L erg s-1 and compared to expectations from a non-evolving XLF. These results go in the same direction as those of other surveys. The EMSS, 160 deg2, SHARC, RDCS and NEP surveys are now reporting negative evolution at varying levels of significance from 1 to greater than 5. The NEP survey (this Letter) excludes the no-evolution model at at 4.7, 6.4 or 7.2, depending on the local XLF considered; the 160 deg2 survey (Vikhlinin et al. 2000) claims a deficit with respect to the BCS significant at the 3.5; the Bright SHARC survey (Nichol et al. 1999) claims a deficit of clusters significant at 1.7 (1.1) with respect to the no-evolution prediction of the RASS1 (BCS); the RDCS (Rosati et al. 2000) finds a departure of their best fit model from the no-evolution BCS prediction significant at more than 3; finally an analysis of ASCA data of EMSS clusters (Henry 2001), using the same approach adopted here, finds a deficit of EMSS clusters compared to the RASS1 and BCS predictions significant at 5. The only completely, or nearly completely, analyzed cluster sample that does not find negative evolution is the WARPS. Evidence is thus accumulating in favor of evolution at the high luminosity end of the XLF at high z. However, given the small number statistics and incomplete optical follow-ups of some of the existing serendipitous cluster surveys, the issue has not been completely resolved yet. We stress that all but two NEP sources have been optically identified. This practically complete identification rate gives us confidence that the deficit of clusters seen is not due to the fact that clusters have been missed. Larger and better characterized samples are needed to address with greater confidence the evolutionary properties of the cluster population. The large X-ray telescopes now in orbit (Chandra and XMM-Newton) will not be able to provide in the near future serendipitous surveys of size comparable to what already exists. However, with their high throughput and energy resolution it will be possible to obtain a spectral determination for a very large number of clusters, and thus more reliable flux measurements which will help reducing some of the systematic uncertainties in the derived XLF and number counts of clusters of galaxies.
References
- Avni & Bahcall (1980) Avni, Y., and Bahcall, J.N., 1980, ApJ, 235, 694
- Böhringer et al. (1998) Böhringer, H., et al., 1998, The Messenger, 94, p. 21
- Burns et al. (1996) Burns, J.O., Ledlow, M.J., Loken, C., Klypin, A., Voges, W., Bryan, G.L., Norman, M.L. and White, R.A., 1996, ApJ, 467, L49
- Burke et al. (1997) Burke, D.J., Collins, C.A., Sharples, R.M., Romer, A.K., Holden, B.P. and Nichol, R.C., 1997, ApJ, 488. L83
- Burke et al. (2001) Burke D.J. et al. 2001, in preparation
- Collins et al. (1997) Collins, C.A., Burke, D.J., Romer, A.K., Sharples, R.M. and Nichol R.C., 1997, ApJ, 479, L117
- De Grandi et al. (1999) De Grandi, S., Guzzo, L., Böhringer, H., Molendi, S., Chincarini, G., Collins, C., Cruddace, R., Neumann, D., Schindler, S., Schuecker, P., Voges, W., 1999, ApJ, 513, L17
- Ebeling et al. (1997) Ebeling, H., Edge, A.C., Böhringer, H., Allen, S.W., Crawford, C.S., Fabian, A.C., Voges, W. and Huchra, J.P., 1997, MNRAS, 301, 881
- Edge et al. (1990) Edge, A.C., Stewart, G.C., Fabian, A.C. and Arnaud, K.A., 1990 MNRAS, 245, 559
- Evrard (1990) Evrard, A.E., 1990, ApJ, 363, 349
- Evrard and Henry (1991) Evrard, A.G., and Henry, J.P., 1991, ApJ, 383, 95
- (12) Gioia, I.M., Henry, J.P., Maccacaro, T., Morris, S.L., Stocke, J.T. and Wolter, A., 1990a, ApJ, 356, L35
- (13) Gioia, I.M., Maccacaro, T., Morris, S. L., Schild, R.E., Stocke, J.T., Wolter, A. and Henry, J.P., 1990b, ApJS, 72, 567
- Gioia and Luppino (1994) Gioia, I.M. and Luppino, G.A., 1994, ApJS, 94, 583
- Guzzo et al. (1999) Guzzo, L. et al., 1999, The Messenger, 95, p. 27
- Henry et al. (1992) Henry, J.P., Gioia, I.M., Maccacaro, T., Morris, S.L., Stocke, J.T. and Wolter, A., 1992, ApJ, 389, 491
- Henry et al. (2001) Henry, J.P., Gioia, I.M., Mullis, C.R., Voges, W., Briel, U.G., Böhringer, H. and Huchra, J.P., 2001, ApJ, submitted
- Hnery (2001) Henry, 2001, in preparation
- Jones et al. (1998) Jones, L.R., Scharf, C., Ebeling, H., Perlman, E., Wegner, G., Malkan, M. and Horner, D., 1998, ApJ, 495, 100
- Jones et al. (2000) Jones, L.R., Ebeling, H., Scharf, C., Perlman, E., Horner, D., Fairley, B., Wegner, G. and Malkan, M., 2000, in “Large-Scale Structure in the X-ray Universe”, eds. Plionis, M. & Georgantopoulos, I., Atlantisciences, Paris, France, p. 35
- Kaiser (1986) Kaiser, N., 1986, MNRAS, 222, 323
- Kaiser (1991) Kaiser, N., 1991, ApJ, 383, 104
- Maccacaro et al. (1994) Maccacaro, T., Wolter, A., McLean B., Gioia, I.M., Stocke, J,T., Della Ceca, R., Burg, R., and Faccini, R., 1994, Astrophys. Letters and Communications, 29, 1.
- Mullis et al. (2001) Mullis, C.R., Henry, J.P., Gioia, I.M., Böhringer, H., Briel, U.G., Voges, W., and Huchra, J.P. 2001, ApJ, submitted
- Nichol et al. (1997) Nichol, R.C., Holden, B.P., Romer, A.K., Ulmer, M.P., Burke, D.J. and Collins, C.A., 1997, ApJ, 481, 644
- Nichol et al. (1999) Nichol, R.C., Romer, A.K., Holden, B.P., Ulmer, M.P., Pildis, R.A., Adami, C., Merrelli, A.J., Burke, D.J. and Collins, C.A., 1999, ApJ, 521, L21
- Reichart et al. (1999) Reichart, D.E., Nichol, R.C., Castander, F.J., Burke, D.J., Romer, A.K., Holden, B.P., Collins, C.A. and Ulmer, M.P., 1999, ApJ, 518, 532
- Romer et al. (2000) Romer, A.K., Nichol, R.C., Holden, B.P., Ulmer, M.P., Pildis, R.A.,Merrelli, A.J., Adami, C., Burke, D.J., Collins, C.A., Metevier, A.J., Kron, R.G. and Commons, K., 2000, ApJS, 126, 209
- Rosati et al. (1995) Rosati, P., Della Ceca, R., Norman, C. and Giacconi, R., 1995, ApJ, 445, L11
- Rosati et al. (1998) Rosati, P., Della Ceca, R., Norman, C. and Giacconi, R., 1998, ApJ, 492, L21
- Rosati et al. (1999) Rosati, P., Stanford, S.A., Eisenhardt, P.R., Elston, R., Spinrad, H., Stern, D. and Dey, A., 1999, AJ, 118, 76
- Rosati (2000) Rosati, P., Borgani, S., Della Ceca, R., Stanford, A., Eisenhardt, P. and Lidman, C., 2000, in “Large-Scale Structure in the X-ray Universe”, eds. Plionis, M. & Georgantopoulos, I., Atlantisciences, Paris, France, p. 13
- Scharf et al. (1997) Scharf, C., Jones, L.R., Ebeling, H., Perlman, E., Malkan, M. and Wegner, G., 1997, ApJ, 477, 79
- Stocke et al. (1991) Stocke, J.T., Morris, S.L., Gioia, I.M., Maccacaro, T., Schild, R.E., Wolter, A., Fleming, T.A. and Henry, J.P., 1991, ApJS, 76, 813
- Trümper et al. (1991) Trümper, J., et al. 1991, Nature, 349, 579
- Vikhlinin et al. (1998) Vikhlinin, A., McNamara, B.R., Forman, W., Jones, C., Quintana, H. and Hornstrup A., 1998, ApJ, 498, L21
- Vikhlinin et al. (2000) Vikhlinin, A., McNamara, Quintana, H., Mullis, C.R., Gioia, I.M., Henry, J.P., Hornstrup, A., Forman, W. and Jones, C., 2000, in “Large-Scale Structure in the X-ray Universe”, eds. Plionis, M. & Georgantopoulos, I., Atlantisciences, Paris, France, p. 31
- Voges et al. (1999) Voges, W., et al. 1999, A&A, 349, 389
- Voges et al. (2001) Voges, Henry, J.P., W., Briel, U.G., Böhringer, H., Mullis, C.R., Gioia, I.M. and Huchra, J.P., 2001, ApJ, submitted
- White et al. (1997) White, D.A., Jones, C. & Forman, W., 1997, MNRAS, 292, 419
| LX range | Redshift | No-evolution | Observed | Significance of |
|---|---|---|---|---|
| erg s-1 | Predictions | in NEP | difference () | |
| RASS1aa126 clusters | RASS1 | |||
| REFLEXbb452 clusters | REFLEX | |||
| BCScc199 clusters | BCS | |||
| z0.3 | 44.54.0ddThe fractional errors in this column are the inverse of the square root of the total number of objects in the respective samples | 456.7ee The errors in this column are the square root of the number of clusters observed | 0.1 | |
| 43.42.0 | 0.2 | |||
| 44.23.1 | 0.1 | |||
| 0.30.85 | 65.55.8 | 194.4 | 6.4 | |
| 55.92.6 | 7.2 | |||
| 44.23.1 | 4.7 | |||