DIRECT Distances to Nearby Galaxies Using Detached Eclipsing Binaries and Cepheids. VII. Additional Variables in the Field M33A Discovered with Image Subtraction111Based on observations obtained with the 2.1m telescope at the Kitt Peak National Observatory.
Abstract
DIRECT is a project to obtain directly the distances to two Local Group galaxies, M31 and M33, which occupy a crucial position near the bottom of the cosmological distance ladder.
As the first step of the DIRECT project we have searched for detached eclipsing binaries (DEBs) and new Cepheids in the M31 and M33 galaxies with 1m-class telescopes. In this seventh paper we present a catalog of variable stars discovered in the data from the followup observations of DEB system D33J013346.2+304439.9 in field M33A , collected with the Kitt Peak National Observatory 2.1m telescope. In our search covering an area of we have found 434 variable stars: 63 eclipsing binaries, 305 Cepheids, and 66 other periodic, possible long period or non-periodic variables. Of these variables 280 are newly discovered, mainly short-period and/or faint Cepheids. Their light curves were extracted using the ISIS image subtraction package. For 85% of the variables we present light curves in standard and magnitudes, with the remaining 15% expressed in units of differential flux.
We have discovered a population of first overtone Cepheid candidates and for eight of them we present strong arguments in favor of this interpretation.
We also report on the detection of a non-linearity in the KPNO T2KA and T1KA cameras.
The catalog of variables, as well as their photometry (about BV measurements) and finding charts, is available electronically via anonymous ftp and the World Wide Web. The complete set of the CCD frames is available upon request.
1 Introduction
Starting in 1996 we undertook a long term project, DIRECT (i.e. “direct distances”), to obtain the distances to two important galaxies in the cosmological distance ladder, M31 and M33. These “direct” distances will be obtained by determining the distance of Cepheids using the Baade-Wesselink method and by measuring the absolute distance to detached eclipsing binaries (DEBs). While the cosmological distance scale has been the subject of numerous recent observation campaigns, especially those enabled by the Hubble Space Telescope (HST) and massive variability studies of the Magellanic clouds, M33 has not been re-surveyed since the photographic survey of Kinman, Mould & Wood (1987).
M31 and M33 are the stepping stones to most of our current effort to understand the evolving universe at large scales. First, they are essential to the calibration of the extragalactic distance scale. Second, they constrain population synthesis models for early galaxy formation and evolution and provide the stellar luminosity calibration. There is one simple requirement for all this—accurate distances. These distances are now known to no better than 10-15%, as there are discrepancies of between various distance indicators (e.g. Huterer, Sasselov & Schechter 1995; Holland 1998; Stanek & Garnavich 1998).
DEBs have the potential to establish distances to M31 and M33 with an unprecedented accuracy of better than 5% and possibly to better than 1%. Detached eclipsing binaries (for reviews see Andersen 1991; Paczyński 1997) offer a single step distance determination to nearby galaxies and may therefore provide an accurate zero point calibration of various distance indicators – a major step towards very accurate determination of the Hubble constant, presently an important but daunting problem for astrophysicists. DEBs have been recently used to obtain accurate distance estimate to the Large Magellanic Cloud (e.g. Guinan et al. 1998; Udalski et al. 1998).
The detached eclipsing binaries have yet to be used as distance indicators to M31 and M33. According to Hilditch (1996) there was only one eclipsing binary of any kind known in M33 (Hubble 1926). The recent availability of large-format CCD detectors and inexpensive CPUs has made it possible to organize a massive search for periodic variables, which will produce a handful of good DEB candidates. These can then be spectroscopically followed-up with the powerful new 6.5-10 meter telescopes.
The study of Cepheids in M33 has a venerable history (Hubble 1926). Freedman, Wilson & Madore (1991) obtained multi-band CCD photometry of some of the Cepheids discovered in photographic surveys, to build a period-luminosity relations in M33. However, the sparse photometry and the small sample (11 Cepheids) do not provide a good basis for obtaining direct Baade-Wesselink distances (see, e.g., Krockenberger, Sasselov & Noyes 1997) to Cepheids—the need for new digital photometry has been long overdue.
As the first step of the DIRECT project we have searched for DEBs and new Cepheids in the M31 and M33 galaxies. We have analyzed five fields in M31, A-D and F (Kaluzny et al. 1998, 1999; Mochejska et al. 1999; Stanek et al. 1998, 1999; hereafter Papers I, IV, V, II, III). A total of 410 variables, mostly new, were found: 48 eclipsing binaries, 206 Cepheids and 156 other periodic, possible long-period or non-periodic variables. We have also analyzed two fields in M33, A and B (Macri et al. 2001a; hereafter Paper VI) and found 544 variables: 47 eclipsing binaries, 251 Cepheids and 246 other variables.
As a second step, we started followup observations of selected DEBs in both the M31 and M33 galaxies with bigger telescopes in order to construct more precise and well sampled light curves for them.
In this paper, seventh in the series, we present a catalog of variable stars found in the same field as the detached eclipsing binary D33J013346.2+304439.9 using followup observations collected at the Kitt Peak National Observatory 2.1m telescope. The paper is organized as follows: Section 2 provides a description of the observations. The data reduction procedure is outlined in Section 3. The catalog of variable stars is presented in Section 4, followed by its brief discussion in Section 5. Section 6 deals with the first overtone Cepheid candidates. The concluding remarks are stated in Section 7.
2 Observations
The data discussed in this paper was obtained at the Kitt Peak National Observatory222Kitt Peak National Observatory is a division of NOAO, which are operated by the Association of Universities for Research in Astronomy, Inc. under cooperative agreement with the National Science Foundation. 2.1m telescope equipped with a Tektronix CCD (T2KA camera) having a pixel scale during two separate runs, from September 29th to October 5th, 1999 and from November 1st to 7th, 1999. The primary observing targets were three detached eclipsing binaries, one in each of the fields M33A, M33B and M31A, discovered previously as part of the DIRECT project (Papers VI and II). For field M33A we collected exposures in the filter and in the filter.333The complete list of exposures for this field and related data files are available through anonymous ftp on cfa-ftp.harvard.edu, in pub/kstanek/DIRECT directory. Please retrieve the README file for instructions. Additional information on the DIRECT project is available through the WWW at http://cfa-www.harvard.edu/~kstanek/DIRECT/. The exposure times varied slightly to compensate for the changes of seeing conditions. The typical seeing was . The field was observed through airmass ranging from 1 to 1.9, with the average at 1.2. The completeness of our data starts to drop rapidly at about 21.2 mag in and 21.8 mag in , judging from the magnitude distributions of the variable stars (Fig. 1).

3 Data reduction
3.1 Correction for the non-linearity of the T2KA camera
During the second night of the first observing run we compared the photometry from two images of NGC 7789 with differing exposure times and found that the camera had a non-linear response. To lessen the impact of non-linearity we reduced the gain setting from 5.1 to 3.6 /ADU.
Several sets of calibration frames were collected at both gain settings for the purpose of correcting the data for the non-linearity. Each set consisted of a series of dome flats with intensities from ADU to ADU. After subtracting the readout bias under IRAF444IRAF is distributed by the National Optical Astronomy Observatories, which are operated by the Association of Universities for Research in Astronomy, Inc., under cooperative agreement with the NSF. the mode intensity (in ADU) was computed for each calibration frame.
We adopted the correction function for the non-linearity in the same form as in the IRAF task IRLINCOR:
| (1) |
where is the mode observed intensity on the calibration frame, the intensity corrected to the expected level and the coefficients are to be determined. The exposure time, corrected for the shutter speed (0.1 s), was used to calculate the expected intensity from the measured intensity level :
By definition the detector response was assumed to be linear at the intensity level of the image with the shortest exposure time . The coefficients , and were determined from a least-squares fit of Eq. 1 to the measured and expected intensity levels and . We list them in Tab. 1 for the two gain settings used.

| gain (/ADU) | |||
|---|---|---|---|
| 3.6 | 0.983282 | 0.0765595 | 0.0252555 |
| 5.1 | 0.967008 | 0.0354981 | 0.0314427 |
Figure 2 shows the difference between the expected intensity and the measured intensity as a function of the measured intensity for gain 3.6/ADU. Each point corresponds to a calibration exposure. Exposures from the same set are marked with like symbols. The points exhibit substantial scatter between the sets and in some cases within the set (ie. open stars and open triangles). Several fits were made to different combinations of sets. The derived coefficients were then tested on pairs of frames of the same object with exposure times differing by a factor of at least 10. The fit corresponding to the best coefficients is shown with a dotted line on Fig. 2. The calibration frames used in the fit are indicated by filled symbols.
A comparison between the photometry derived from a 100s and a 10s exposure of the NGC 7789 open cluster is presented in Fig.3. The left panel shows a comparison for the uncorrected exposures and the right panel for the corrected ones. A significant improvement is seen between the uncorrected and corrected frames. A close inspection of the right panel of the figure will reveal that the non-linearity has not been removed completely.
The standard preliminary processing of the science data was performed with the routines in the IRAF CCDPROC package. The non-linearity was corrected with the IRLINCOR task using the derived coefficients.
3.2 Nonlinearity of the T1KA CCD
During an observing run in October 1998 at the KPNO 2.1 meter telescope we have collected data using the T1KA CCD. We have compared a series of images of an open cluster, Be 32, which were obtained one after another in photometric conditions (Fig. 4). The images vary only in exposure times (starting at 6 seconds and going up to 180 seconds). We have found that the magnitudes (obtained via point spread function fitting + aperture correction) do not differ by the expected factor of 2.5 log (time), but rather show increasing deviations from the expected scaling as the difference in exposure time gets larger. Furthermore, the relations show strong non-linearity, which increases with the difference in exposure time. This fact was not known to us during the time of observations and no calibration frames were collected to correct the data. We provide this information to warn the astronomical community of the problem we have encountered with this camera.


3.3 Photometry and Selection of Variables
The photometry for the variable stars was extracted using the ISIS image subtraction package (Alard & Lupton 1998, Alard 2000a) from the and -band data.
The ISIS reduction procedure consists of several steps. Initially all of the frames are transformed to a common coordinate grid. Next a reference image is created by stacking several frames with the best seeing. For each frame the reference image is convoluted with a kernel to match its point spread function (PSF) and then subtracted. On the subtracted images the constant stars will cancel out and only the signal from variable stars should remain. A median image is constructed of all the subtracted images and the variable stars are identified as bright peaks on it. Finally, profile photometry is extracted from the subtracted images.
All of the computations were performed with the frames internally subdivided into four sections (the ISIS parameters sub_x and sub_y set to 2). The differential brightness variations of the background were fit with a second degree polynomial (deg_bg=2). A convolution kernel varying quadratically with position was chosen (deg_spatial=2).
An image of particularly good quality was selected as the template frame for the stellar positions. The remaining images were re-mapped to the template frame coordinate system using a third degree polynomial transform. During this step an initial rejection of cosmic rays was also performed. A setting of 1.0 for the cosmic ray threshold (COSMIC_THRESH) was used.
A reference image was then constructed from 25 images with the best seeing. The minimum, maximum and average seeing of these 25 images were , and in and , and in . The constituent images were transformed to the same seeing and background level as the best image (the template in our case) and stacked by taking a median in each pixel to obtain the reference image virtually free of cosmic rays.
Image subtraction was then applied to all the frames. For each frame the reference image was convoluted with a kernel to match it as closely as possible and then the frame was subtracted from it. As the flux of the non-variable stars on both images should be almost identical, such objects will disappear from the subtracted image. The only remaining signal will come from variable stars.
To obtain a better signal-to-noise ratio a median of the subtracted images was computed for the purpose of detecting variable stars. The variables were then identified as bright peaks on this image. In practice the situation is slightly complicated by the presence of stars saturated on the reference image, as their profiles were not matched exactly to those on frames with inferior seeing. An easy way to distinguish genuine variables from saturated stars is by their profile on the subtracted image: it should be smooth for the variables and usually contains a flat top or a dip at the center for the saturated stars. The variables were identified visually on the median subtracted image and their positions recorded with the IMEXAMINE task under IRAF. The final positions were derived with the daophot FIND subroutine (Stetson 1987). Variables were identified in both bands. The lists were then merged into a master variable list.
The light curves of the variables (in ADU) were extracted from the subtracted images. Preliminary periods were found with the ISIS czerny subroutine, based on the analysis of variance method, as described by Schwarzenberg-Czerny (1989), and later refined using the same algorithm. Stars with chaotic and/or noisy light curves were rejected from the sample upon visual inspection.
In the next step the light curves were converted into magnitudes. PSF-fitting photometry was extracted with the daophot/allstar package from the template image following the approach described in Paper I. Some of the variable stars were not detected on the template, in most cases because of their faintness or crowding. As light curves of these stars could not be converted to magnitudes, they were left expressed in counts.
The template instrumental magnitude of each variable was converted into counts , using the Allstar zeropoint of 25 mag. The light curve was then converted point by point to magnitudes , by computing the total flux for the given epoch as the sum of the counts on the template and the counts on the subtracted template image decreased by the counts corresponding to the subtracted image .
| (2) |
The flux was converted to instrumental magnitudes, using the same zero point as above. To convert the photometric error from counts to magnitudes, we used the following relation:
| (3) |
3.4 Photometric Calibration and Astrometry
On the nights of October 3/4 and November 3/4 1999 we observed a total of 75 stars in 13 Landolt (1992) fields. We attempted to derive a calibration from these exposures, corrected for non-linearity. The o-c residuals showed a clear dependence on magnitude, especially in the -band, where they exhibited a very similar slope on both nights. Several new fits to Eq. 1 with different combinations of data sets were tried. Those that gave some improvement in the calibration, produced noticeably inferior results when the photometry on two images of very different exposure times was compared. We had decided to stay with the initial values for the correction coefficients (Tab. 1) and calibrate our photometry using a different method. The coefficients for the color terms were derived from the comparison of our NGC 6791 photometry with the data from the KPNO 0.9m telescope (Kaluzny & Udalski 1992). The offsets were determined relative to the DIRECT catalog of stellar objects in M33 (Macri et al. 2001b). The following transformations were adopted:
The instrumental and -band light curves of the variables were transformed to the standard system by adding the appropriate offsets, as the coefficients next to the color terms are very small.
Equatorial coordinates were determined for the template star list, expanded with the variables with no -band photometry. The transformation from rectangular to equatorial coordinates was derived using 818 transformation stars with from the DIRECT catalog of stellar objects in M33 (Macri et al. 2001b). The average difference between the catalog and the computed coordinates for the transformation stars was in right ascension and in declination. As a check we have also obtained an independent transformation to the USNO-A2 catalog (Monet et al. 1996) using 56 transformation stars (, ). The average differences between the computed coordinates and the M33 catalog for 1334 stars with were and .
4 Catalog of Variables
4.1 Classification
The variables we are most interested in are Cepheids and eclipsing binaries (EBs). We therefore searched our sample of variable stars primarily for these two classes of variables. The variable stars were preliminarily classified as eclipsing, Cepheid or miscellaneous by visual inspection, based on the shape of their light curves. The variables for which neither nor -band magnitude could be determined (with only flux light curves or having a period in excess of 14 days) were not reclassified further.
In order to obtain as clean a sample of Cepheids as possible, we have inspected the location of the Cepheid variable candidates on a CMD. All of the Cepheid candidates having highly discrepant colors were reclassified as other periodic variables. The candidates with light curves in only one of the bands were checked on the period-luminosity relation for that band. Extreme outliers were also moved to the other periodic variable category.
The EBs with light curves expressed in magnitudes for at least one band, were fitted with a model described in Papers I and II. Within our assumption the light curve of an EB is determined by nine parameters: the period, the zero point of the phase, the eccentricity, the longitude of periastron, the radii of the two stars relative to the binary separation, the inclination angle, the fraction of light coming from the bigger star and the uneclipsed magnitude. Eclipsing binary candidates for which a satisfactory fit was not achieved, were reclassified as other periodic variables.
In the following sections 4.2-4.5 we present the parameters and light curves for the 434 identified variable stars.555The photometry and finding charts for all variables are available from the authors via the anonymous ftp from the Harvard-Smithsonian Center for Astrophysics and can be also accessed through the World Wide Web. All tables are sorted by increasing period, unless otherwise noted. We adopt a naming convention after Macri et al. (2001a) based on the J2000.0 equatorial coordinates, in the format: D33J+. The first three fields () correspond to right ascension expressed in hours, the last three () to declination, expressed in degrees, separated by the declination sign. As none of the newly discovered variables are present in previous variable star catalogs, we refer the reader to Tables 5 and 6 in Paper VI for cross-identifications.
4.2 Eclipsing Binaries
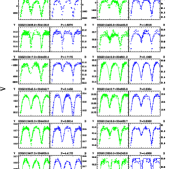
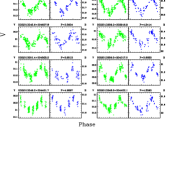
We have found a total of 63 eclipsing binaries in field M33A. In Table 2 we present the parameters for the 53 EBs with a magnitude light curve in at least one band. For each variable we list its name, period P, magnitudes and of the system outside of the eclipse, and the radii of the binary components in the units of the orbital separation. We also give the inclination angle of the binary orbit to the line of sight and the eccentricity of the orbit . The reader should bear in mind that the values of and are derived with a straightforward model of the eclipsing system, so they should be treated only as reasonable estimates of the “true” value. Table 3 lists 10 EBs with flux light curves only. For each variable we give its name and period P. Figure 5 presents the phased light curves of 12 sample EBs (see also Table 8).
4.3 Cepheids
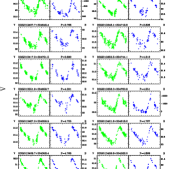
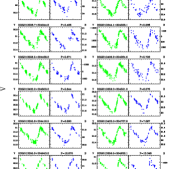
A total of 305 Cepheid variables were found in field M33A. In Table 4 we present 242 Cepheids with a magnitude light curve in at least one band. For each variable, we list its name, period P, flux-weighted average magnitudes and and the and -band amplitudes and . Due to the short time base of our observations, reliable flux-weighted magnitudes could only be determined for variables with periods shorter than 14 days. We have extracted light curves for 36 Cepheids with longer periods, all of them identified previously in Paper VI and made them available via anonymous ftp. In Table 5 we list 27 Cepheids with flux light curves only. For each variable we list its name and period P. Figure 6 presents the phased light curves of 24 sample Cepheids (see also Table 9).
4.4 Other Periodic Variables
In Table 6 we present the parameters of 13 periodic variables. For each variable we list its name, period P, the magnitudes and and the and -band amplitudes and . The and columns list the magnitudes outside of the eclipses and for the eclipsing variables and flux-weighted average magnitudes and for the other variables. We have also found three other variables with periods of the order of 50 days (identified previously in Paper VI), which we do not list in the table. Their light curves are available via anonymous ftp. In Table 10 we list the light curves of all periodic variables.
4.5 Miscellaneous Variables
In Table 7 we present the parameters of 50 miscellaneous variables. For each variable we list its name, the average magnitudes and and the and -band amplitudes and . Variable D33J013342.3+304024.7 is probably an EB, with incomplete phase coverage. Several of those variables are most likely periodic, with periods in excess of 14 days. In Table 11 we list the light curves of all miscellaneous variables.

4.6 Comparison with the catalog in Paper VI
In Figure 7 we compare our and/or photometry for 81 Cepheids (circles) and 18 EBs (squares) with the values listed in the DIRECT catalog of variables in M33 (Paper VI). As reference we plot in the background similar comparisons for all the stars in the field (dots). The variables, with some exceptions, have and distributions roughly similar to the rest of the stars, although they do show a marked tendency to be fainter in our catalog. This trend is especially prominent in the -band for the EBs, but is absent in their -band comparison. We have examined the images of three of the more discrepant EBs and found that in our data we have resolved more nearby companions to these variables. These companions are brighter in than in , relative to the EBs. This is not surprising, as the EBs are among of the bluest stars in the field. There are also a few faint Cepheids, which show unusually large differences in photometry, of the order of 0.6-0.8 mag. We have inspected their light curves in both catalogs. The -band light curves of one such star, type II Cepheid D33J013356.5+304632.1, are shown in Fig. 8. The left panel shows our light curve, extracted with ISIS from 2.1m telescope data. The right panel shows the daophot light curve from data taken with a 1.3m telescope (Paper VI). It seems that these discrepancies are caused in large part by the fact that fixed position photometry is prone to identify and fit a profile at the supplied position even when the star is below the detection threshold, resulting in the false measurement of a fainter magnitude.
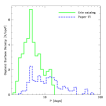
In Figure 9 we plot a histogram of the surface density of Cepheids (N/kpc2) as a function of their period, assuming a distance of 840 kpc to M33 (Freedman, Wilson & Madore 1991). The solid line represents all Cepheids from our catalog with days, the dashed line – the Cepheids from Paper VI. The areas covered in this search and in Paper VI are 108 and 222 arcmin2. As our observations were carried out during two one-week runs spaced one month apart, we lack the baseline to detect long period Cepheids. Since our data were collected with an instrument 2.6 times larger in area and with better seeing, we have a higher detection rate for short period Cepheids. The Paper VI catalog, due to the much longer baseline of observations, contains more long period Cepheids.
5 Discussion
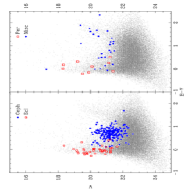
In Fig. 10 we plot the positions of the variable stars on the CMD. The EBs are denoted by open squares and Cepheids by filled circles in the left panel, the periodic variables by filled squares and miscellaneous by open circles in the right panel.
All of the EBs occupy the upper main sequence, with the exception of D33J013359.5+304037.6 (). This variable most likely suffers from larger than average reddening, as it is located at the edge of what appears to be a dust lane.
Most Cepheids occupy the region between , with several outliers stretching from to . The discrepant colors of some of the Cepheid variables most likely originate from the phenomenon of blending with nearby bright stars of very different colors and/or reddening. The phenomenon of blending occurs when the Cepheid possesses one or more close companions which cannot be separated at the resolving power of the instrument used. A further discussion of blending and its properties can be found in Mochejska et al. (2000; 2001) and Stanek & Udalski (1999).
All but one of the periodic variables with photometry are bluer than . The five brightest ones exhibit Cepheid-like light curves of very low amplitude of the order of a few hundredths of a magnitude. The low amplitudes of their variability suggest that these could be Cepheids blended with blue main sequence stars. The remaining four periodic variables are likely EBs. Three of them have blue colors, consistent with this type of variable. The fourth one, D33J013346.1+304658.9, with a period of 6.4640 days seems to be a contact EB, despite its unusual color (). A more complete light curve would be required to resolve the true nature of this object.
The miscellaneous variables are spread throughout the CMD. Some are located on the upper main sequence, and a few seem to fall on the upper red giant branch. Several seem to occupy the same region as Cepheids. It is possible that some of these variables are Cepheids with periods in excess of 14 days.
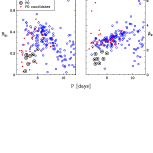
In Figure 11 we present the and -band P-L diagrams for the Cepheid variables, drawn as open circles proportional in size to their amplitudes. As expected, the amplitudes in the -band are on average larger than in . A clear relation between the period and magnitude is discernible. The several Cepheids too faint for their periods are probably suffering from greater than average reddening. Some of the faintest Cepheids exhibit quite large amplitudes. This is not a physical effect and is most likely caused by a similar phenomenon to the one discussed in Subsection 4.6 regarding the comparison with Paper VI photometry. If the magnitude used to convert the light curve from flux to magnitudes is measured too faint, the resulting amplitude will be too large.
For periods shorter than 8 days the relations widen upwards considerably, with the brighter Cepheids for a given period having smaller amplitudes. One possibility is that these Cepheids are pulsating in the first overtone. On the other hand these could be fundamental mode Cepheids which are heavily affected by blending: adding a constant flux would tend to increase the brightness of a Cepheid and diminish its amplitude. We will examine these stars in more depth in Section 6.
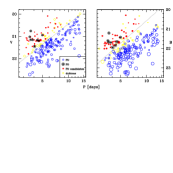
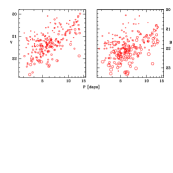
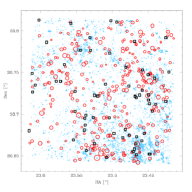
Figure 12 shows the location of the EBs and Cepheids within the field M33A. The Cepheids are plotted as open circles, proportional in size to their period and the EBs as open squares. To trace the spiral pattern of the galaxy we plot in the background all the stars with mag as filled dots of size proportional to their magnitude. These two types of variables appear somewhat more plentiful within the spiral arms.
6 First Overtone Cepheids
As we have noted in the previous Section, on the and -band P-L diagrams in Fig. 11 there are Cepheids which seem too bright for their periods. In addition they possess smaller pulsational amplitudes of variability compared to the normal Cepheids. Their positions on the P-L diagrams would lead us to expect that these should be first overtone (FO) pulsators (as in Fig. 2 of Udalski et al. 1999; hereafter U99). The situation is, however, complicated by the existence of blending. As a result of blending the Cepheid should appear brighter because of the added constant flux and its amplitude, measured in magnitudes, should decrease (Mochejska et al. 2000, 2001; Stanek & Udalski 1999).
In order to try to determine whether these Cepheids are first overtone pulsators, we have checked whether they possess other properties expected of such stars. In addition to being brighter and having a smaller amplitude, Cepheids pulsating in the first overtone should have more symmetric (sinusoidal) light curves and be on average bluer than fundamental mode Cepheids (FU). The most powerful technique for discriminating them from FU Cepheids are the Fourier parameters of their light curves (Antonello & Aikawa 1995; Beaulieu et al. 1995).
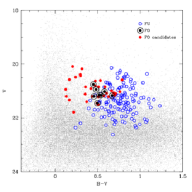
To select a sample of FO Cepheid candidates we have made a division on the P-L diagrams roughly parallel to the P-L relation, between the bright low amplitude and fainter high amplitude Cepheids (dotted lines on Fig. 13). In our final sample we included the Cepheids which were above these lines in both of the P-L diagrams. There are 44 such Cepheids in our catalog (filled circles). FO Cepheids should have periods ranging from 1.7 to 6 days. We decided not to make a cutoff at higher periods, although we did not regard it likely that Cepheids with days would turn out to be FO pulsators.
On the CMD (Fig. 14) we plot the positions of the FU Cepheids (open circles) and FO candidates (filled circles). As expected of FO Cepheids, our candidates are bluer than the FU ones. We note that on the CMD presented by U99 for the Large Magellanic Cloud (LMC) Cepheids (Fig. 4 therein) there is also some overlap between the loci of those two types of Cepheids.
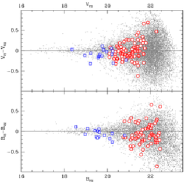
The relations between the light curve Fourier parameters , and the period for the FO Cepheid candidates (filled circles) and FU mode pulsators (open circles) are shown in Fig. 15. We have compared them with Fig. 3 in U99 for LMC Cepheids. We notice on the diagram for LMC that within our range of periods the FO Cepheids progress upwards in with increasing period, forming the second branch of the V-shaped pattern and then merge with the FU Cepheid sequence at higher periods. The situation is very similar on the diagram in U99, where on the one hand the FU Cepheids are confined to a narrower sequence, but on the other there is more overlap between them and the FO pulsators.
Indeed we do observe in Fig. 15 the FO Cepheid candidates to occupy roughly the predicted positions despite our larger scatter in the Fourier parameters than in U99. From the diagram in the right panel we have selected eight FO Cepheids which are most separated from the FU Cepheid sequence. We examined their positions on the diagram to find that they are also rather well separated from the FU mode Cepheids, especially the seven with shorter periods. These eight bona fide FO Cepheid candidates are denoted by encircled dots on Figs 13-15.
We have checked the brightest of these Cepheids, D33J013359.5+304017.0, which is unusually bright even for an overtone Cepheid, in archival HST data. It has two nearby companions, one of which appears bright enough to affect its photometry. To try to estimate the influence of blending on the Fourier parameters and we have generated two new light curves for each of the eight best FO Cepheid candidates, one with an blend added and one with the same blend subtracted. The average differences between the original and recomputed parameters were 9% for and 6% for . These differences are too small to change the positions of the Cepheids considerably on the and diagrams. This very weak dependence of the Fourier parameters on blending strengthens our conclusion that these Cepheids are indeed first overtone pulsators.
As for the rest of the candidates, we believe many of them may also be FO Cepheids. More accurate photometry obtained with a larger instrument would be necessary to obtain better Fourier parameters of their light curves and resolve this issue.
7 Conclusions
Our search for variable stars in the data from the followup observations of the detached eclipsing binary D33J013346.2+304439.9 in field M33A collected at the 2.1m KPNO telescope resulted in the discovery of 63 eclipsing binaries, 305 Cepheids, and 66 other periodic, possible long period or non-periodic variables. Out of the total 434 variables 280 are not listed in our first M33 catalog (Paper VI). Due to the short time base of our observations, we were limited to variables with periods not exceeding 14 days. Thanks to the use of a larger aperture instrument and a novel method of image reduction – the ISIS image subtraction package, we were more efficient at finding the fainter and lower amplitude variables than in our previous study of this field, especially for short period Cepheids (). We have also found a population of Cepheids which are most likely pulsating in the first overtone and for eight of them we present strong arguments in favor of this interpretation.
The method of image subtraction has two main advantages over the classical profile fitting method. It is more efficient in discovering variables: we have discovered 355 periodic variables using ISIS and only 212 with Dophot. Additionally in crowded fields image subtraction can lead to large improvements in the photometric accuracy (Alard 2000b).
During our first observing run we have found that the T2KA CCD camera produced a non-linear response to signal. We have obtained a set of calibration frames to determine a correction for the non-linearity to be applied to the science data. Although the comparison between images of differing exposure times (Fig. 3) and with the Macri et al. (2001b) stellar object catalog (Fig. 7) do not show marked non-linearity, some traces of it still remain. The presence of a residual non-linearity prevented us from obtaining an independent calibration. During the analysis of the data collected at KPNO in October 1998 with the T1KA camera we have found it to be also non-linear. We would like to caution the astronomical community of the problems we have encountered with the T1KA and T2KA cameras.
References
- (1)
- (2) Alard, C., Lupton, R. 1998 ApJ, 503, 325
- (3) Alard, C. 2000a A&AS, 144, 363
- (4) Alard, C. 2000b ASP Conf. Ser. 203, The Impact of Large-Scale Surveys on Pulsating Star Research, ed. L. Szabados & D. Kurtz (San Francisco: ASP), 50
- (5) Andersen, J. 1991, A&AR, 3, 91
- (6) Antonello, E. & Aikawa, T. 1995, A&A, 302, 105
- (7) Beaulieu, J. P. et al. 1995, A&A, 303, 137
- (8) Freedman, W. L., Wilson, C. D., & Madore, B. F. 1991, ApJ, 372, 455
- (9) Guinan, E. F., et al. 1998, ApJ, 509, L21
- (10) Hilditch, R. W. 1996, in: ASP Conf. Ser. 90, The Origins, Evolution and Destinies of Binary Stars in Clusters, ed. E. F. Milone & J.-C. Mermilliod (San Francisco: ASP), 207
- (11) Holland, S. 1998, AJ, 115, 1916
- (12) Hubble, E. 1926, ApJ, 63, 236
- (13) Huterer, D., Sasselov, D. D., Schechter, P. L. 1995, AJ, 110, 2705
- (14) Kaluzny, J. & Udalski, A. 1992, Acta Astronomica, 42, 29
- (15) Kaluzny, J., Stanek, K. Z., Krockenberger, M., Sasselov, D. D., Tonry, J. L., & Mateo, M. 1998, AJ, 115, 1016 (Paper I)
- (16) Kaluzny, J., Mochejska, B. J., Stanek, K. Z., Krockenberger, M., Sasselov, D. D., Tonry, J. L., & Mateo, M. 1999, AJ, 118,346 (Paper IV)
- (17) Kinman, T. D., Mould, J. R. & Wood, P. R. 1987, AJ, 93, 833
- (18) Krockenberger, M., Sasselov, D. D., & Noyes, R. 1997, ApJ, 479, 875
- (19) Landolt, A. 1992, AJ, 104, 340
- (20) Macri, L. M., Stanek, K. Z., Sasselov, D. D., Krockenberger, M., Kaluzny, J. 2001a, AJ, in press (Paper VI)
- (21) Macri, L. M., Stanek, K. Z., Sasselov, D. D., Krockenberger, M., Kaluzny, J. 2001b, AJ, in press
- (22) Mochejska, B. J., Kaluzny, J., Stanek, K. Z., Krockenberger, M. & Sasselov, D. D. 1999, AJ, 118, 2211 (Paper V)
- (23) Mochejska, B. J., Macri, L. M., Sasselov, D. D., & Stanek, K. Z. AJ, 2000, 120, 810
- (24) Mochejska, B. J., Macri, L. M., Sasselov, D. D., & Stanek, K. Z. 2001, in preparation
- (25) Monet, D., et al. 1996, USNO-SA2.0, (U.S. Naval Observatory, Washington DC).
- (26) Paczyński, B. 1997, in The Extragalactic Distance Scale, ed. M. Livio, M. Donahue & N. Panagia (Cambridge: Cambridge Univ. Press), 273
- (27) Schwarzenberg-Czerny, A. 1989, MNRAS, 253, 198
- (28) Stanek, K. Z., Kaluzny, J., Krockenberger, M., Sasselov, D. D., Tonry, J. L., & Mateo, M. 1998, AJ, 115, 1894 (Paper II)
- (29) Stanek, K. Z., Kaluzny, J., Krockenberger, M., Sasselov, D. D., Tonry, J. L., & Mateo, M. 1999, AJ, 117, 2810 (Paper III)
- (30) Stanek, K. Z., & Garnavich, P. M. 1998, ApJ, 503, L131
- (31) Stanek, K. Z. & Udalski, A. 1999, preprint (astro-ph/9909346)
- (32) Stetson, P. B. 1987, PASP, 99, 191
- (33) Udalski, A., Pietrzyński, G., Woźniak, P. R., Szymański, M., Kubiak, M., & Żebruń, K., 1998, ApJ, 509, L25
- (34) Udalski, A., Soszyński, I., Szymański, M., Kubiak, M., Pietrzyński, G., Woźniak, P. & Żebruń, K. 1999, Acta Astronomica, 49, 223 (U99)
| Name | ||||||||
|---|---|---|---|---|---|---|---|---|
| (deg) | Comments | |||||||
| D33J013413.0+304008.8 | 0.9574 | 20.90 | 20.98 | 0.58 | 0.37 | 51.94 | 0.03 | |
| D33J013422.1+304710.4 | 1.0530 | 19.86 | 19.96 | 0.66 | 0.34 | 61.62 | 0.00 | (1) |
| D33J013424.5+304845.8 | 1.0699 | 21.03 | 0.62 | 0.35 | 58.18 | 0.00 | ||
| D33J013400.4+304842.7 | 1.2517 | 21.24 | 21.26 | 0.39 | 0.26 | 71.20 | 0.01 | |
| D33J013352.1+303951.4 | 1.2529 | 21.18 | 0.42 | 0.26 | 73.13 | 0.01 | ||
| D33J013347.6+303908.3 | 1.3211 | 20.23 | 0.39 | 0.29 | 59.22 | 0.00 | ||
| D33J013427.9+304048.3 | 1.3919 | 20.70 | 0.52 | 0.47 | 57.87 | 0.03 | ||
| D33J013426.9+304455.5 | 1.4173 | 20.87 | 20.90 | 0.48 | 0.28 | 62.79 | 0.01 | |
| D33J013352.4+304317.2 | 1.4869 | 20.45 | 0.63 | 0.36 | 58.91 | 0.00 | ||
| D33J013352.5+304317.0 | 1.5229 | 20.45 | 0.56 | 0.38 | 58.74 | 0.00 | ||
| D33J013350.9+304322.6 | 1.5906 | 20.14 | 20.19 | 0.51 | 0.36 | 58.19 | 0.00 | |
| D33J013409.4+304051.0 | 1.6053 | 20.93 | 0.46 | 0.33 | 65.80 | 0.01 | ||
| D33J013408.9+304156.6 | 1.6270 | 21.33 | 21.25 | 0.31 | 0.21 | 75.93 | 0.02 | |
| D33J013425.8+304405.8 | 1.6818 | 20.67 | 20.73 | 0.43 | 0.40 | 53.71 | 0.00 | |
| D33J013417.3+304422.4 | 1.7175 | 21.28 | 0.42 | 0.30 | 82.52 | 0.02 | ||
| D33J013407.5+304729.8 | 1.8102 | 19.11 | 19.15 | 0.62 | 0.35 | 34.34 | 0.03 | |
| D33J013354.4+304401.7 | 1.8483 | 20.81 | 20.87 | 0.62 | 0.38 | 57.05 | 0.00 | (1) |
| D33J013347.4+303908.0 | 1.8775 | 20.59 | 20.57 | 0.52 | 0.36 | 68.61 | 0.03 | |
| D33J013413.9+304831.2 | 2.1098 | 20.89 | 20.72 | 0.54 | 0.44 | 84.89 | 0.01 | |
| D33J013345.5+304242.7 | 2.1458 | 19.42 | 19.63 | 0.55 | 0.43 | 82.62 | 0.00 | (1) |
| D33J013359.5+304037.6 | 2.1554 | 21.66 | 21.22 | 0.66 | 0.34 | 80.76 | 0.01 | |
| D33J013347.9+304323.8 | 2.2497 | 21.31 | 0.48 | 0.31 | 54.45 | 0.09 | ||
| D33J013410.7+304635.8 | 2.3354 | 19.43 | 19.57 | 0.48 | 0.32 | 61.28 | 0.00 | |
| D33J013347.6+304245.3 | 2.3616 | 21.40 | 21.33 | 0.25 | 0.15 | 77.85 | 0.08 | |
| D33J013416.1+304534.4 | 2.3873 | 21.78 | 21.65 | 0.33 | 0.31 | 79.90 | 0.00 | |
| D33J013352.6+304713.8 | 2.4157 | 20.69 | 20.73 | 0.57 | 0.38 | 52.68 | 0.00 | |
| D33J013412.4+304211.1 | 2.5433 | 21.50 | 21.11 | 0.36 | 0.26 | 70.85 | 0.02 | |
| D33J013405.9+303952.5 | 2.5678 | 20.55 | 20.60 | 0.56 | 0.37 | 65.58 | 0.00 | |
| D33J013402.3+304409.6 | 2.6614 | 19.49 | 19.66 | 0.47 | 0.36 | 64.42 | 0.00 | (1) |
| D33J013354.3+304029.6 | 2.7104 | 19.12 | 19.21 | 0.62 | 0.38 | 60.52 | 0.01 | (1) |
| D33J013342.1+304255.3 | 2.7169 | 21.08 | 20.96 | 0.31 | 0.31 | 68.40 | 0.04 | |
| D33J013412.4+304337.9 | 2.7724 | 20.25 | 0.68 | 0.32 | 60.43 | 0.02 | (1) | |
| D33J013355.6+304053.6 | 2.9579 | 20.29 | 20.25 | 0.41 | 0.24 | 66.10 | 0.02 | |
| D33J013352.0+303905.0 | 2.9684 | 19.08 | 19.23 | 0.70 | 0.30 | 68.64 | 0.02 | (1) |
| D33J013401.0+304144.9 | 3.3907 | 19.78 | 20.05 | 0.46 | 0.34 | 60.38 | 0.00 | |
| D33J013352.0+304312.4 | 3.4623 | 20.23 | 20.21 | 0.50 | 0.50 | 56.63 | 0.00 | (1) |
| D33J013409.3+304142.1 | 3.5901 | 20.59 | 20.59 | 0.64 | 0.36 | 47.33 | 0.00 | |
| D33J013400.8+304623.5 | 3.7015 | 21.17 | 21.26 | 0.63 | 0.37 | 64.12 | 0.01 | |
| D33J013418.8+304422.7 | 3.8052 | 21.12 | 21.24 | 0.44 | 0.32 | 77.96 | 0.01 | |
| D33J013356.5+304018.4 | 3.8364 | 20.11 | 20.28 | 0.57 | 0.34 | 68.13 | 0.01 | (1) |
| Name | ||||||||
|---|---|---|---|---|---|---|---|---|
| (deg) | Comments | |||||||
| D33J013349.3+304037.1 | 3.8427 | 19.54 | 0.49 | 0.32 | 65.81 | 0.00 | (1) | |
| D33J013405.9+304321.4 | 4.1309 | 19.60 | 19.79 | 0.47 | 0.24 | 57.59 | 0.01 | |
| D33J013407.3+304635.5 | 4.4172 | 19.61 | 19.77 | 0.59 | 0.40 | 61.07 | 0.01 | (1) |
| D33J013347.9+304301.6 | 4.4363 | 19.63 | 19.75 | 0.46 | 0.36 | 71.74 | 0.01 | (1) |
| D33J013350.0+304342.8 | 4.4808 | 20.60 | 20.71 | 0.34 | 0.21 | 89.87 | 0.01 | |
| D33J013409.1+304112.7 | 4.7310 | 20.72 | 20.92 | 0.31 | 0.25 | 74.58 | 0.10 | |
| D33J013353.1+303919.1 | 4.7424 | 19.77 | 19.45 | 0.63 | 0.37 | 69.68 | 0.00 | |
| D33J013426.7+304334.8 | 6.2106 | 19.81 | 0.59 | 0.41 | 53.11 | 0.03 | (1) | |
| D33J013341.1+304501.7 | 6.8336 | 19.60 | 19.57 | 0.57 | 0.43 | 70.95 | 0.03 | (1) |
| D33J013346.7+304212.3 | 6.9221 | 19.55 | 19.58 | 0.48 | 0.41 | 65.75 | 0.06 | (1) |
| D33J013348.0+304449.6 | 7.2528 | 18.97 | 18.95 | 0.61 | 0.38 | 42.51 | 0.00 | (1) |
| D33J013404.9+304318.4 | 7.2917 | 20.22 | 20.18 | 0.69 | 0.30 | 89.87 | 0.00 | (1) |
| D33J013342.1+304729.7 | 22.9536 | 18.53 | 18.36 | 0.53 | 0.46 | 57.77 | 0.13 | (1) |
Note. — (1) Variables identified by Macri et al. (2001a)
| Name | |
|---|---|
| D33J013358.6+304837.0 | 1.1098 |
| D33J013351.9+304022.7 | 1.3107 |
| D33J013349.9+304510.7 | 2.1464 |
| D33J013345.9+304434.7 | 2.3016 |
| D33J013352.7+303929.4 | 2.4432 |
| D33J013401.9+303852.9 | 2.6338 |
| D33J013406.3+304145.9 | 3.0542 |
| D33J013355.4+304522.5 | 3.3443 |
| D33J013350.1+304004.6 | 3.3573 |
| D33J013408.7+303923.6 | 4.3455 |
| Name | ||||||
|---|---|---|---|---|---|---|
| Comments | ||||||
| D33J013402.1+304534.0 | 2.823 | 22.02 | 0.22 | |||
| D33J013342.5+304335.4 | 3.077 | 20.85 | 21.36 | 0.07 | 0.19 | |
| D33J013416.8+304500.5 | 3.097 | 21.89 | 22.69 | 0.33 | 0.63 | |
| D33J013407.3+303909.7 | 3.234 | 21.07 | 21.76 | 0.06 | 0.09 | |
| D33J013420.6+304231.3 | 3.241 | 21.51 | 22.01 | 0.12 | 0.19 | |
| D33J013358.0+304146.4 | 3.292 | 21.16 | 21.86 | 0.07 | 0.22 | |
| D33J013350.6+304712.9 | 3.293 | 22.36 | 22.60 | 0.25 | 0.15 | |
| D33J013405.8+304040.2 | 3.304 | 21.08 | 21.69 | 0.13 | 0.20 | |
| D33J013427.1+304425.0 | 3.364 | 22.20 | 22.50 | 0.21 | 0.17 | |
| D33J013409.9+304810.6 | 3.371 | 22.26 | 0.23 | |||
| D33J013406.5+304420.5 | 3.381 | 21.18 | 21.75 | 0.11 | 0.19 | |
| D33J013354.2+304624.3 | 3.421 | 21.34 | 0.17 | |||
| D33J013420.4+304719.9 | 3.443 | 21.79 | 22.00 | 0.20 | 0.22 | |
| D33J013412.0+304020.2 | 3.478 | 21.22 | 21.72 | 0.10 | 0.14 | |
| D33J013345.6+304637.9 | 3.563 | 21.02 | 21.60 | 0.07 | 0.11 | |
| D33J013409.1+304719.0 | 3.569 | 22.72 | 0.57 | |||
| D33J013356.7+304110.5 | 3.641 | 21.03 | 21.79 | 0.11 | 0.21 | |
| D33J013427.4+304116.6 | 3.645 | 22.50 | 0.32 | |||
| D33J013422.9+304220.6 | 3.646 | 21.15 | 21.68 | 0.09 | 0.13 | |
| D33J013417.3+304505.3 | 3.654 | 22.27 | 22.86 | 0.55 | 0.72 | (1) |
| D33J013343.8+304711.2 | 3.659 | 21.98 | 22.52 | 0.09 | 0.14 | |
| D33J013359.5+304017.0 | 3.662 | 20.76 | 21.21 | 0.10 | 0.14 | |
| D33J013347.0+304217.9 | 3.680 | 22.11 | 22.80 | 0.16 | 0.26 | |
| D33J013420.9+304319.4 | 3.719 | 22.05 | 22.72 | 0.27 | 0.40 | |
| D33J013354.5+304454.9 | 3.735 | 21.89 | 22.34 | 0.16 | 0.17 | |
| D33J013339.5+304726.4 | 3.775 | 22.13 | 22.93 | 0.30 | 0.15 | |
| D33J013407.7+304648.4 | 3.788 | 21.73 | 22.49 | 0.26 | 0.42 | |
| D33J013410.5+304741.2 | 3.818 | 21.10 | 21.81 | 0.08 | 0.16 | |
| D33J013348.1+304712.8 | 3.826 | 21.45 | 21.95 | 0.14 | 0.19 | |
| D33J013351.4+304505.2 | 3.851 | 21.16 | 21.70 | 0.08 | 0.06 | |
| D33J013414.1+304559.1 | 3.852 | 22.62 | 23.30 | 0.32 | 0.62 | |
| D33J013353.9+304507.5 | 3.888 | 22.04 | 23.09 | 0.24 | 0.72 | |
| D33J013417.3+304751.5 | 3.890 | 21.60 | 22.22 | 0.29 | 0.34 | |
| D33J013405.3+304725.8 | 3.892 | 21.98 | 0.20 | |||
| D33J013404.4+304319.4 | 4.006 | 21.16 | 21.68 | 0.13 | 0.16 | |
| D33J013410.3+304103.3 | 4.045 | 22.24 | 22.94 | 0.34 | 0.44 | |
| D33J013406.0+303945.0 | 4.048 | 20.81 | 21.28 | 0.06 | 0.10 | |
| D33J013355.9+304507.5 | 4.053 | 21.45 | 21.95 | 0.14 | 0.19 | |
| D33J013407.6+304626.5 | 4.057 | 21.33 | 21.50 | 0.12 | 0.10 | |
| D33J013411.4+304655.3 | 4.058 | 21.40 | 21.77 | 0.13 | 0.17 |
| Name | ||||||
|---|---|---|---|---|---|---|
| Comments | ||||||
| D33J013351.8+304421.3 | 4.093 | 20.99 | 21.65 | 0.18 | 0.18 | |
| D33J013413.1+304210.5 | 4.110 | 21.69 | 22.16 | 0.25 | 0.49 | (1) |
| D33J013350.7+304512.1 | 4.158 | 21.46 | 22.09 | 0.07 | 0.15 | |
| D33J013402.3+303855.0 | 4.193 | 21.21 | 21.84 | 0.11 | 0.23 | |
| D33J013415.6+304004.4 | 4.197 | 21.73 | 22.52 | 0.16 | 0.30 | |
| D33J013345.1+304229.4 | 4.219 | 22.25 | 0.22 | |||
| D33J013353.7+304713.5 | 4.240 | 21.94 | 22.72 | 0.28 | 0.44 | |
| D33J013412.5+304720.7 | 4.261 | 21.59 | 22.24 | 0.20 | 0.42 | |
| D33J013411.4+303916.2 | 4.301 | 22.06 | 23.75 | 0.17 | 0.68 | |
| D33J013353.5+304744.1 | 4.312 | 21.20 | 21.64 | 0.19 | 0.22 | |
| D33J013343.2+304224.9 | 4.337 | 20.91 | 21.33 | 0.12 | 0.24 | |
| D33J013346.0+304637.0 | 4.346 | 21.96 | 22.54 | 0.25 | 0.23 | |
| D33J013348.8+304422.1 | 4.359 | 21.17 | 21.84 | 0.09 | 0.15 | |
| D33J013351.9+304658.7 | 4.391 | 21.41 | 22.12 | 0.35 | 0.54 | (1) |
| D33J013427.7+303954.9 | 4.434 | 22.11 | 22.81 | 0.24 | 0.17 | |
| D33J013349.0+304040.4 | 4.441 | 21.09 | 21.80 | 0.08 | 0.12 | |
| D33J013402.6+303944.5 | 4.459 | 21.77 | 0.30 | (1) | ||
| D33J013412.2+304353.1 | 4.470 | 21.74 | 22.36 | 0.28 | 0.36 | (1) |
| D33J013356.2+303916.8 | 4.541 | 21.20 | 21.66 | 0.12 | 0.20 | |
| D33J013356.0+304720.8 | 4.551 | 22.08 | 0.39 | |||
| D33J013350.9+303918.3 | 4.568 | 21.20 | 21.33 | 0.35 | 0.18 | |
| D33J013401.2+304813.7 | 4.624 | 22.17 | 22.99 | 0.32 | 0.53 | |
| D33J013415.7+304524.3 | 4.650 | 21.60 | 22.30 | 0.21 | 0.33 | |
| D33J013351.7+304548.1 | 4.661 | 22.33 | 0.23 | |||
| D33J013409.4+304036.8 | 4.694 | 21.41 | 22.03 | 0.15 | 0.23 | |
| D33J013355.0+304201.6 | 4.702 | 21.35 | 21.99 | 0.15 | 0.16 | |
| D33J013341.0+304049.6 | 4.707 | 22.09 | 23.16 | 0.22 | 0.09 | |
| D33J013402.0+304143.5 | 4.713 | 21.80 | 22.48 | 0.32 | 0.56 | |
| D33J013407.0+304258.5 | 4.725 | 21.44 | 22.19 | 0.21 | 0.35 | |
| D33J013421.6+304618.2 | 4.767 | 21.70 | 22.45 | 0.32 | 0.52 | (1) |
| D33J013409.7+304350.4 | 4.768 | 21.16 | 21.68 | 0.30 | 0.45 | (1) |
| D33J013402.2+304620.8 | 4.774 | 21.90 | 22.54 | 0.18 | 0.31 | |
| D33J013351.1+304516.0 | 4.790 | 21.18 | 21.70 | 0.24 | 0.34 | |
| D33J013359.4+304214.2 | 4.790 | 21.55 | 22.36 | 0.28 | 0.40 | (1) |
| D33J013423.2+304459.3 | 4.803 | 21.94 | 22.77 | 0.29 | 0.62 | |
| D33J013347.8+304627.4 | 4.858 | 20.85 | 21.43 | 0.11 | 0.15 | |
| D33J013426.8+304522.0 | 4.869 | 21.44 | 22.29 | 0.35 | 0.68 | (1) |
| D33J013403.0+304428.1 | 4.874 | 22.15 | 22.86 | 0.55 | 0.93 | |
| D33J013412.2+304620.4 | 4.883 | 21.34 | 22.15 | 0.21 | 0.41 | |
| D33J013419.0+304604.6 | 4.916 | 21.62 | 22.17 | 0.23 | 0.27 |
| Name | ||||||
|---|---|---|---|---|---|---|
| Comments | ||||||
| D33J013359.9+304359.3 | 4.969 | 21.42 | 22.02 | 0.21 | 0.29 | |
| D33J013400.9+304637.9 | 4.987 | 21.68 | 22.57 | 0.14 | 0.24 | |
| D33J013349.2+304421.7 | 4.990 | 20.95 | 21.43 | 0.07 | 0.14 | |
| D33J013357.0+304826.4 | 5.008 | 21.69 | 22.28 | 0.23 | 0.38 | (1) |
| D33J013359.4+304338.4 | 5.008 | 21.56 | 22.42 | 0.30 | 0.56 | |
| D33J013421.5+304000.2 | 5.033 | 21.41 | 22.25 | 0.15 | 0.34 | (1) |
| D33J013352.4+304603.3 | 5.065 | 21.87 | 22.79 | 0.24 | 0.32 | |
| D33J013405.9+304124.9 | 5.081 | 21.20 | 22.03 | 0.05 | 0.20 | |
| D33J013351.7+304843.1 | 5.087 | 20.89 | 0.12 | |||
| D33J013418.3+304602.4 | 5.097 | 21.77 | 22.40 | 0.24 | 0.37 | |
| D33J013400.4+304808.8 | 5.099 | 21.47 | 22.24 | 0.18 | 0.22 | (1) |
| D33J013410.1+304146.0 | 5.123 | 21.79 | 22.48 | 0.10 | 0.21 | |
| D33J013341.5+304737.7 | 5.164 | 21.78 | 22.63 | 0.28 | 0.33 | (1) |
| D33J013348.6+304340.0 | 5.164 | 20.94 | 21.07 | 0.14 | 0.19 | |
| D33J013359.2+304149.4 | 5.228 | 21.52 | 0.22 | |||
| D33J013350.2+304451.1 | 5.271 | 21.21 | 21.83 | 0.16 | 0.25 | |
| D33J013359.0+304233.8 | 5.291 | 21.98 | 0.39 | |||
| D33J013421.6+304415.9 | 5.344 | 21.01 | 21.98 | 0.15 | 0.37 | (1) |
| D33J013347.5+304456.2 | 5.348 | 20.73 | 0.15 | |||
| D33J013347.2+304452.5 | 5.355 | 20.99 | 21.81 | 0.14 | 0.16 | |
| D33J013405.5+304133.3 | 5.380 | 21.63 | 22.45 | 0.25 | 0.48 | (1) |
| D33J013358.7+304344.8 | 5.428 | 21.12 | 21.47 | 0.22 | 0.25 | |
| D33J013359.5+303846.8 | 5.450 | 20.98 | 21.66 | 0.10 | 0.24 | (1) |
| D33J013415.4+304452.8 | 5.479 | 20.61 | 21.14 | 0.13 | 0.19 | (1) |
| D33J013355.3+304638.6 | 5.482 | 21.25 | 21.95 | 0.30 | 0.39 | (1) |
| D33J013356.5+304442.4 | 5.484 | 21.49 | 22.24 | 0.35 | 0.55 | |
| D33J013411.8+304033.0 | 5.494 | 21.46 | 22.57 | 0.20 | 0.45 | |
| D33J013404.4+303931.3 | 5.524 | 21.83 | 0.17 | |||
| D33J013356.0+304007.5 | 5.540 | 21.30 | 0.28 | |||
| D33J013350.0+304346.7 | 5.572 | 22.29 | 0.35 | (1) | ||
| D33J013347.0+304412.3 | 5.597 | 21.28 | 0.14 | |||
| D33J013346.2+304221.2 | 5.617 | 21.55 | 22.20 | 0.17 | 0.32 | |
| D33J013402.5+304643.6 | 5.623 | 22.24 | 23.23 | 0.33 | 0.62 | |
| D33J013356.5+304714.7 | 5.626 | 21.40 | 22.02 | 0.16 | 0.36 | |
| D33J013413.7+304555.0 | 5.641 | 21.33 | 22.02 | 0.07 | 0.17 | |
| D33J013414.8+304748.4 | 5.644 | 21.35 | 21.76 | 0.19 | 0.23 | |
| D33J013414.0+304837.7 | 5.669 | 21.43 | 22.03 | 0.38 | 0.52 | (1) |
| D33J013401.3+304325.6 | 5.670 | 21.14 | 21.77 | 0.40 | 0.58 | (1) |
| D33J013356.5+304428.2 | 5.671 | 21.36 | 0.34 | |||
| D33J013354.8+304447.0 | 5.700 | 21.07 | 21.88 | 0.12 | 0.21 |
| Name | ||||||
|---|---|---|---|---|---|---|
| Comments | ||||||
| D33J013420.6+304244.2 | 5.700 | 21.38 | 22.15 | 0.25 | 0.56 | (1) |
| D33J013342.8+304403.1 | 5.721 | 20.93 | 0.07 | |||
| D33J013403.4+304047.9 | 5.722 | 21.70 | 22.20 | 0.08 | 0.38 | |
| D33J013406.2+304224.6 | 5.722 | 21.38 | 22.11 | 0.21 | 0.31 | |
| D33J013350.6+304734.9 | 5.745 | 21.67 | 22.41 | 0.23 | 0.42 | (1) |
| D33J013426.8+304357.7 | 5.752 | 20.09 | 20.29 | 0.13 | 0.18 | (1) |
| D33J013353.1+304542.3 | 5.779 | 22.15 | 23.22 | 0.24 | 0.60 | |
| D33J013354.8+304518.8 | 5.782 | 20.85 | 21.21 | 0.12 | 0.14 | |
| D33J013355.7+303903.6 | 5.803 | 21.17 | 0.10 | |||
| D33J013408.3+304748.0 | 5.811 | 21.70 | 22.59 | 0.33 | 0.54 | |
| D33J013357.4+304556.6 | 5.817 | 22.05 | 0.22 | |||
| D33J013420.2+304503.2 | 5.844 | 20.59 | 21.38 | 0.16 | 0.28 | |
| D33J013349.8+304427.9 | 5.875 | 21.65 | 22.04 | 0.25 | 0.45 | (1) |
| D33J013424.9+304431.2 | 5.921 | 21.30 | 22.21 | 0.21 | 0.44 | (1) |
| D33J013411.9+304704.6 | 5.930 | 22.36 | 23.31 | 0.45 | 0.91 | |
| D33J013355.6+304449.1 | 5.993 | 22.30 | 23.24 | 0.51 | 0.90 | |
| D33J013346.9+304334.2 | 5.997 | 21.01 | 21.52 | 0.21 | 0.17 | (1) |
| D33J013349.6+304744.7 | 6.000 | 21.67 | 22.51 | 0.26 | 0.39 | (1) |
| D33J013408.5+304430.6 | 6.000 | 21.50 | 22.10 | 0.23 | 0.28 | (1) |
| D33J013403.2+304332.0 | 6.027 | 21.26 | 0.25 | (1) | ||
| D33J013359.0+304531.0 | 6.070 | 21.37 | 22.08 | 0.42 | 0.78 | (1) |
| D33J013356.7+304838.6 | 6.116 | 21.14 | 21.62 | 0.37 | 0.47 | (1) |
| D33J013356.7+304409.5 | 6.140 | 21.44 | 22.30 | 0.31 | 0.58 | |
| D33J013342.1+304047.3 | 6.178 | 22.46 | 0.48 | |||
| D33J013406.3+303932.6 | 6.178 | 20.39 | 20.68 | 0.08 | 0.06 | |
| D33J013403.7+304528.6 | 6.190 | 21.25 | 21.88 | 0.35 | 0.61 | (1) |
| D33J013349.7+304401.6 | 6.280 | 21.47 | 22.22 | 0.29 | 0.40 | |
| D33J013400.1+303904.2 | 6.292 | 21.16 | 21.90 | 0.24 | 0.35 | |
| D33J013348.0+304116.8 | 6.298 | 21.09 | 21.64 | 0.17 | 0.09 | |
| D33J013346.6+304741.7 | 6.319 | 21.19 | 21.88 | 0.15 | 0.14 | |
| D33J013356.8+304212.2 | 6.329 | 21.17 | 22.11 | 0.23 | 0.39 | |
| D33J013349.4+304701.9 | 6.335 | 21.16 | 22.05 | 0.35 | 0.47 | (1) |
| D33J013401.9+304148.9 | 6.361 | 21.47 | 0.26 | |||
| D33J013403.1+303925.9 | 6.376 | 21.82 | 22.78 | 0.35 | 0.74 | |
| D33J013424.2+304527.5 | 6.432 | 21.44 | 21.97 | 0.21 | 0.27 | |
| D33J013410.9+303845.1 | 6.478 | 21.32 | 22.48 | 0.32 | 0.49 | |
| D33J013349.8+304444.7 | 6.519 | 22.03 | 22.93 | 0.32 | 0.47 | |
| D33J013415.6+304411.9 | 6.529 | 21.50 | 22.32 | 0.34 | 0.61 | |
| D33J013425.0+304129.7 | 6.550 | 21.29 | 22.06 | 0.41 | 0.76 | (1) |
| D33J013418.5+304118.1 | 6.553 | 20.75 | 21.46 | 0.10 | 0.12 |
| Name | ||||||
|---|---|---|---|---|---|---|
| Comments | ||||||
| D33J013349.4+304435.5 | 6.842 | 20.82 | 21.57 | 0.04 | 0.14 | |
| D33J013354.1+304028.1 | 6.862 | 21.61 | 22.73 | 0.21 | 0.29 | |
| D33J013352.1+304702.9 | 6.870 | 20.63 | 21.10 | 0.14 | 0.26 | (1) |
| D33J013355.8+304416.5 | 6.890 | 21.38 | 21.90 | 0.33 | 0.51 | (1) |
| D33J013353.5+303915.3 | 6.926 | 20.24 | 0.29 | |||
| D33J013406.4+304003.7 | 6.937 | 20.62 | 0.20 | (1) | ||
| D33J013413.5+304704.1 | 6.970 | 21.61 | 22.53 | 0.27 | 0.43 | |
| D33J013411.6+304742.5 | 6.992 | 20.41 | 21.59 | 0.10 | 0.26 | |
| D33J013403.0+304727.9 | 7.087 | 21.19 | 21.78 | 0.26 | 0.36 | (1) |
| D33J013404.1+304329.3 | 7.095 | 20.44 | 20.73 | 0.20 | 0.20 | (1) |
| D33J013410.3+303934.8 | 7.121 | 21.39 | 22.30 | 0.20 | 0.28 | (1) |
| D33J013354.1+304504.0 | 7.177 | 21.12 | 21.84 | 0.17 | 0.28 | |
| D33J013356.5+304644.6 | 7.260 | 21.11 | 21.94 | 0.19 | 0.38 | |
| D33J013340.7+304543.1 | 7.355 | 21.44 | 22.18 | 0.25 | 0.43 | |
| D33J013343.2+304502.1 | 7.356 | 20.17 | 20.49 | 0.10 | 0.10 | |
| D33J013348.6+304416.8 | 7.397 | 22.09 | 0.51 | |||
| D33J013404.3+304115.4 | 7.455 | 21.42 | 21.94 | 0.20 | 0.45 | |
| D33J013406.4+303925.6 | 7.510 | 21.21 | 0.13 | |||
| D33J013347.3+304456.5 | 7.540 | 20.58 | 20.75 | 0.13 | 0.09 | |
| D33J013405.3+303943.8 | 7.565 | 22.10 | 23.03 | 0.17 | 0.64 | |
| D33J013402.9+303907.6 | 7.646 | 21.24 | 22.28 | 0.14 | 0.28 | |
| D33J013349.1+304629.4 | 7.647 | 21.25 | 22.02 | 0.12 | 0.32 | |
| D33J013350.8+304108.6 | 7.656 | 21.28 | 21.95 | 0.27 | 0.44 | |
| D33J013422.5+304408.4 | 7.660 | 21.23 | 22.02 | 0.25 | 0.35 | (1) |
| D33J013424.4+304739.0 | 7.690 | 20.90 | 21.57 | 0.35 | 0.59 | (1) |
| D33J013402.3+304242.9 | 7.840 | 20.77 | 21.42 | 0.26 | 0.45 | (1) |
| D33J013344.6+304212.9 | 7.880 | 20.39 | 21.10 | 0.12 | 0.19 | (1) |
| D33J013346.0+304214.6 | 7.894 | 21.30 | 22.40 | 0.28 | 0.27 | |
| D33J013413.9+304324.3 | 7.950 | 21.42 | 22.40 | 0.25 | 0.44 | (1) |
| D33J013341.8+304312.2 | 8.060 | 21.26 | 22.27 | 0.14 | 0.49 | (1) |
| D33J013355.3+304130.4 | 8.134 | 20.49 | 20.73 | 0.09 | 0.06 | |
| D33J013417.7+304508.1 | 8.140 | 20.46 | 21.15 | 0.27 | 0.38 | (1) |
| D33J013404.3+304056.0 | 8.220 | 21.57 | 0.19 | |||
| D33J013412.6+304126.7 | 8.233 | 21.15 | 21.97 | 0.15 | 0.25 | (1) |
| D33J013400.6+304027.8 | 8.257 | 20.32 | 0.12 | |||
| D33J013356.3+304008.6 | 8.328 | 20.58 | 21.28 | 0.14 | 0.11 | |
| D33J013342.2+304344.5 | 8.447 | 20.93 | 21.82 | 0.09 | 0.23 | |
| D33J013411.7+304259.5 | 8.523 | 21.22 | 0.14 | |||
| D33J013413.3+304307.3 | 8.539 | 21.43 | 22.23 | 0.34 | 0.40 | (1) |
| D33J013416.0+304644.0 | 8.560 | 21.14 | 21.93 | 0.23 | 0.37 | (1) |
| Name | ||||||
|---|---|---|---|---|---|---|
| Comments | ||||||
| D33J013356.2+303909.1 | 8.640 | 20.68 | 21.27 | 0.15 | 0.21 | (1) |
| D33J013409.3+304238.6 | 8.714 | 21.10 | 22.05 | 0.21 | 0.49 | (1) |
| D33J013413.5+304334.7 | 9.098 | 20.93 | 21.57 | 0.30 | 0.46 | (1) |
| D33J013342.9+304305.5 | 9.251 | 20.85 | 21.43 | 0.17 | 0.07 | |
| D33J013426.9+304003.6 | 9.260 | 20.89 | 21.65 | 0.24 | 0.23 | (1) |
| D33J013341.1+304340.7 | 9.316 | 20.96 | 21.70 | 0.13 | 0.15 | |
| D33J013345.1+304021.8 | 9.388 | 20.80 | 21.70 | 0.17 | 0.22 | |
| D33J013349.6+304501.0 | 9.582 | 21.17 | 21.96 | 0.19 | 0.21 | |
| D33J013353.2+304835.2 | 9.600 | 20.42 | 0.14 | (1) | ||
| D33J013350.8+304715.5 | 9.710 | 20.77 | 21.41 | 0.23 | 0.42 | (1) |
| D33J013421.1+304415.5 | 9.980 | 20.72 | 21.36 | 0.29 | 0.46 | (1) |
| D33J013408.8+303946.5 | 10.110 | 20.45 | 21.30 | 0.11 | 0.28 | (1) |
| D33J013343.2+304002.7 | 10.376 | 20.87 | 21.63 | 0.18 | 0.21 | |
| D33J013346.7+304445.6 | 10.383 | 20.29 | 20.67 | 0.12 | 0.03 | |
| D33J013356.1+303903.0 | 10.430 | 20.71 | 21.64 | 0.17 | 0.17 | (1) |
| D33J013410.2+304450.6 | 10.450 | 20.81 | 21.63 | 0.30 | 0.52 | (1) |
| D33J013417.0+304640.2 | 10.560 | 20.58 | 21.47 | 0.24 | 0.40 | (1) |
| D33J013413.9+304418.7 | 10.610 | 21.36 | 22.29 | 0.44 | 0.70 | (1) |
| D33J013420.0+304302.3 | 10.727 | 21.24 | 22.08 | 0.13 | 0.18 | |
| D33J013349.5+304101.5 | 10.919 | 20.69 | 21.31 | 0.17 | 0.20 | |
| D33J013358.6+304400.1 | 11.150 | 20.52 | 21.34 | 0.14 | 0.29 | (1) |
| D33J013340.3+304741.7 | 11.510 | 21.06 | 21.88 | 0.09 | 0.29 | (1) |
| D33J013346.5+304111.8 | 11.511 | 20.51 | 21.25 | 0.07 | 0.05 | |
| D33J013357.4+304113.9 | 11.620 | 20.37 | 21.20 | 0.22 | 0.41 | (1) |
| D33J013401.6+303858.2 | 11.707 | 20.46 | 21.27 | 0.35 | 0.30 | |
| D33J013414.7+304609.7 | 11.770 | 21.55 | 22.79 | 0.27 | 0.60 | (1) |
| D33J013356.2+304343.0 | 11.970 | 20.84 | 21.68 | 0.28 | 0.56 | (1) |
| D33J013420.3+304351.9 | 11.970 | 20.69 | 21.50 | 0.40 | 0.61 | (1) |
| D33J013341.4+304756.1 | 12.120 | 20.25 | 21.01 | 0.18 | 0.19 | (1) |
| D33J013346.6+304821.8 | 12.360 | 20.36 | 21.44 | 0.18 | 0.31 | (1) |
| D33J013351.1+304400.4 | 12.360 | 20.89 | 21.81 | 0.32 | 0.67 | (1) |
| D33J013411.3+304755.1 | 12.410 | 20.35 | 21.09 | 0.30 | 0.47 | (1) |
| D33J013355.0+304643.2 | 12.870 | 20.31 | 21.07 | 0.15 | 0.24 | (1) |
| D33J013346.0+304231.9 | 12.930 | 20.14 | 20.80 | 0.21 | 0.21 | (1) |
| D33J013402.8+304145.7 | 13.040 | 20.09 | 20.83 | 0.30 | 0.55 | (1) |
| D33J013345.9+304421.4 | 13.120 | 20.49 | 21.30 | 0.31 | 0.51 | (1) |
| D33J013359.9+303910.3 | 13.230 | 20.66 | 21.55 | 0.19 | 0.37 | (1) |
| D33J013357.3+303840.1 | 13.337 | 20.98 | 0.14 | |||
| D33J013415.1+304435.2 | 13.340 | 20.69 | 21.73 | 0.24 | 0.41 | (1) |
| D33J013356.5+304632.1 | 13.348 | 21.88 | 0.54 | (1) Type II |
| Name | ||||||
|---|---|---|---|---|---|---|
| Comments | ||||||
| D33J013408.8+304543.5 | 13.530 | 20.85 | 21.63 | 0.37 | 0.58 | (1) |
| D33J013400.9+304028.5 | 13.672 | 19.98 | 20.91 | 0.28 | 0.20 |
Note. — (1) Variables identified by Macri et al. (2001a)
| Name | ||
|---|---|---|
| Comments | ||
| D33J013341.5+304149.7 | 3.400 | |
| D33J013352.3+303901.0 | 3.663 | |
| D33J013346.0+303908.3 | 4.087 | |
| D33J013353.1+304619.1 | 4.426 | |
| D33J013344.5+304644.8 | 4.536 | |
| D33J013405.6+304143.5 | 4.716 | |
| D33J013357.7+304834.8 | 4.856 | |
| D33J013350.9+303914.6 | 5.362 | |
| D33J013351.1+303931.4 | 5.457 | |
| D33J013344.1+304558.1 | 5.568 | (1) |
| D33J013417.1+303932.9 | 5.650 | (1) |
| D33J013413.6+304210.5 | 5.867 | (1) |
| D33J013343.9+304513.7 | 5.910 | (1) |
| D33J013345.6+303921.5 | 6.008 | |
| D33J013342.2+304128.3 | 6.559 | |
| D33J013350.5+304502.0 | 6.763 | |
| D33J013406.7+304041.2 | 6.766 | |
| D33J013344.6+303919.9 | 7.452 | |
| D33J013345.2+304428.2 | 7.599 | |
| D33J013355.1+304758.5 | 8.242 | |
| D33J013354.4+304527.2 | 8.747 | |
| D33J013347.4+303848.5 | 9.066 | |
| D33J013352.8+303836.6 | 11.168 | |
| D33J013412.5+303839.8 | 11.240 | (1) |
| D33J013356.0+304231.3 | 11.340 | (1) |
| D33J013420.2+304457.9 | 12.934 | |
| D33J013408.1+303931.9 | 13.320 | (1) |
Note. — (1) Variables identified by Macri et al. (2001a)
| Name | ||||||
|---|---|---|---|---|---|---|
| Comments | ||||||
| D33J013407.1+303925.6 | 1.58 | 19.51 | 19.30 | 0.01 | 0.02 | |
| D33J013345.0+304449.3 | 1.65 | 18.76 | 0.03 | EB | ||
| D33J013418.4+304552.2 | 1.97 | 21.55 | 0.68 | EB | ||
| D33J013426.4+304033.3 | 2.24 | 20.70 | 0.05 | EB | ||
| D33J013340.9+303911.0 | 2.45 | 21.13 | 21.38 | 0.28 | 0.32 | EB |
| D33J013345.9+304748.6 | 2.51 | 21.40 | 21.30 | 0.11 | 0.41 | EB |
| D33J013427.3+304311.6 | 3.59 | 21.87 | 0.53 | EB | ||
| D33J013349.3+303835.2 | 4.99 | 19.20 | 19.53 | 0.04 | 0.01 | |
| D33J013344.2+304214.7 | 6.11 | 20.10 | 20.20 | 0.31 | 0.19 | EB |
| D33J013352.4+303840.2 | 6.38 | 19.90 | 19.75 | 0.06 | 0.03 | |
| D33J013346.0+304658.5 | 6.46 | 21.21 | 21.72 | 0.27 | 0.57 | EB |
| D33J013409.2+304641.4 | 11.65 | 18.31 | 18.31 | 0.02 | 0.03 | |
| D33J013405.5+304726.3 | 13.17 | 18.33 | 18.50 | 0.02 | 0.02 |
Note. — a The and columns list the maximum magnitudes and for the eclipsing variables and flux-weighted average magnitudes and for the other variables.
| Name | Comments | ||||
|---|---|---|---|---|---|
| D33J013339.7+304541.6 | 17.27 | 17.25 | 0.46 | 0.20 | |
| D33J013407.5+304721.4 | 19.24 | 0.13 | |||
| D33J013412.7+304728.2 | 19.37 | 0.23 | |||
| D33J013416.8+304518.8 | 19.37 | 21.26 | 0.61 | 0.52 | (1) |
| D33J013344.8+304249.9 | 19.41 | 20.51 | 0.14 | 0.13 | |
| D33J013416.6+304750.9 | 19.55 | 0.22 | (1) | ||
| D33J013348.8+304212.0 | 19.62 | 0.20 | (1) | ||
| D33J013345.8+304438.1 | 19.81 | 0.17 | |||
| D33J013347.5+304630.9 | 19.94 | 21.70 | 0.28 | 0.37 | (1) |
| D33J013350.5+303836.3 | 19.98 | 0.96 | |||
| D33J013409.4+304527.3 | 20.00 | 21.62 | 0.24 | 0.34 | (1) |
| D33J013421.0+304743.0 | 20.18 | 21.67 | 0.30 | 0.53 | |
| D33J013342.3+304024.7 | 20.27 | 20.26 | 0.11 | 0.07 | |
| D33J013420.1+304436.9 | 20.40 | 22.07 | 0.39 | 0.47 | (1) |
| D33J013409.7+304100.2 | 20.49 | 21.91 | 0.52 | 0.64 | |
| D33J013345.9+304312.4 | 20.50 | 20.97 | 0.37 | 0.34 | |
| D33J013414.3+304228.7 | 20.57 | 22.90 | 0.34 | 0.47 | |
| D33J013406.1+304305.4 | 20.60 | 20.61 | 0.29 | 0.22 | |
| D33J013358.8+303928.1 | 20.68 | 21.18 | 0.43 | 0.37 | |
| D33J013347.7+304030.9 | 20.69 | 21.34 | 0.40 | 0.39 | |
| D33J013341.9+304021.1 | 20.89 | 0.33 | |||
| D33J013410.2+304107.1 | 20.90 | 21.04 | 0.32 | 0.38 | |
| D33J013413.6+303939.4 | 20.90 | 21.41 | 0.42 | 0.20 | |
| D33J013400.8+304339.9 | 21.05 | 20.99 | 0.28 | 0.26 | |
| D33J013359.8+304725.3 | 21.06 | 22.70 | 0.40 | 0.85 | |
| D33J013349.0+303906.2 | 21.12 | 0.87 | |||
| D33J013346.7+304210.5 | 21.13 | 0.96 | (1) | ||
| D33J013412.3+304551.0 | 21.16 | 21.96 | 0.41 | 0.38 | |
| D33J013402.1+304038.3 | 21.19 | 0.35 | |||
| D33J013349.2+303909.7 | 21.20 | 22.25 | 0.77 | 0.42 | |
| D33J013419.5+304151.9 | 21.21 | 0.38 | |||
| D33J013357.0+304044.2 | 21.24 | 22.41 | 0.83 | 0.46 | |
| D33J013348.5+304015.0 | 21.25 | 21.98 | 0.85 | 0.31 | |
| D33J013405.3+303954.2 | 21.32 | 22.65 | 0.40 | 0.65 | |
| D33J013345.1+304715.3 | 21.38 | 0.77 | (1) | ||
| D33J013413.3+303848.2 | 21.38 | 21.57 | 0.60 | 0.37 | |
| D33J013416.4+304045.9 | 21.41 | 22.50 | 0.78 | 0.34 | |
| D33J013343.4+304248.4 | 21.43 | 22.61 | 0.66 | 0.43 | |
| D33J013357.2+304523.0 | 21.47 | 22.25 | 0.43 | 0.66 | |
| D33J013412.7+304208.4 | 21.52 | 0.52 | (1) |
| Name | Comments | ||||
|---|---|---|---|---|---|
| D33J013414.5+304040.4 | 21.56 | 0.59 | |||
| D33J013407.7+303845.5 | 21.63 | 0.81 | |||
| D33J013341.7+304145.7 | |||||
| D33J013345.5+303912.2 | |||||
| D33J013346.1+303917.7 | |||||
| D33J013351.5+304050.9 | |||||
| D33J013352.4+304501.7 | |||||
| D33J013357.6+303844.0 | |||||
| D33J013406.0+304006.0 | |||||
| D33J013414.2+304740.3 | 22.19 | 0.52 |
Note. — (1) Variables identified by Macri et al. (2001a)