Analysis of Stars Common to the IRAS and HIPPARCOS Surveys
Abstract
For about 11,000 stars observed in the HIPPARCOS Survey and detected by IRAS we calculate bolometric luminosities by integrating their spectral energy distributions from the B band to far-IR wavelengths. We present an analysis of the dependence of dust emission on spectral type and correlations between the luminosity and dust emission for about 1000 sources with the best data (parallax error less than 30%, error in luminosity of 50% or better). This subsample includes stars of all spectral types and is dominated by K and M giants.
We use the IRAS [25]-[12] color to select stars with emission from circumstellar dust and show that they are found throughout the Hertzsprung-Russell diagram, including on the main sequence. Clear evidence is found that M giants with dust emission have luminosities about 3 times larger (3000 ) than their counterparts without dust, and that mass loss on the asymptotic giant branch for both M and C stars requires a minimum luminosity of order 2000 . Above this threshold the mass-loss rate seems to be independent of, or only weakly dependent on, luminosity. We also show that the mass-loss rate for these stars is larger than the core mass growth rate, indicating that their evolution is dominated by mass loss.
1 Introduction
Dust can be found around pre-main-sequence, main sequence, and post-main-sequence stars (e.g. Zuckerman 1980, Habing 1996, Waters & Waelkens 1998). The relationships between the luminosity of a star, its evolutionary phase, and the properties of its circumstellar dust are not fully understood. The main obstacle is the lack of a large uniform sample which would include both dust emission properties and the stellar luminosity and spectral type. In this paper we present such a sample of stars for which these quantities are obtained by combining the results of the IRAS and HIPPARCOS surveys. While there have been studies correlating IRAS data with data from other catalogs (e.g. with the SAO catalog, Oudmaijer et al. 1992), the determination of luminosity for a large number of stars has become possible only recently due to the release of the HIPPARCOS astrometric data.
The Infrared Astronomical Satellite (IRAS) produced a 96% of the sky survey at 12, 25, 60 and 100 m, with the resulting IRAS point source catalog (IRAS PSC) containing over 250,000 sources. The colors based on IRAS fluxes can efficiently be used to distinguish pre-main sequence from post-main sequence stars, and to study characteristics of the dust emission (e.g. van der Veen & Habing 1987, Ivezić & Elitzur 2000, hereafter IE00). The recently released HIPPARCOS (HIgh Precision PARallax COllecting Satellite) catalog contains parallaxes of unprecedented accuracy for 118,218 sources, and is complete to V7.5 (Perryman et al. 1997). Combining these two data sets can yield bolometric luminosities for a large number of stars, and facilitate studies of the relationship between the characteristics of dust emission and stellar luminosity.
In Section 2 we describe a catalog of stars obtained by positionally matching the IRAS and HIPPARCOS catalogs. For 11,321 matched sources we calculate bolometric fluxes by integrating their spectral energy distributions (SED) from the B band to far-IR wavelengths, and with the aid of HIPPARCOS parallaxes, bolometric luminosities. In Section 3, we present an analysis of the dependence of dust emission on spectral type and correlations between the luminosity and dust emission for 968 sources with the most accurate luminosities (standard deviation of 50% or better), and in Section 4 we discuss the relationship between mass loss and luminosity for asymptotic giant branch (AGB) stars.
2 The Synthesis of the IRAS PSC and HIPPARCOS Catalogs
We consider only sources from the IRAS PSC with quality flags of at least 2 in at least 2 IRAS bands111The reliability of an IRAS flux is described by the quality index: 3 – high, 2 – low, 1 – an upper limit.. This is motivated by the results described in IE00 who showed that dusty stars come in two “flavors”: AGB stars which typically have fluxes in the 12 and 25 m bands larger than the fluxes in the 60 and 100 m bands, and various young stellar objects with fluxes in the 60 and 100 m bands larger than the fluxes in the 12 and 25 m bands. There are 88,619 sources with high-quality fluxes in the 12 and 25 m bands, and 33,435 sources with high quality fluxes in the 60 and 100 m bands. We note that the number of sources with good fluxes at only 25 and 60 m is very small compared to the above (3612, or less than 3%), in agreeement with IE00.
The quoted IRAS positional error ellipse for stars is typically 3″20″, and its position angle varies across the sky (Beichman et al. 1988). However, the typical distance between HIPPARCOS sources (about 30′) is much larger than the IRAS error ellipse, and we simply match the positions of stars within a circle of radius 25″. This matching radius ensures that practically all true matches are included, while keeping the random association rate below . Also, this radius is sufficiently small that the number of Hipparcos sources matched with multiple IRAS sources is negligible (there are only 4 such cases for which we took the closer match). The positional correlation of the subset of 125,666 IRAS sources with the full HIPPARCOS catalog resulted in 11,321 matches. The positional discrepancies are consistent with the mean IRAS error of 10″. From the random association rate we estimate that about 50 matched sources (0.4% of the sample) are random associations222This number could be decreased by about factor 2 by explicitly treating the IRAS error ellipse information, but this doesn’t seem necessary since the contamination is already negligible.. We estimate the completeness of our matched sample by increasing the matching radius to 45″ which produces 11,853 matches. Taking into account the increase in the expected number of random associations, this implies that our adopted sample includes 95% of all true HIPPARCOS–IRAS associations.
As expected, the matched sources are predominantly red HIPPARCOS stars, and the majority satisfy and . When considering the IRAS catalog, 77% of sources matched in the HIPPARCOS catalog are dust-free stars (see Section 3) brighter than 1 Jy at 12 m. The faint limit for the matched dust-free stars with “blue” SEDs is imposed by the IRAS sensitivity. The faint cutoff for matched dusty stars (approximately 2 times brighter than the cutoff for the input IRAS sample) with “red” SEDs is imposed by the HIPPARCOS sensitivity. Because of this cutoff, the matching of the HIPPARCOS catalog to a deeper IR catalog, e.g. IRAS Faint Source Catalog, would not significantly increase the sample of dusty stars with good distance estimate.
For all matched stars we calculate bolometric fluxes by integrating their SEDs from the B band to the IRAS 100 m band. We use photometric measurements provided by the HIPPARCOS main catalog and from the Catalog of Infrared Observations, which consists of inputs from other catalogs and observations culled from the literature, beginning in 1965 (CIO, Gezari et al. 1993). The number of flux measurements per star ranges from 6 to 20 with a median value of 10. We have used 2 integration methods: linear interpolation in log() – log(flux) space and piecewise fitting of the Planck curve. The two methods typically agree within 20 - 30%. From the piecewise fitting of the Planck curve to the end point pairs we estimate the flux outside the observed wavelength range to be typically less than 10%. From the bolometric fluxes and HIPPARCOS parallaxes we calculate bolometric luminosities for all 11,321 stars.333We ignore the correction for interstellar extinction since the sample is dominated by nearby stars ( 300 pc).
Figure 1 displays the luminosity histogram for a subsample of matched stars with maximum fractional error in parallax of 30% and at least 9 fluxes used for the bolometric flux calculation (968 stars). Relaxing the parallax cutoff to 50% roughly doubles the sample size but noticeably increases the number of outliers in various diagrams to be discussed later. The top panel in Figure 1 shows the distribution for all stars, irrespective of spectral type444The histogram counts are expressed as normalized counts per unit log interval (dex-1); that is, the integrals of the plotted curves over d(logLbol) are unity.. The error bars are assigned assuming a Poisson error distribution. There are two obvious peaks at 50 and 1000 . The six panels below detail the same information separated by spectral type; all luminosity classes are included. Since there are so few O and B stars in the sample they are treated together. The numbers of stars in each spectral type subsample, given below the spectral type designation in each panel, show that the sample is dominated by K and M giants. The comparison of the histogram for the full sample, displayed in the top panel, to the various spectral subsamples, shows that the peak at 50 is due to K sub-giants, also known as the red clump stars (for a detailed discussion see Oudmaijer et al. 1992), and that the peak at 1000 is due to M giants (note that the HIPPARCOS magnitude limit detects M dwarfs only out to 5 pc).
From the width of the peak for K stars at 50 we estimate an upper limit on the mean error of 50% (were this error larger, this peak could not be so narrow). Assuming that HIPPARCOS parallaxes and our method for determining bolometric fluxes are not biased with respect to spectral type, we adopt this value as the mean error for the whole sample. However, we note that dusty stars with heavily reddened SEDs may have large errors due to sparse infrared photometry, and the error distribution in such a case would be markedly non-Gaussian.
3 The Relationship between Luminosity and Spectral Properties
Figure 2 shows vs. [25]-[12] color555We define IRAS [25]-[12] color as log(F25/F12), where F12 and F25 are the flux densities taken from the IRAS PSC catalog. for 913 stars from Figure 1 with IRAS flux qualities of at least 2 at 12 and 25 m, and with known spectral types. Color temperature increases from right to left, and [25]-[12] = -0.6 corresponds to the Rayleigh-Jeans tail of the Planck function. Stars with this color have no dust, and the distribution width indicates the errors in the IRAS fluxes (). Stars with [25]-[12] -0.5 emit more infrared radiation than a pure black-body; this excess is usually attributed to dust emission (however, the infrared excess for some O and B stars may be dominated by free-free emission). A significant fraction (60%) of B and A stars show such infrared excess and are probably young pre-main sequence stars (Herbig Ae/Be stars, Waters & Waelkens 1998). A few F and G stars with with infrared excess are probably post-asymptotic giant branch stars (Oudmaijer et al. 1992). The M stars are shown in the lower-right panel, and are further discussed in §4. However, it can already be seen in this diagram that M stars with dust are typically more luminous than those without dust. Note also that early-type stars (OBA) with infrared excess have much redder [25]-[12] colors (up to 1), than M stars with infrared excess (). This difference is due to different dust density distributions in the circumstellar envelopes which are flatter for early-type stars than for late-type stars (IE00).
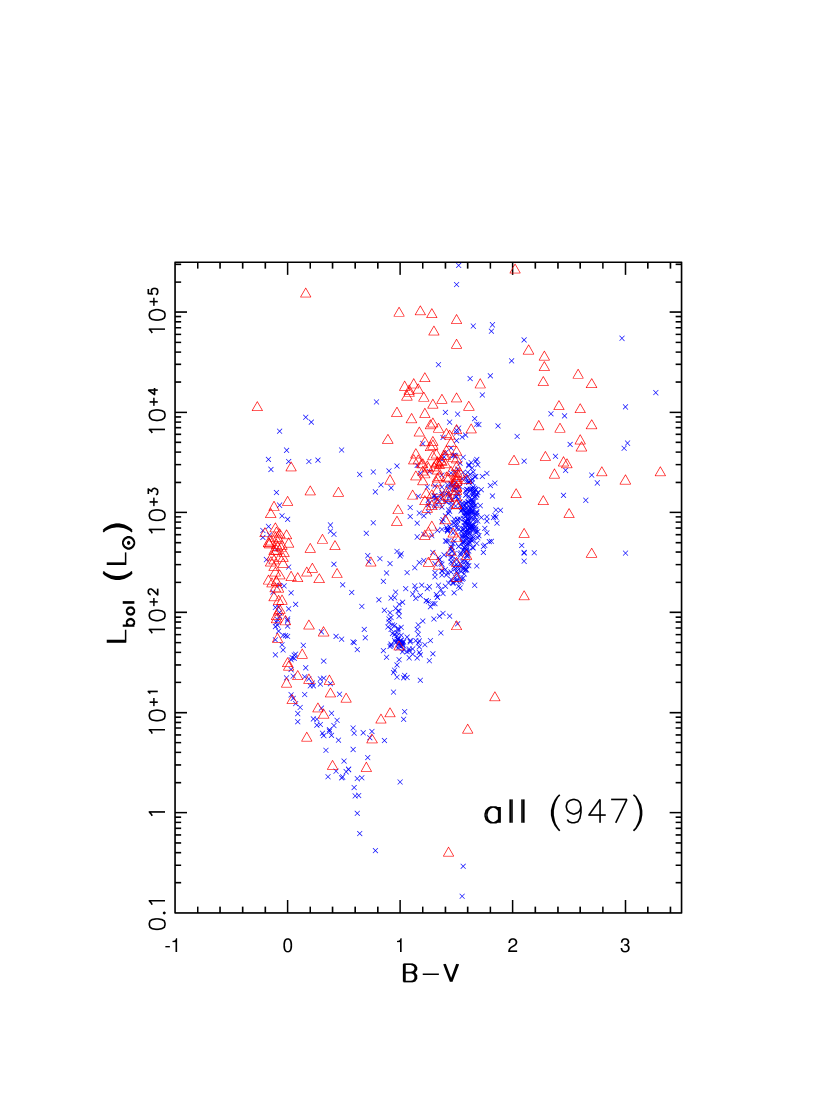
Fig. 2 shows that stars with mid-infrared excess can be simply selected as those with [25]-[12] -0.5. Figure 3 displays vs. - diagrams for a subsample of 947 stars satisfying V11m, with (239) and without (708) infrared excess, marked by triangles and crosses, respectively. It is easily discernible that dusty stars are found throughout the HR diagram. The three dominant dusty populations are early type OBA stars with 10 and - 0.6, and two types of late-type stars (further discussed in the following Section) with 103-104 : M stars with -1.3 and carbon stars with - 2.0 (Wallerstein & Knapp 1998).
4 Dust around AGB Stars
Asymptotic Giant Branch (AGB) stars are intermediate mass stars in a late evolutionary stage just preceding the planetary nebula phase. Due to copious mass loss (up to several 10-4 /yr), they are surrounded by dusty shells which emit distinctive infrared radiation (for an extensive review see Habing 1996). It is not clear what the relationship is between the mass-loss rate and luminosity for AGB stars. Early studies by Gilman (1972) and Salpeter (1974), and later by others (e.g. Netzer & Elitzur, 1993; Habing, Tignon, & Tielens, 1994), showed that the luminosity-to-mass ratios for AGB stars are sufficiently large that mass loss could be driven by radiation pressure. Furthermore, Ivezić & Elitzur (1995, hereafter IE95) find that steady-state, radiation pressure driven outflow models can explain IRAS colors for at least 95% AGB stars. However, in these models both the mass-loss rate and the stellar luminosity are free parameters, and cannot be independently constrained from the observations. We use the available luminosity and infrared colors for the sample of M giants discussed here to study this relationship.
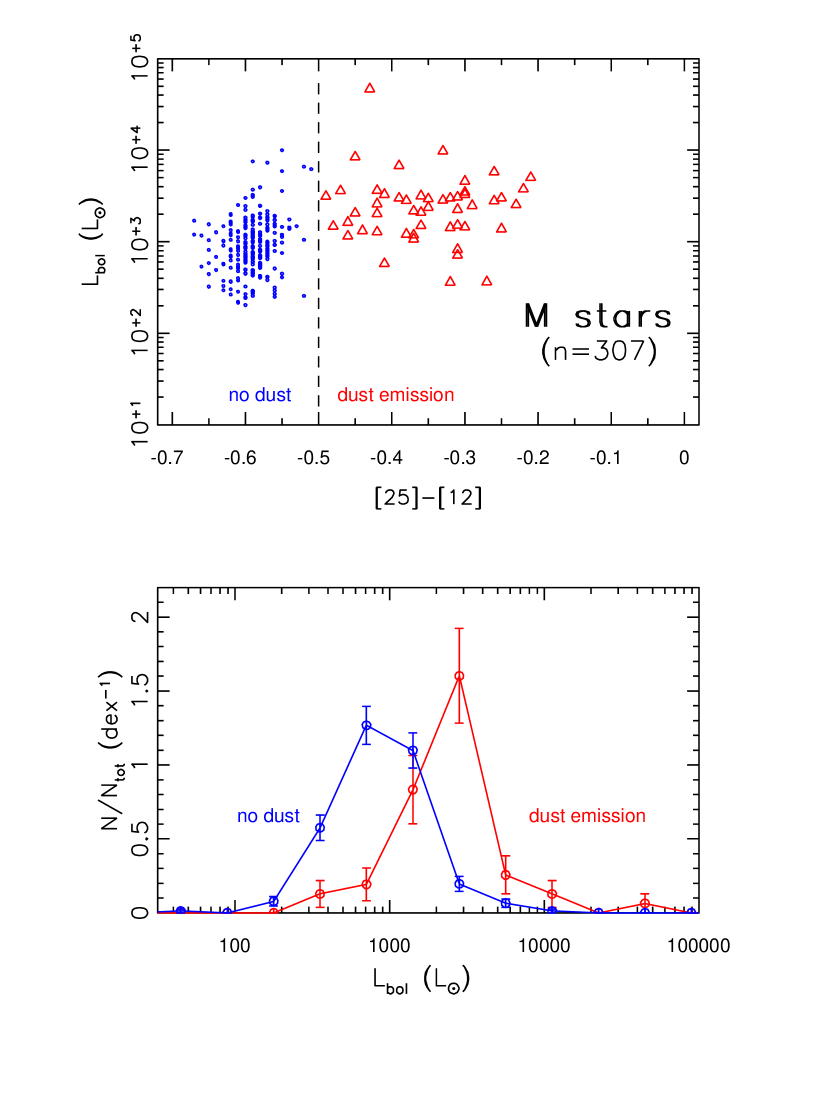
The top panel in Figure 4 shows the bolometric luminosity vs. [25]-[12] color diagram for a subsample of 307 M stars with distances less than 300 pc. The luminosities of 255 stars without dust emission ([25]-[12] -0.5) cluster around 1000 , while 52 stars with dust emission have luminosities on average 3 times larger. Only 5% of stars without dust emission have 3000 , and only 13% of stars with dust emission have 1000 . This difference in bolometric luminosity distributions is better seen in histograms shown in the bottom pane, which are plotted separately for each subsample. Figure 4 indicates that there is a characteristic luminosity of order 2000 for stars to develop a dusty envelope. Above this value the luminosity does not seem to be correlated with [25]-[12] color and its median luminosity for dusty M stars is 3000 .
The scatter of points for dusty M stars around the median luminosity is somewhat larger than the expected errors derived in §3, and thus may be real. However, the procedure used to determine bolometric flux is expected to be less accurate for stars emitting mostly in the infrared due to sparse flux sampling. The method employed here for estimating bolometric flux can be significantly improved by utilizing detailed radiative transfer models for stars embedded in dusty envelopes. When fitting a model to the observed fluxes, the model SED acts as a smooth interpolating function which produces a more robust estimate of the bolometric flux than an arbitrary function such as a piecewise power-law (the bolometric flux is simply a scaling parameter, see Ivezić & Elitzur 1997). Such a detailed model fitting of a large number of sources will be presented in a separate publication.
The difference in median luminosities of stars with and without dust emission could be due to biased selection procedure. For example, if somehow dusty stars with 1000 are excluded from the sample, then the median luminosity of the remaining subsample is overestimated. We have tested our sample for this and similar possibilities by relaxing the constraints on parallax, parallax error, V and F12, both individually and in various combinations. We find that the difference in median luminosity between the two subsamples is a robust result, even when the relaxed selection cuts result in a three times larger sample. Of course, in this case the scatter in luminosity around the median values is also increased, and we find that such outliers are mostly stars with relatively large parallax errors. Most notably, changing the distance cutoff from 200 pc to 500 pc does not effect the median luminosities of the two subsamples.
The median luminosity for dusty M stars obtained here (3000 ) is remarkably similar to the luminosity of AGB stars detected towards the Galactic bulge (2600 ), as determined by Habing et al. (1985). This strongly suggests that the luminosity of AGB stars is roughly the same throughout the Galaxy, and is also the same for stars with different mass–loss rates (the stars discussed by Habing et al. are significantly redder at IRAS wavelengths than the stars discussed here which were selected from optical catalogs). It is of interest to find out whether this conclusion also holds for AGB stars with carbonaceous dust grains. Due to different optical properties of silicate and carbonaceous grains, these stars do not show a large increase of [25]-[12] color for plausible mass-loss rates (IE95), and thus their mass-loss rate cannot be inferred from their [25]-[12] color. Nevertheless, the mass-loss rate for C stars can be determined from the intensity of their CO emission and we utilize such observations to study the relationship between the mass-loss rate and bolometric luminosity for AGB stars with carbonaceous dust grains.
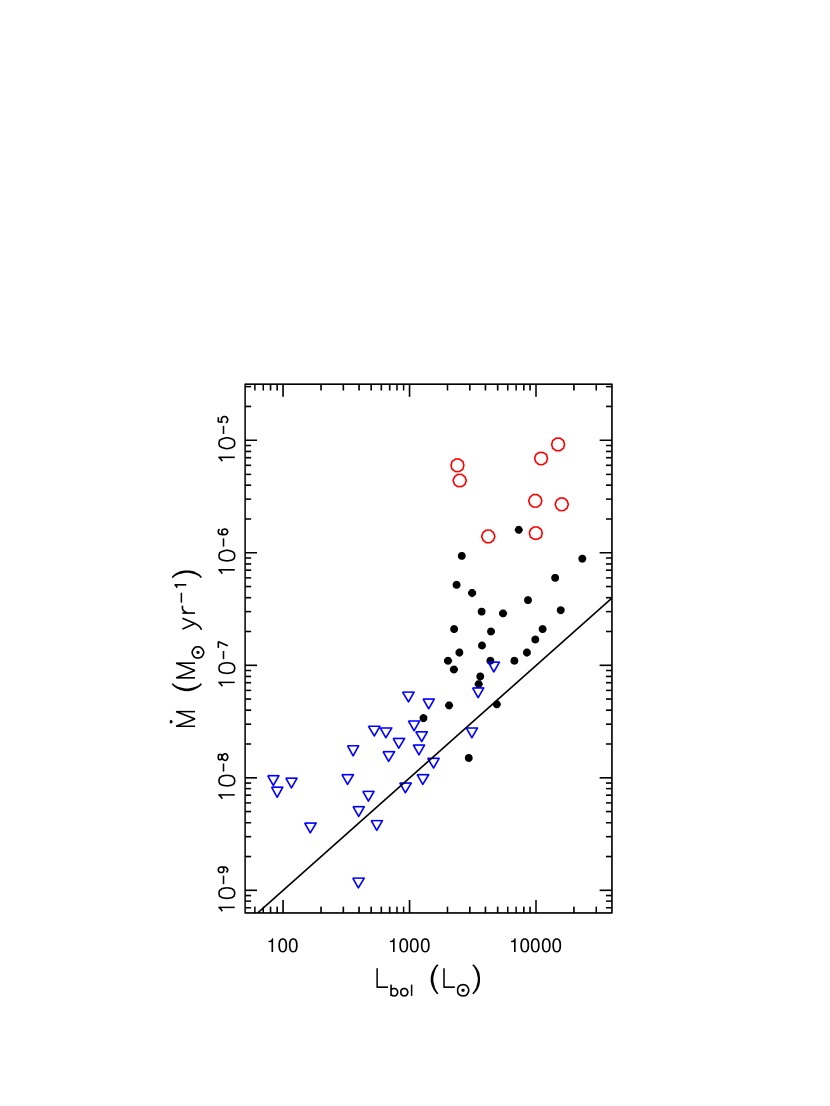
Figure 5 shows the mass-loss rate versus bolometric luminosity for a sample of 60 C stars with available CO emission observations (Knapp 2000). Distances are from the HIPPARCOS catalog for stars marked as filled circles, and indirectly determined (Knapp 2000) for stars marked by open circles. The mass-loss rate for stars not detected in CO, marked by triangles, is determined from their IRAS 60 m fluxes as described in Jura (1991). The distribution of sources shows that for C stars there seems to be a threshold luminosity of the order 2000 for stars to develop a dusty envelope. Similarly to the result found for M stars, above this threshold the luminosity does not seem to be correlated with mass-loss rate. This threshold luminosity of about 2000 is in agreement with the theoretical estimate expected for radiatively driven winds (e.g. Ivezić, Knapp & Elitzur 1998, and references therein).
Figure 5 also shows a line corresponding to
the approximate rate at which the inert helium core is growing from hydrogen shell burning (Schönberner 1983). At all luminosities the mass-loss rate is larger than the core mass growth rate, indicating that mass loss dominates the evolution of these stars, in agreement with Wallerstein & Knapp (1998). Assuming the [25]-[12] color to mass-loss rate transformation as given by IE95, we find that the same conclusion also holds for M stars (c.f. Figure 4).
Acknowledgments
This work has made use of the SIMBAD database and was supported in part by NSF grant AST96-18503 to Princeton University. The comments by the first anonymous referee, and by Tom Chester, the second referee have helped us to considerably improve the paper. We acknowledge Tolya Miroshnichenko and Dejan Vinković for illuminating discussions.
References
- (1) Beichman, C.A., Neugebauer, G., Habing, H.J., Clegg, P.E., & Chester, T.J. 1988, Infrared astronomical satellite (IRAS) catalogs and atlases. Volume 1: Explanatory supplement, (Washington, DC: US GPO)
- (2) Gezari, D.Y., Schmitz, M., Pitts, P.S., & Mead, J.M. 1993, Catalog of Infrared Observations (NASA RP-1294), 3rd ed. (Washington: NASA)
- (3) Gilman, R.C. 1972, ApJ, 178, 423
- (4) Habing, H. 1996, A&A Rev., 7, 97
- (5) Habing, H., et al. 1985, A&A, 152, L1
- (6) Habing, H.J., Tignon, J. & Tielens, A.G.G.M. 1994, A&A 286, 523.
- (7) Ivezić, Ž., & Elitzur, M. 1995, ApJ, 445, 415 (IE95)
- (8) Ivezić, Ž., & Elitzur, M. 1997, MNRAS, 287, 799
- (9) Ivezić, Ž., & Elitzur, M. 2000, ApJ, 534, L93 (IE00)
- (10) Ivezić, Ž., Knapp, G.R., & Elitzur M. 1998, Proceedings of the 6th Annual Conference of the CFD Society of Canada, June 1998, Québec, p. IV-13; also astro-ph/9805003
- (11) Jura, M. 1991, A&A Rev. 2, 227.
- (12) Knapp, G.R. 2000, submitted to ApJ.
- (13) Netzer N., & Elitzur M. 1993, ApJ, 410, 701.
- (14) Oudmaijer, R.D., et al. 1992, A&AS, 96, 625.
- (15) Perryman, M.A.C., et al. 1997, A&A Letters, 323, L49.
- (16) Salpeter, E.E. 1974, ApJ, 193, 579
- (17) Schönberner, D. 1983, ApJ 272, 708
- (18) van der Veen W.E.C.J., & Habing H.J. 1988, A&A, 194, 125
- (19) Wallerstein, G., & Knapp, G.R. 1998, ARA&A, 36, 369
- (20) Waters, L.B.F.M., & Waelkens, C. 1998, ARA&A, 36, 233
- (21) Zuckerman, B. 1980, ARA&A, 18, 263