The disc instability model of dwarf-novae and low-mass X-ray binary transients
Abstract
The disc instability model which is supposed to describe outbursts of dwarf nova and low-mass X-ray binary transient systems is presented and reviewed in detail. Various deficiencies of the model are pointed out and various remedies and generalizations are presented and discussed.
keywords:
accretion discs; instabilities; dwarf novae; X-ray binaries; X-ray transientsIn memory of Jan van Paradijs who inspired my research into the subject, and without whom this review would not have been written
1 Introduction
Dwarf novae are erupting cataclysmic variable stars (CVs) (Warner 1995a). In these binary systems outbursts take place in the accretion disc which is formed around the central white dwarf by matter transfered from the low-mass, Roche-lobe filling companion star. Low-mass X-ray binary transients (LMXBTs) are similar binary systems in which the white dwarf is replaced by a neutron star or a black hole (van Paradijs & McClintock 1995). Such X-ray transient systems are also called “Soft X-ray transients” or “X-ray Novae”. Both designations are misleading and we will use here only the term “LMXBT”. (The designation “dwarf nova” is also misleading but it has stuck and cannot be changed). It is believed that outbursts in both dwarf novae and LMXBTs are driven by the same mechanism: disc instability. This mechanism was proposed for dwarf novae more than 25 years ago (Osaki 1974). The instability was identified 4 years later (Hoshi 1979) and the model itself began to take shape in the early 80’s (Meyer & Meyer-Hofmeister 1981; Smak 1982,1984b; Cannizzo, Ghosh & Wheeler 1982; Faulkner, Lin & Papaloizou 1983; Mineshige & Osaki 1983). There are excellent articles reviewing the model – Smak (1984c), Cannizzo (1993a) and Osaki (1996) to mention only a few – so writing a new review on this venerable and well reviewed subject requires a good reason.
Such a reason was unintentionally suggested by Trimble & Aschwanden (2000) in their article reviewing astrophysics in 1999. After remarking that the dwarf-nova outburst mechanism is not known, the authors say with some sarcasm: “[The] Hameury et al. (1999) conclusion that there are several kinds of such mechanisms is not likely to get anybody into serious trouble”. This is true. But it is also rather new. Some fifteen years ago a similar conclusion did get some people into serious trouble. (For the history of the subject see the review by Cannizzo, 1993a). Until recently it was “generally accepted” that the thermal-viscous disc instability model (DIM) is the model of dwarf-nova outbursts. The main reason for this was that the competing model posited outbursts that were due to a mass-transfer instability, i.e. an instability in the secondary star. The DIM had a big advantage: it had a physical mechanism which was responsible for the instability. The mass-transfer instability model was lacked this essential ingredient because no plausible mechanism could be found. (The ‘plausible’ mechanism proposed by Hameury, King & Lasota 1986 for the dwarf-nova cousins, the “Soft X-ray Transients”, was shown not to work in practice by Gontikakis & Hameury, 1993). Observations also rather favoured the DIM (with some exceptions, see e.g. Smak 1991). Thus the DIM was widely considered to be the winner and the model.
These days things are different. It is still considered that the DIM is the dwarf nova model, but instead of the pure, original version, in which a disc receiving matter at a constant rate was undergoing outbursts due to a thermal-viscous instability only, one finds a rather impure mixture in which the mass-transfer rate varies on all possible time-scales and the outburst properties depend on the irradiation of both the disc and the companion star. In some cases the thermal-viscous instability needs help from a ‘tidal’ instability and big holes are cut in the disc’s inner regions. Heating by the mass-transfer stream impact and by dissipation of the tidal torque was also found to play a role in the outburst. All that is left of the original DIM is the thermal instability itself but even this, one would think fundamental, ingredient of the model is now looked at with some suspicion.
A short summary of some of the new ingredients can be found in Smak (2000). Although some of the modifications to the model date back a long time, most were successfully incorporated into the DIM only in the last few years. That is the real reason for this review.
It does not intend to show that the DIM is the model of dwarf-nova outbursts and of transient behaviour of the low-mass X-ray binaries. Nor will it show that it is not the model. Its aim is to show and discuss how the DIM works and why it needs modifications. Some of these modifications are required simply because we know from observations that physical processes ignored in the DIM operate in real binaries. Others are needed because the model, in its standard form, fails to reproduce some of the fundamental properties of the observed outbursts. Luckily, when some of the neglected processes are included in the model, they help to repair the failures. The price to pay, however, is that the number of free parameters increases and instead of a single model one now has several, none of them flawless. In recent years substantial progress has been made in understanding the fundamental physical process which is supposed to drive accretion in discs: turbulent viscosity. Paradoxically this has made things even more difficult for the DIM, since it challenges one of its main tenets: that both heating and angular momentum are due to the same, local mechanism. So if the DIM is to survive, it might require more than just a modification.
Finally, a personal remark: in a recent scientific meeting a speaker (a very good and clever observer) showed a transparency with side by side the light curve of the best-observed dwarf nova SS Cyg (see Fig. 9) and several light-curves calculated by a well known specialist of the subject. “As you can see”, the speaker said, “the model works pretty well”. Only two people started to laugh: the author of the calculations, present at the meeting, and the author of this review. We were laughing because we would have made such a comparison to show that the model does not work (see Sect. 4.1). I hope this review will prevent people from saying that the DIM works when it does not, or at least that it will make more than two people laugh when such assertions are made.
-
•
The review begins (Section 2) with a presentation and discussion of the DIM’s equations. One could have chosen to begin by describing the observations the model is supposed to reproduce or imitate, but this review is about a model and it seemed preferable to start with its description. An excellent description of dwarf novae can be found in the ‘CV–Bible’ by Warner (1995a); LMXTB properties are reviewed in Chen, Shrader & Livio (1997) and Tanaka & Shibazaki (1996). Too often, however, it is forgoten that a model like the DIM is a physical model, i.e. it consists of partial differential equations and boundary conditions. It is not a vague scenario which says that discs are sometimes unstable.
-
•
Section 3 is devoted to thermal equilibria and stability conditions and various generalizations of the DIM. In the first two sections after the introduction dwarf novae and LMXTBs are discussed together.
-
•
The next Section, 4, deals mainly with dwarf novae. However, if a problem is common to the two classes of systems it is often discussed in this section. Here, at last, one can find concise presentations of various classes of dwarf novae. Also here we begin to confront the model with observations. This section contains a description of a dwarf nova outburst which might appear rather lengthy but it is necessary in order to understand later sections of the review. Section 4 contains a discussion of the DIM outburst, the heating and cooling fronts, the front ‘reflections’ (reflares), the inside-out and outside-in outbursts and related problems (the ‘UV-delay’). This section ends with the discussion of the outburst recurrence times.
-
•
Section 5 contains models of various classes of dwarf nova stars. All of these models are a generalization of the DIM, the previous section having shown that the standard DIM is unable to reproduce even the simplest properties of dwarf-nova outbursts. This section ends with a discussion of the problems caused by dwarf nova quiescence.
-
•
Models of Low Mass X-ray Binary Transient systems are presented in Section 6. The review ends with a section discussing the main questions to be answered and the future of the DIM and its successors.
Although this review contains more than 200 references it really uses the work of only three groups of researchers. The reason is given by Smak (1998): “Of all models calculated in the past, only those of Smak (1984b, […1998]), Ichikawa & Osaki (1992), and Hameury et al. (1998,[1999]) used correct outer boundary conditions, describing the deposition of the stream material in the outermost parts of the disc, and the effects of the angular momentum”.
2 Equations
The DIM is often introduced by showing the -shaped curve which represents local disc equilibria. The -shape is due to the presence of a thermal-viscous instability: the middle part of the represent unstable equilibria. With this -curve one then can show schematically how the disc’s state may perform a “limit cycle” oscillating between hot and cold states. Such a schematic picture, is useful in understanding the basic reason for the disc instability, but it can be misleading, because although the instability is local the outburst itself is a global process and quite often the resulting local disc behaviour does not correspond to the simple, schematic -curve diagram. We therefore start the presentation of the model by the equations which are assumed to represent an accretion disc subject to a thermal and viscous instability. We will come to the -curve later, in Sect. 3.
In the disc instability model we assume that the disc is geometrically thin and in particular that its angular momentum is always Keplerian. This allows a separation of its vertical and radial structures (see e.g. Pringle 1981). Several, more or less equivalent, versions of the disc’s structure equations have been used in the literature. Here we will follow the version of Hameury et al. (1998, thereafter HMDLH), which in turns closely follows that of Smak (1984b).
2.1 Radial equations
The mass and angular momentum conservation equations in a geometrically thin accretion disc can be written as:
| (1) |
and
| (2) | |||||
where the surface density , with the mass density, is the rate at which mass is incorporated into a ring at radius , the radial velocity in the disc, is the specific Keplerian angular momentum of material at radius in the disc, is the Keplerian angular velocity ( being the mass of the accreting object), is the kinematic viscosity coefficient, and the specific angular momentum of the material transferred from the secondary. is the torque due to tidal forces, whose form will be specified later (Eq. 5).
The energy conservation (thermal equation) can be written as:
| (3) |
where and are respectively the heating and cooling rates per unit surface. Their usual form is
| (4) |
and , where is the effective temperature. is the specific heat at constant pressure.
The term accounts for the radial energy flux carried by viscous processes and/or by radiation. There is no generally accepted form of this term; for particular versions see e.g. HMDLH and Cannizzo (1993b). (The form used in HMDLH assumes “viscous” radial energy-transport.) Since it contains a second derivative with respect to radius, this term can be neglected when considering equilibria of geometrically thin discs because then the energy equation is just and radial gradients are small compared to the vertical ones. During outbursts, when steep temperature gradients are present in the disc, it can play an important role in front propagation (Menou, Hameury & Stehle 1999).
Eq. (3) also contains terms describing heating of the outer disc by the impact of the stream of matter transferred from the secondary (the “hot spot”) and by the tidal torque . These terms, denoted by , are not usually taken into account. Except for Ichikawa & Osaki (1992), only Buat-Ménard, Hameury & Lasota (2001a,b) calculated models which include these two additional heat sources. As we will see later, including these terms helps repair several of the DIM’s deficiencies. Heating by impact and by tidal torques can be treated only in a rather simple way. The tidal torque is taken from Papaloizou & Pringle (1977):
| (5) |
where is the angular velocity of the binary orbital motion, is a numerical coefficient taken so as to give a stationary (or time averaged) disc radius equal to a chosen value, and is the binary orbital separation. The viscous dissipation induced by this torque is written as
| (6) |
The heating by the hot spot is difficult to evaluate in a way that would be both physically consistent and numerically interesting. Buat-Ménard et al. (2001a) assumed that the stream impact heats an annulus fraction of the disc with an efficiency . The heating rate is then taken as:
| (7) |
where the mass transfer rate from the secondary and the accretion disc outer radius. This assumes that the difference between the stream and the Keplerian kinetic energy is released in a layer whose width is with an exponential attenuation.
2.2 Boundary conditions
The partial differential equations which describe the radial disc structure must be completed by boundary conditions. Some of these boundary conditions affect the solutions in a fundamental way (see Sect. 4.1). This is the case of the outer boundary conditions for the mass and angular momentum equations.
2.2.1 Outer boundary
A proper treatment of the precise way in which matter is incorporated into the disc is a very difficult problem in itself, and it can be included in the DIM only in the simplest fashion. The assumption apparently reasonable but not always confirmed by observations is that mass addition at the outer edge of the disc occurs in a very narrow region, so that the disc edge is very sharply defined. One can then write and , where is the mass transfer rate from the secondary star, is the Heavyside function, is the Dirac function and , the surface column density, is a smoothly varying function. Cancelling the terms in the equation for mass and angular momentum conservation yields two boundary conditions, which can be written in the form (HMDLH):
| (8) |
and
| (9) |
where the index 0 denotes quantities measured at the outer edge, and is the circularization radius, i.e. the radius at which the Keplerian angular momentum is that of the matter lost by the secondary star ( in Eq. 2), and is the time derivative of the outer disc radius. It is worth noting that in this formulation the presence of a torque is necessary; no steady solutions exist when .
Conditions given by Eqs. (8) and (9) take into account the fact that the outer edge of the disc can vary with time; its position is controlled by the tidal torque .
The expression for the tidal torque requires careful reanalysis. Observations of accretion disc radii (Harrop-Allin & Warner 1996) in quiescent dwarf novae give values smaller than those calculated in the model and as suggested by Smak (2000) the culprit could be Eq. (5), in particular the parameter which determines the disc’s size (Buat-Ménard et al. 2001a). We will come back to this issue in more detail later when discussing the nature of ‘inside-out’ and ‘outside-in’ outbursts (Sect. 4.4).
When modelling dwarf-nova outbursts it is often assumed that the outer edge of the disc is fixed at a given radius, in which case Eq. (8) is used with , and Eq. (9) is replaced by ; the tidal torque is also neglected in Eq. (2). This is equivalent to assuming that is negligible at and becomes infinite at (Cannizzo calls this a “brick wall”). In view of the steep functional dependence of , this might seem a reasonable approximation; however, this is not the case as can be seen in Fig. 9 and discussed in HMDLH, and most of the results obtained with the “brick wall” conditions are of no interest when applied to real systems (see e.g. Smak 1998 for a discussion of this problem). An intermediate formulation was proposed by Mineshige & Osaki (1985) who assumed that the viscous stresses vanish at a fixed outer radius. This enables matter carrying angular momentum to leave the disc at its outer edge, at a rate comparable to the mass transfer rate.
2.2.2 The inner boundary
The inner boundary condition is usually taken to be the no-stress condition (), which in practice amounts to at the inner edge of the disc.
There a several reasons, discussed later in the article, why a dwarf - nova or LMXBT accretion disc may not extend down to the surface of the accreting body, or to the last stable orbit, but instead be truncated at some larger radius. In the case of white dwarfs and neutron stars the disc around them might be truncated by the magnetic field of the accreting body. In such a case the inner disc radius is given by the magnetospheric radius (see e.g. Frank, King & Raine 1992):
| (10) |
where is the white dwarf’s magnetic moment.
But the disc could also be truncated by evaporation of its inner regions. No complete theory of this process exists and one uses ad hoc formulae which are supposed to be a reasonable approximation of what the models (e.g. Meyer & Meyer-Hofmeister 1994; Esin, McClintock & Narayan 1997; Kato & Nakamura 1999; Liu et al. 1999; Manmoto et al. 2000; Shaviv, Wickramasinghe & Wherse 1999) suggest. For example, Menou et al. (2000) and Dubus, Hameury & Lasota (2001, hereafter DHL) use the following prescription:
| (11) |
where g s-1 is the Eddington rate corresponding the Eddington luminosity assuming a 10% accretion efficiency; c is the speed of light and is the Schwarzschild radius. is an ‘evaporation efficiency’ factor (see Menou et al. 2000).
2.2.3 The thermal equation
The thermal equation is a second order partial differential equation in , so that two boundary conditions are required. However, except across a transition front between a hot and a cool region, the dominant terms in Eq. (3) are and . The highest order terms in the thermal equation are therefore negligible in almost all of the disc. These boundary conditions are thus of no physical importance. One can take, as for example in HMDLH, at both edges of the disc.
2.3 Vertical structure equations
In a geometrically thin disc one can decouple the vertical and radial structures (e.g. Pringle 1981; Frank et al. 1992). There are several ways of describing the accretion disc vertical structure. In the DIM, equations describing the disc’s vertical structure are usually written in a form similar to that used for stellar structure:
| (12) | |||||
| (13) | |||||
| (14) | |||||
| (15) | |||||
where is the vertical component of gravity, is the surface density between and , and the temperature gradient of the structure. is a time-dependent contribution that includes terms resulting from heating/cooling and contraction/expansion (see below).
In the case of radiative energy transport the temperature gradient can be written as
| (16) |
where is the radiation pressure and is the Rosseland mean-opacity coefficient. This formulation assumes that the disc is optically thick. Since it would be practically impossible to include an accurate treatment of the radiative transfer (such as that of Shaviv & Wehrse 1991) in time-dependent calculations, a grey-atmosphere type approximation must be used when the disc is optically thin (see e.g. Smak 1984b; HMDLH).
The DIM attributes the instability to partial hydrogen ionization, which implies that convection may become the dominant mode of energy transport, as these two processes often come together. Since we don’t really know how convection operates in accretion discs this is one of the weak points of the model. The most efficient way of treating a convective disc () is to use the mixing-length approximation which is used in stellar models. The role of convection in accretion disc structure is very nicely described by Cannizzo in his 1993 review to which the reader is referred for further discussion. The form of the equilibrium solutions is affected by the presence of convection (see Fig. 2) but as explained in Sect. 3 this, fortunately, is not very important in practice.
Much more important is the term which is supposed to describe the contribution of all the non-equilibrium processes to the vertical disc structure. A correct inclusion of these effects would require a 2D treatment, which for the moment is out of the question. Instead one assumes that is proportional to , or an ansatz roughly equivalent to this (e.g. Mineshige & Osaki 1983). In such a case Eq. (15) can be replaced by:
| (17) |
where (the subscript has nothing to do with its namesake in the effective temperature !) may be considered as some effective viscosity parameter. This coefficient is not known a priori and is different from the true viscosity parameter (Eq. 20)); the difference is a measure of the departure from thermal equilibrium. The vertical structure, and hence the disc effective temperature at any given point, can then be calculated assuming that the disc is in thermal equilibrium, but with some unspecified different from . The same method is used for the heating due to tidal torques and accretion stream impact (Buat-Ménard et al. 2001a).
Such an approximation is valid for perfect gas and homologous cooling and contraction (Smak 1984b), but in general is unjustified and can be the source of serious errors. For example, HMDLH estimate that the cooling fluxes in time-dependent accretion discs are only determined to within 50%. This basic fact should not be forgotten when comparing the model’s results with observation. Too good a correspondence should be treated with more suspicion than enthusiasm.
The -approach is just an ansatz replacing the required 2D treatment. Recently, Truss et al. (2000) used a 2D SPH code to simulate dwarf nova outbursts. To judge the value of this interesting approach one should wait for a more realistic physics to be added to the scheme.
2.3.1 Boundary conditions
Vertical structure equations must be completed by boundary conditions. In the optically thick case Eqs. (12–15) are integrated between the disc midplane and the photosphere (), where is the optical depth. The boundary conditions are , , , at the disc midplane, and
| (18) |
where , at the photosphere (Dubus et al. 1999; hereafter DLHC). The term allows one to take into account the effects of irradiation (see Sect. 3.2).
2.4 Viscous heating and angular momentum transport
The disc instability model uses the “”-disc framework of Shakura & Sunyaev (1973). The original prescription for turbulent viscosity was based on a purely dimensional analysis. The origin of this viscosity was not specified. Nowadays it is widely believed that turbulence in accretion discs is due to magneto-rotational Balbus-Hawley instability (see Balbus & Hawley 1998 for a review and Hawley 2000 for 3D global simulations). Recently, Balbus & Papaloizou (1999) showed that -models can be obtained from the mean-flow dynamics of MHD turbulence. In particular, the turbulent viscous heating per unit surface can be derived to be:
| (19) |
which, for Keplerian disc, is equivalent to Eq. (4).
Assuming , where P is the (usually total: gas plus radiation) pressure and is a parameter (the “viscosity parameter”), this can be also written as:
| (20) |
which is (for Keplerian discs) equivalent to the kinematic viscosity coefficient written as
| (21) |
Although it is reassuring that the prescription corresponds to at least one mechanism which produces turbulent viscosity one should be aware that in actual simulations “” exhibits large (vertical) gradients and time fluctuations (Hawley 2000; Hawley & Krolik 2000) so it is not clear that it can be used in the way it is in the disc instability model. However, until now simulations have not produced a geometrically thin disc (see, however, Armitage, Reynolds & Chiang 2000). Since it is just such a disc that is supposed to be an -disc, the problem of the physical meaning of the -prescription is still open.
The solution of this problem is important for the DIM because this model is intimately related to the main tenet of the -prescription, that both heating and angular momentum transport are due to the same, local mechanism. I will come back to this in Sect. 5.5.
3 Thermal equilibria: the -curve
3.1 The “standard” case
Let us first consider thermal equilibria of an accretion disc in which heating is due only to local turbulence, leaving the discussion of the effects of irradiation and tidal dissipation and/or stream impact to Sections 3.2 and 3.4. We put therefore .
The thermal equilibrium in the disc is defined by the equation (see Eq. 3), i.e. by
| (22) |
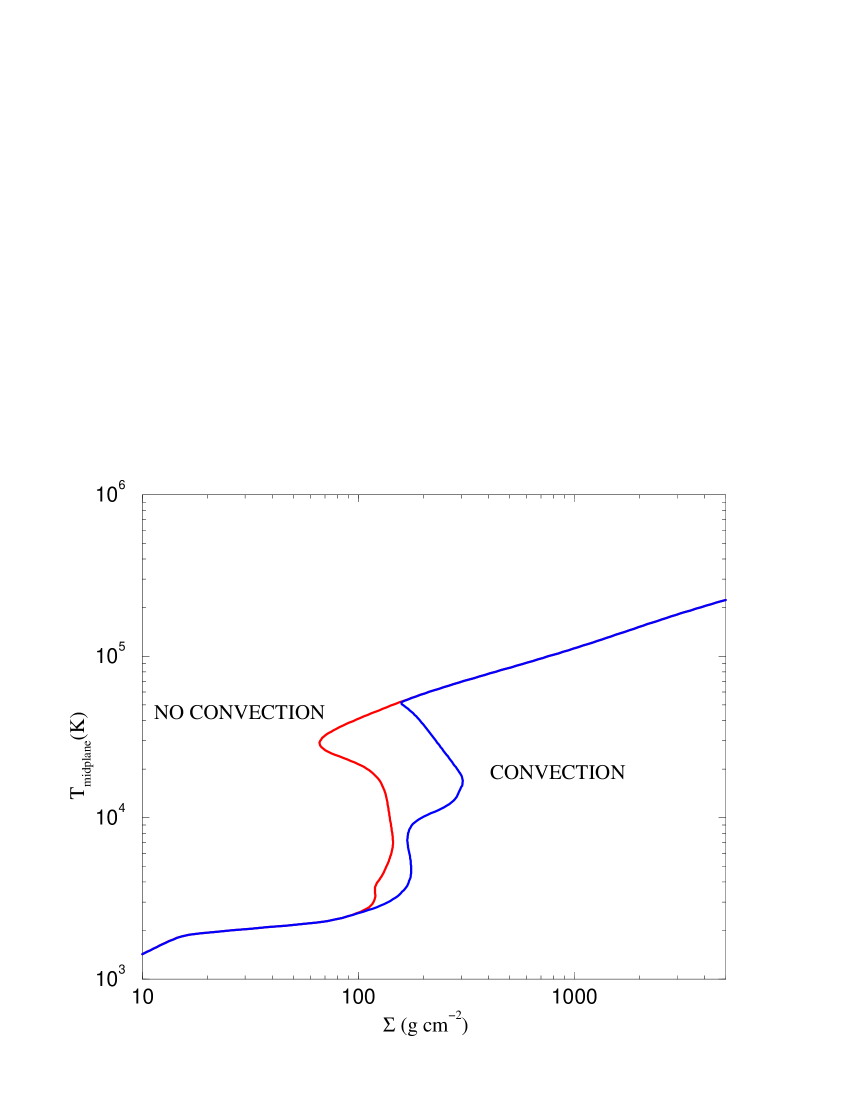
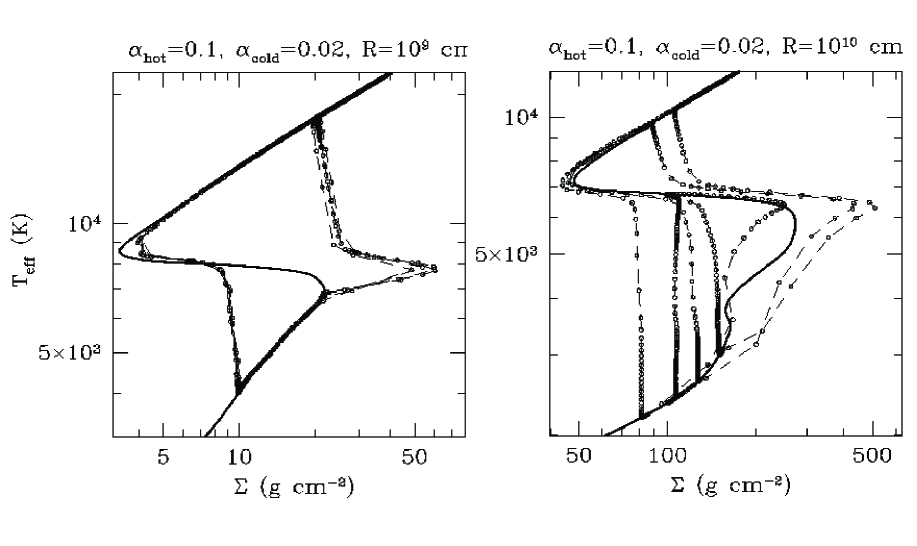
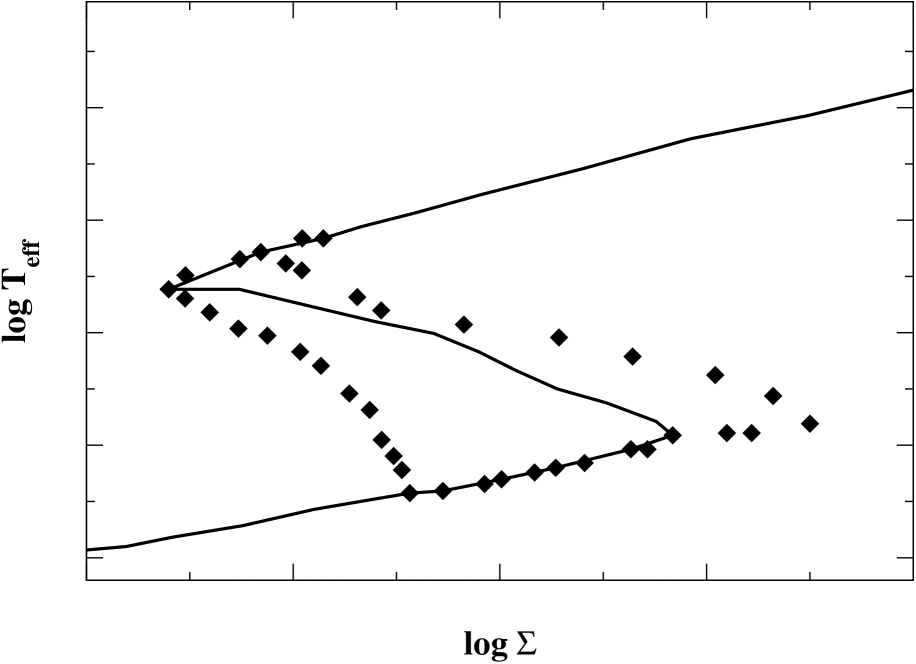
In general, is a function of density and temperature. The energy transfer equation (e.g. Eq. 16) provides a relation between the effective and the disc midplane temperatures so that thermal equilibria can be represented as a – relation. In the case of a dwarf-nova disc this relation forms an on the () plane as in Figs. (1) and (2).

Each point on the () -curve represents an accretion disc’s thermal equilibrium at a given radius. The middle branch of the -curve corresponds to thermally unstable equilibria, so that if anywhere in the disc the effective temperature corresponds to this middle branch the disc cannot be in a stable equilibrium. A stable disc equilibrium can be represented only by a point on the lower cold or the upper hot branch of the -curve. This means that the surface density in the cold state must be lower than the maximal value on the cold branch: , whereas the surface density in the hot state must be larger than the minimum value on this branch: . Both these critical densities are functions of the viscosity parameter, the mass of the accreting object and the distance from the center. Numerical fits to the critical densities are given in the Appendix and plotted as a function of radius in Figs. 5, refsigr, 8, 10 and 16. The outburst properties depend strongly on the fact that both critical densities increase with distance. To the critical densities correspond critical values of the effective and midplane temperatures. Their values are almost independent of the parameters of the system because they represent critical temperatures at which the disc is, e.g., fully ionized or neutral, i.e. they are universal. When the -curve is assumed to represent both thermal and viscous equilibria one can also relate and to critical values of the accretion rate (see below).
.
The disc is thermally stable if radiative cooling varies faster with temperature than viscous heating (see e.g. Frank et al. 1992). In other words it is stable if
| (23) |
Using Eq. (31) this can be transformed into
| (24) |
In a gas pressure dominated disc (see e.g. Frank et al. 1992). The thermal instability (the upper bend in the -curve) is due to a rapid change of opacities with temperature when hydrogen begins to recombine. At high temperatures . At temperatures close to 7000 K, the temperature exponent becomes large and positive , so in the end cooling is decreasing with temperature. The disc is then unstable and its equilibria correspond to the middle branch of the -curve. On the lower branch the disc is cold and and stable.
The position of the critical points of the -curve depends on the cooling processes which are taken into account in the model. Fig. 2 shows two -curves calculated with and without convection. One can see that including convection increases the value of the critical midplane temperature, thus giving a larger amplitude of the temperature jump which occurs when a thermal instability appears in the disc.
This is, however, not very important in practice because the actual -curve used in the DIM is a combination of two -curves with two different ’s. It was realized quite early in the development of the model that in order to reproduce observed amplitudes and durations of the various phases of the dwarf-nova outburst cycle the parameter must have different values in outburst and in quiescence (Smak 1984b). In other words, must be different on the upper and lower branches of the -curve. It is then required that and , where and are the values of the viscosity parameter at the upper and lower branches respectively. The transition between the two values must be sharp, which is assured by making a function of temperature (Ichikawa & Osaki 1992, use a formula which gives a not very sharp transition). HMDLH, for example, use the formula
| (25) |
A different prescription must be used in the case of an irradiated disc because the local state of the disc is determined by a non-local quantity: the irradiation from the disc’s central regions (Hameury, Lasota & Dubus 1999; DHL).
In Figs. 1, 2 and 11 one can see a second lower critical value of which results from convection and changes in molecular opacity (see e.g. Cannizzo & Wheeler 1984). This lower bend on the -curve appears at relatively low temperatures, i.e. at large radii and for low ’s. This lower bend plays an important role in the outburst cycle because it is where the system leaves the cold branch of the -curve during the rise to outburst. This should be kept in mind when one estimates characteristic parameters of an outburst such as recurrence times. In the models, oscillations between the lower and the higher parts of the cold branch are sometimes obtained. It is not clear if they correspond to anything observed in real systems.
There have been attempts to make a function of the temperature not only in the narrow region between the cold and hot branches but also along the -curve. In such models the viscosity parameter is also a function of the radius. Such an ansatz allows interesting experiments with the DIM but all physical arguments presented in its favour are unfounded or just based on inconsistent numerical schemes (we will mercifully pass over in silence the relevant references). This does not mean that in ‘reality’ is not a function of radius and time (see e.g. Hawley & Krolik 2000). It means only that there is nothing in the model itself that would require such a dependence. In this review I will therefore consider only models in which and are both constant. The only exception will be the form of assumed by Ichikawa & Osaki (1992) in order to suppress so called ‘inside-out’ outbursts.
The -curve represents thermal but not necessarily viscous equilibria. To illustrate this let us consider, for example, a hot optically thick disc. From Eqs. (14)(15) one can then obtain the following relation: (e.g. DLHC):
| (26) |
where is the midplane temperature and is the total optical depth, with being the Rosseland mean opacity. Writing the mean opacity in Kramers form , one can easily find that which corresponds to the slope of the upper, hot branch of the -curve (see e.g. Frank et al. 1992). We have nowhere assumed that the disc is in a viscous equilibrium, i.e. we did not assume that in the disc. If one makes this assumption one obtains the well known formula
| (27) |
which relates the effective temperature to the accretion rate ( is an inner boundary-condition factor, see e.g. Frank et al. 1992). Equation (27) results from , which in turn is obtained from the angular-momentum conservation equation when one assumes that the disc is stationary. Assuming only thermal equilibrium gives instead, the relation
| (28) |
and Equation (27) has to be replaced by
| (29) |
During a dwarf nova outburst a point representing a local (at a given radius) accretion disc’s state moves in the plane as shown on Fig. (11). A point out of the -curve is out of thermal equilibrium. In the region to the right of the -curve heating dominates cooling, so that the temperature increases and the system-point moves up towards the hot branch. On the left the is the case opposite and the point moves down towards the cool branch. These upward and downward motions take place in thermal time since they correspond to the heating and cooling of a disc’s ring (in Fig. (11) one can see non-local effects, which will be discussed later). During decay from outburst and during the quiescent phase of the outburst cycle, the system-point moves along, respectively, the upper and lower branches. This evolution happens in viscous time, which in a geometrically thin disc is much longer that thermal time. During this viscous evolution the disc is in thermal equilibrium but, obviously, not in viscous equilibrium. In such a case Eq. (29) (Idan et al. 1999).
3.2 Effects of irradiation
When a disc is irradiated the same equations are solved as in the preceding section but now with the full boundary condition
| (30) |
where . Irradiation therefore changes the relation between the midplane and the surface temperature. In the case of large optical depths this relation can be written as (DLHC; Lasota 1999)
| (31) |
where is the total optical depth of the disc.
We will now see how irradiation modifies the -curve. For the moment the irradiation temperature will be treated as a free parameter. In applications this temperature is often related to the accretion rate at the inner disc and depends on distance and other parameters. This implies that thermal equilibria depend on non-local quantities, and makes the concept of a -curve less simple and useful. The -curve, however, helps to understand how irradiation modifies the disc’s stability properties.
The effective and midplane temperatures at which a non-irradiated hot disc becomes thermally unstable are given by Eqs. (71), (73) leads to (see Eq. 31) so the disc is then optically thick.


Eq. (24) changes now to
| (32) |
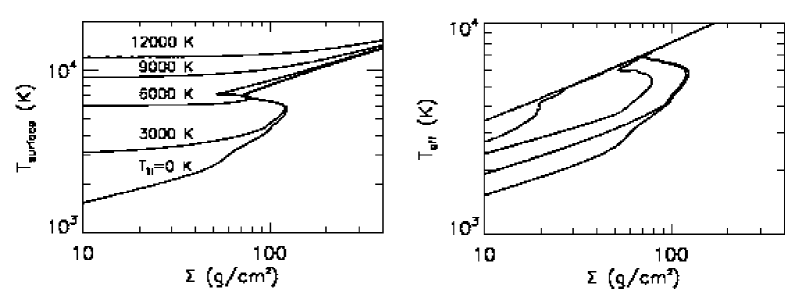
where Eq. (31) was used. As can be seen from Eq. (32), even a moderate ratio modifies the transition from stable to unstable configurations, thereby pushing it to lower temperatures. This effect is clearly seen in Fig. 3. Irradiation has a second effect on the disc’s stability: it suppresses or alters convection, as can be seen in Fig. 4.
The -shape is suppressed when the surface temperature is higher than the ionization temperature. Then, since the temperature must increase towards the midplane, the disc will always be ionized and no thermal instability is possible.
Overall, irradiation lowers as pointed out by van Paradijs (1996) and also lowers the critical mass-transfer rate at which hot discs become unstable.

This effect is important in low mass X-ray binaries where the outer disc is subject to strong X-ray irradiation (van Paradijs & McClintock 1995) by a central source. In cataclysmic variables this effect is not important but as pointed out by Smak (1989) and more recently by King (1997) a hot white dwarf may affect the inner disc structure. This will be discussed in the Section 3.3.
3.2.1 Irradiation by a hot white dwarf
The irradiation of the inner disc by a hot white dwarf and its influence on the dwarf-nova outburst cycle was discussed in detail by Hameury et al. (1999).
They considered the irradiation temperature given by (e.g. Smak 1989)
| (33) |
where , and are the white dwarf radius and temperature. is the fraction of the incident flux which is absorbed in optically thick regions, thermalized and reemitted as photospheric radiation.
In this case irradiation has two effects. First, it stabilizes the disc near the white dwarf, modifying the -curve in a way similar to that shown in Fig. 3. Second, as shown in Figure 5, irradiation has a strong destabilizing effect farther away from the white dwarf. Figure 5 shows , as a function of radius (see Hameury et al. 1999 for details). One sees that can be reduced by more than one order of magnitude as compared with the un-irradiated case. By lowering the critical density irradiation makes this part of the disc more subject to instability. The reason is very simple: if the inner part of the disc is hot and stable but the outer part is cold, somewhere in between, there must be an unstable region. This, of course, affects the outburst cycle.
King (1997) suggested that irradiation by a hot white dwarf would force the inner part of a quiescent dwarf-nova disc to remain hot and optically thin. Hameury et al. (1999) shows that this is not what the DIM predicts, at least in the case of U Gem-type dwarf novae. They argue that it seems more likely that the inner part of the disc is evaporated (Meyer & Meyer-Hofmeister 1994) and the dwarf nova disc is truncated. The role of the white dwarf irradiation in this process is not clear. The observation of the low state of TT Ari by Gänsicke et al. (1999), just shows that in this system the inner disc is truncated, but contrary to authors assertion is not a confirmation of King’s scenario. In any case the structure of low state accretion disc in TT Ari, not a dwarf nova, should be different from a dwarf-nova quiescent disc.
3.3 A global view of -curves
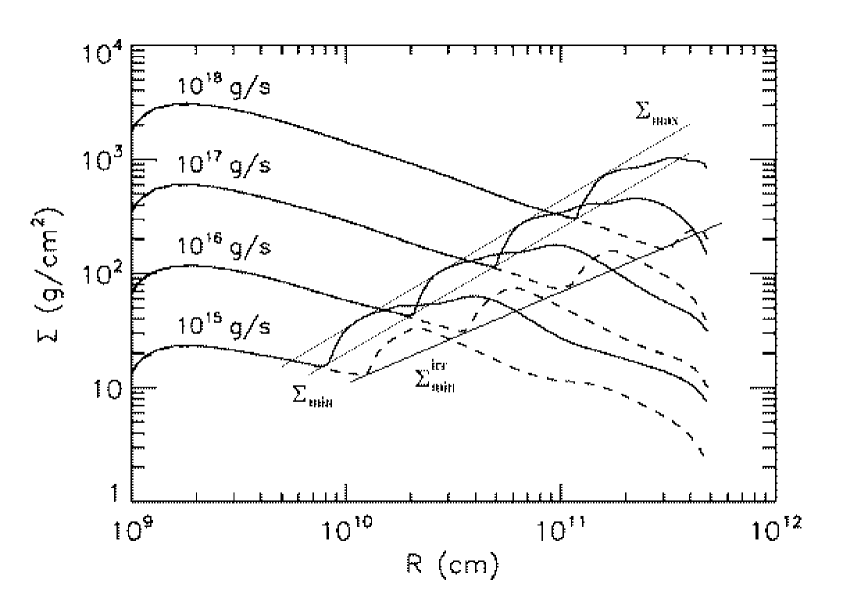
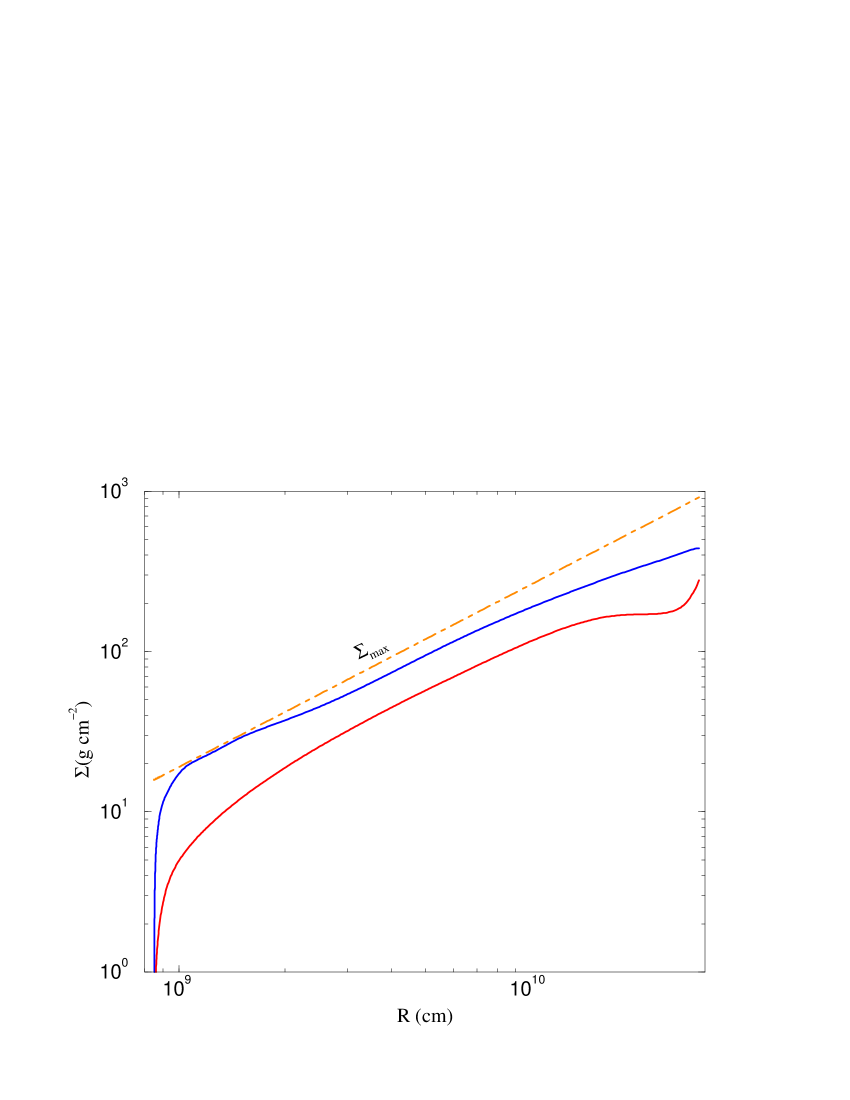
The -curve is a local concept but it can also be used in a global way. Figure 6 shows radial surface-density profiles of stationary discs around a 10 M⊙ accreting body (a ‘black- hole’). Profiles for 4 values of the accretion rate are shown. Each curve has a (local) minimum corresponding to and a maximum corresponding to . The figure, also shows the effects of irradiation by a point source located at the disc’s inner regions (see DLHC for details). As mentioned above, irradiation lowers the value of . These new, lower values are marked by an asterisk. For a given accretion rate if the disc is on the hot stable branch. On a local -curve such inequality would only mean that a particular ring is hot and stable; here it means that the whole disc is hot and stable. One can see that in the unstable disc regions the surface density increases with radius. In the cold stable parts things are more complicated, as could be expected from the presence of two critical ‘’ in the -curve.
From Figure 6 one can immediately estimate what is the minimum mass-transfer rate for which an accretion disc with a given outer radius is hot and stable. For example a disc with cm will be stable for mass-transfer rates g s-1 but a larger non-irradiated disc would be unstable. Irradiation extends the stability range of g s-1 up to cm. The corresponding stability criterion can be obtained from Eq. (69) with . Using where
| (34) |
( is the mean Roche-lobe radius), one obtains
| (35) |
for the minimum accretion rate in a hot and stable non-irradiated disc.
For a LMXB disc irradiated by a point source the criterion is
| (36) |
where is defined in (Shakura & Sunyaev 1973):
| (37) |
(the definition of this quantity here differs by a factor of 10 from the one used in DLHC). The difference between Eq. (36) and similar equations published in DLHC and Lasota (2000b) is due to different approximations used for the outer disc radius and to typing errors. One should keep in mind, however, that the main uncertainty is contained in the factor .

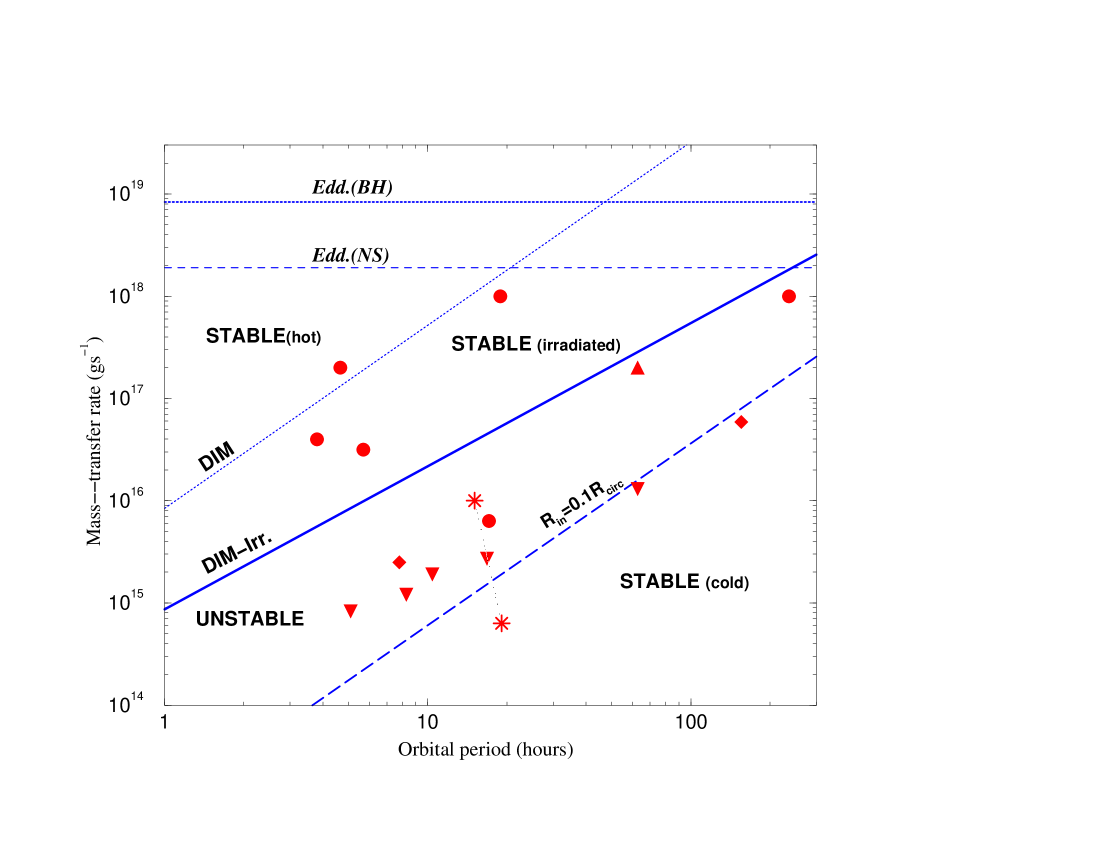
In Figure 7 most of the steady X-ray binaries are above the line but would be unstable according to the criterion (van Paradijs 1996). This means, probably, that Eq. (36) gives a reasonable criterion for stability of irradiated discs in LMXBs. The two odd sources which find themselves below the critical line but show no signs of being transient are AC 211 ( hr)and Cyg X-2 ( hr). It seems that the mass-transfer rates used for them in the figure are underestimated. Cyg X-2 could still be in a slightly super-Eddington regime (see King & Ritter 1999). AC 211 should rather have a mass-transfer rate g s-1 (Podsiadlowski, private communication) and according to Homer & Charles (1998) it could even be accreting at a very super-Eddington rate, both variants thus solving the apparent discrepancy between the properties of these two sources and their position in Fig. 7.
Conditions are only necessary for stability. A disc could be stable for such mass-transfer rates if it was in a cold state everywhere, i.e. if for all . One can guess from Fig. 6 that for discs extending down to small radii this would imply very low, usually uninteresting mass-transfer rates. One can also see, however, that for an inner disc radius cm (i.e. in this case for ) an accretion disc will be cold and stable for g s-1 . These are values of inner disc radii that were suggested for quiescent LMXBTs (e.g. Narayan, McClintock & Yi 1996, Narayan, Barret & McClintock 1997; Lasota, Narayan & Yi 1996; Hameury et al. 1997; Lasota 2000a; Esin, McClintock & Narayan 1997; Menou, Narayan & Lasota 1999). Such discs could be stable or marginally stable. Figure 7 shows the line representing a possible inner disc radius, assuming that it represents a fraction 0.1 of the circularization radius (see Menou et al. 1999b for details). Clearly black-hole transient systems are close to the stability limit. Menou et al. (1999b) suggested that they could represent the high mass-transfer tip of a larger population of faint and stable binary systems.
Similar ideas were proposed earlier for dwarf-nova quiescent discs (Lasota, Hameury & Huré 1995; Hameury, Lasota & Huré 1997; Meyer & Meyer- Hofmeister 1994; Warner, Livio & Tout 1996 and more recently Menou 2000b).
3.4 Effects of stream-impact heating and tidal dissipation
Heating by stream impact and/or by tidal dissipation will of course change the properties of thermal equilibria. Figure 8 shows how these effects change the values of the critical surface-densities. Additional heating lowers both and . It also diminishes the interval between the two. Lower values of make it easier to trigger outbursts in the outer disc regions. The situation is ‘symmetrical’ in radius with respect to the effects of the heating of the inner disc by the hot white dwarf (Fig. 5). Lower should shorten the duration of quiescence.
4 Dwarf novae

We will first deal with dwarf nova outbursts. The standard version of the DIM was designed to explain and reproduce these phenomena, or at least a subclass of them, since dwarf novae show at least three types of outburst cycles. According to the type the outburst dwarf novae can be of U Gem, SU UMa and Z Cam type. The types are named after the prototypes, which still belong to the class they defined one of the few reassuring things one can say about dwarf novae. The outbursts themselves are divided into ‘normal’ outbursts and ‘superoutbursts’. All three dwarf-nova types show normal outbursts and only SU UMa stars show superoutbursts. There are important exceptions, however. Some SU UMa stars show only superoutbursts and are sometimes classified as a separate class of WZ Sge type dwarf novae. One definition of a superoutburst would allow one to say that at least one U Gem-type dwarf nova showed a superoutburst: the prototype itself. Z Cams are particular in that during decline from outburst they get caught in a ‘standstill’, 0.7 mag below maximum, which can last from ten days to years.
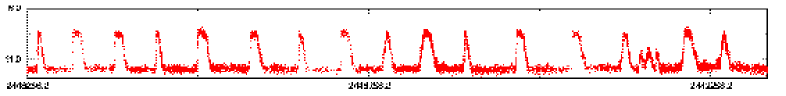
Normal outbursts have amplitudes of 2-5 mag and last 2-20 days. Their recurrence times are typically from days to years. As can be seen in Fig. 9 there are basically two types of normal outbursts: narrow and symmetrical and wide and asymmetrical. The bimodality of width distribution is a general property of normal outbursts (van Paradijs 1983). The uppermost panel of Fig. 9 shows that both types of outbursts have very similar amplitudes.
Superoutbursts have amplitudes brighter by 0.7 magnitudes, they last 5 times longer and their recurrence time is longer than that of normal outbursts. When both types, normal and superoutbursts, are present in a given system, superoutbursts are separated by a sequence of normal outbursts. When normal outbursts are absent, recurrence times are unusually long: 33 years in WZ Sge. Van Paradijs (1983) suggested that superoutbursts are a universal property of dwarf novae, assigning them to the class of wide outbursts. We know now, however, that this is not the case because the three types of outbursts – narrow, wide and superoutbursts – are observed to occur in the same systems (TU Men and U Gem, see Smak 2000 and references therein).
SU UMa star superoutbursts are characterized by the appearance of a “superhump”: a feature in the light-curve which is modulated at a period slightly longer than the orbital period. All SU UMa stars have periods shorter than 3 hours. Such systems have low secondary to primary mass-ratios and, therefore, large Roche-lobes around the primary (white dwarf). This suggests that the superhump is tidally induced. A popular model attributes the superhump to the 3:1 resonance operating in a local–viscosity driven disc (Whitehurst 1988, 1994; see Lubow 1994 for a review). The validity of this model (but not the relevance of the 3:1 resonance) has been recently, and rather convincingly, put in doubt by Kornet & Różyczka (2000). This would also cast doubt on the so-called tidal-thermal disc instability model (see e.g. Osaki 1996). We will discuss these and related problems in Sects. 5.4 and 5.5.
4.1 The “standard” model
First we will present the “standard” version of the DIM, i.e. the model in which heating is due only to local viscous dissipation and the mass-transfer rate is kept constant. In other words, in Eq. (3) and =0 in the boundary condition Eq. (30); . This version of the model was supposed to be able to reproduce outburst properties of U Gem type dwarf novae. In Figure 9 are shown two light-curves calculated for the presumed parameters of SS Cyg, the system whose observed light-curve is also shown in Fig. 9. Let us first deal with the lower-panel light-curve of Fig. 9. It is shown here for ‘historical’ reasons and also as a warning. This light-curve does not look like the SS Cyg light-curve but is reminiscent of light-curves observed in other systems. The sequence of several narrow outbursts followed by a wide, ‘flat-top’ outburst is reminiscent of SU UMa-type dwarf-novae (which will be discussed in Sect. 5.4). However, the form of this light-curve results purely from an incorrect boundary condition, which here assumes that the outer disc radius is fixed during the outburst cycle. This is incorrect, because the position of the disc’s outer radius is controlled by the tidal torque and in any case this radius is observed to vary (e.g. Paczyński 1965; Smak 1971, 1984a; O’Donoghue 1986; Wood et al. 1989b; Wolf et al. 1993; Harrop-Allin & Warner 1996). Since it represents an unphysical system, the lower panel of Fig. 9 should be forgotten, as should many if not all the numerous results which assume the same boundary condition.
The upper panel shows a light-curve calculated using the correct boundary conditions. Despite this (or maybe because of that) the result is not very satisfactory, as noticed by Smak (1999a) who used this figure from HMDLH to illustrate the deficiencies of the standard DIM. Why it took so long to arrive at this obvious conclusion is, one might hope, an interesting problem in the sociology of science. The standard model fails here at least on two counts (Smak 1999a, 2000):
-
•
The calculated light-curve shows a significant increase of the disc’s luminosity in quiescence, whereas in the observed light-curves this luminosity is constant (Fig. 9) or decreasing.
-
•
In the calculated light-curve the narrow outbursts have a much lower amplitude than the wide ones, whereas in the observed light-curves these two types of outbursts differ mainly in their duration and only very little in their amplitude (Fig. 9).
Clearly something must be changed in the model. Before trying to understand what must (and what may) be changed, let us look in detail at how the model works. Later we will see that one can find remedies for the second problem. The first is still with us and may require a drastic modification of the model.
4.1.1 The rise to outburst
Let us start with the state of the disc represented by the upper curve in Figure 17, the one that almost touches the critical line. This is the end of the quiescent interval of the outburst cycle. The quiescent disc had accumulated matter near the inner edge of the disc. This is where the surface-density profile will cross the critical line, triggering an outburst. In the local picture this corresponds to leaving the lower branch of the -curve. The next ‘moment’ (in a thermal time-scale) is represented in the lower panel (b) of Figure 10. This is when a large spike forms in the midplane temperature profile and when the surface-density profile is already above the critical line. The disc is undergoing a thermal runaway at cm. The midplane temperature rises to K. This raises the viscosity which leads to an increase of the surface-density. It is here that Eq. (25) enters into the game. If the increase in viscosity were due only to the rise in the temperature through the speed of sound (, Eq. (21)) the resulting outburst would have nothing to do with the observed ones.

We now have a spike in the density profile and a flat-topped temperature profile with steep gradients. Because of these gradients the density spike and the temperature gradients (heating fronts) will start to propagate. The detailed structure of a heating front will be discussed in Sect. 4.2.2. What is shown in Fig. 10 is a so-called ‘inside-out’ outburst, because the outburst starts in the disc’s inner regions and then propagates outwards. This concerns the main outburst; but since inside-out outbursts never start exactly at the inner edge there is always an associated outside-in outburst, as clearly seen in the temperature and density profiles of Fig. 10 (see also Fig. 14, where it is seen in the -curve). These short-lived outbursts cannot be observed in reality (in Fig. 14 this ‘outburst’ is invisible in the V - curve). One also should keep in mind that outside-in outbursts may start quite far away from the outer disc’s edge (see Sect. 4.4).
In our case (Fig. 10), the heating front reached the outer disc radius. Such an outburst corresponds to the large outbursts in Fig. 9. Smaller outbursts are produced when the front does not reach the outer disc regions. In an inside-out outburst the surface-density spike has to propagate against the surface-density gradient because in a quiescent disc , roughly parallel to the critical surface-density. Most of the disc’s mass is therefore contained in the outer regions. A heating front will be able to propagate if the post-front surface-density is larger than – in other words, if it can bring successive rings of matter to the upper branch of the -curve. If not, a cooling front will appear just behind the spike, the heating front will die-out and the cooling front will start to propagate inwards (the heating-front will be ‘reflected’, see Menou et al. 1999a).
The difficulty inside-out fronts encounter when propagating is due to angular-momentum conservation. In order to move outwards the -spike has to take with it some angular momentum because the disc’s angular momentum increases with radius (the specific angular momentum is Keplerian, which is a good approximation even in the front region, according to Ludwig & Meyer 1998). For this reason inside-out front propagation induces a strong outflow. In order for matter to be accreted, a lot of it must be sent outwards. That is why during an inside-out dwarf-nova outburst only of the disc’s mass is accreted onto the white dwarf. Another reason is that the propagation of the cooling front during the outburst’s decay also induces a strong outflow (see below).
4.1.2 The limit-cycle
All this can also be seen in Fig. 11, where we observe the ‘limit cycle’ which the local state of the disc undergoes during outbursts. The left panel
of this figure shows the situation well inside the disc; the right panel represents the disc’s outer regions. In both cases the path of the system in the plane looks different from what is often shown in schematic drawings found in the literature. There, the transition to the upper branch of the -curve is happening at constant (the downward transition to the lower branch is shown in the same fashion). The argument in favour of such a representation of the cycle undergone locally by the disc is that the thermal time-scale for temperature variations is much shorter than the viscous time-scale at which surface density changes. This is true, however, only in an equilibrium disc. Here, the transition to the hot state (upper branch) is due to the passage of a front, i.e. to the passage of strong temperature and density gradients. In such a case, Fig. 11 clearly shows that the two timescales are comparable.
The passage of the front is clearly seen: after leaving the the -curve the system moves towards high ’s. It also moves towards high temperatures, but the effect of the spike is clearly marked, especially on the left panel. Closer to the disc’s outer radius things are more complex. One can still see the passage of the spike in surface density, but now the ‘attraction’ of the critical point is stronger than it was at smaller radii. The temperature increases all the time, but only during the last stage of the transition towards the upper branch, in the wake of the front, does happen at roughly constant . With the distance to the outer disc radius decreasing, the value that reaches when the system arrives at the upper branch decreases: it becomes closer to . If it is lower than the heating front will not make it to the outer disc’s edge. In the right panel in Fig. 11 one front was not able to bring the system to the upper branch. Two other fronts died out before reaching the disc edge. That is why this panel shows different trajectories at each cycle. Closer to the center all the cycles are the same. Fig. 12 shows the limit cycle for an outside-in outburst close to the outer disc radius (Smak 1998). The rise-to-outburst path is here parallel to the unstable middle branch, which indicates that the process is occurring close to thermal equilibrium. The negative slope reflects an outflow (see Eq. 28). The maximum effective temperature which is reached in this case is very close to that corresponding to . Since things are happening close to the outer disc edge non-local effects are important: the variations of the tidal torque with viscosity and disc expansion strongly affect local disc behaviour.
4.1.3 Front propagation: inside-out vs outside-in
A sequence of fronts which do not reach the disc outer radius accumulates matter in the outer regions and in the end enables a front to travel through the whole extent of the disc. This produces a sequence of several narrow outbursts followed by one wide outburst. However, since such narrow outbursts have, inescapably, lower amplitudes, they cannot be the narrow outbursts observed in dwarf novae. They should be treated, as pointed out by Smak (1999a, 2000), as unphysical.
Outside-in outbursts have no problems with propagating. They travel down the surface-density gradient, so there is no danger that the post-front will not be larger than . We will say more about these type of outbursts in Sect. 4.4. In this case, after the heating front passage the disc’s luminosity is practically at maximum.
In an inside-out outburst the disc behind the front is hot and matter begins to diffuse inwards. Since most of the mass is located in the outer disc, this leads first to a slow increase in (and in accretion rate) as seen in Fig. 10 (see also Fig. 31). Locally, on the -curve, each ring, now in thermal equilibrium, moves to higher temperatures and higher surface-densities along the upper branch. In the light-curve this is seen as the rise-to-outburst’s maximum. In inside-out outbursts the rise to maximum is therefore slower than when the outburst is outside-in, and the light curves have a ‘rounder’ shape. We will come back to this in Sect. 4.4.4.
4.2 The outburst maximum
Near the brightness maximum the disc is everywhere in thermal equilibrium on the hot branch of the -curve. In most of the disc, except for its outermost regions, the accretion rate is constant. This part of the disc is well represented by a Shakura-Sunyaev (1973) solution.
The maximum accretion rate can be estimated as:
| (38) |
where is the orbital period in hours. To obtain Eq. (38) it was assumed that the surface density at the disc’s outer edge is close to the critical one (in reality, as discussed above ). Since at maximum the accretion rate in the disc is roughly constant one can use Eq. (69) to write . Assuming that at outburst maximum one obtains Eq. (38). Warner (1995a) estimated by assuming that the disc before outburst is filled up to the maximum mass () and calculated the same mass at outburst’s maximum assuming that the hot disc is described by a stationary Shakura-Sunayev solution. This gives a relation between and from which a formula for follows. The two formulae should be roughly equivalent. The one, published in Warner (1995a), suffers from misprints: e.g. the power of the orbital period should be ‘1.78’ and not ‘1.18’ as printed.
The observed relation can be obtained from Eq. (38) by using Smak’s (1989) calibration (see Warner 1995a for details).
4.2.1 The decay from outburst
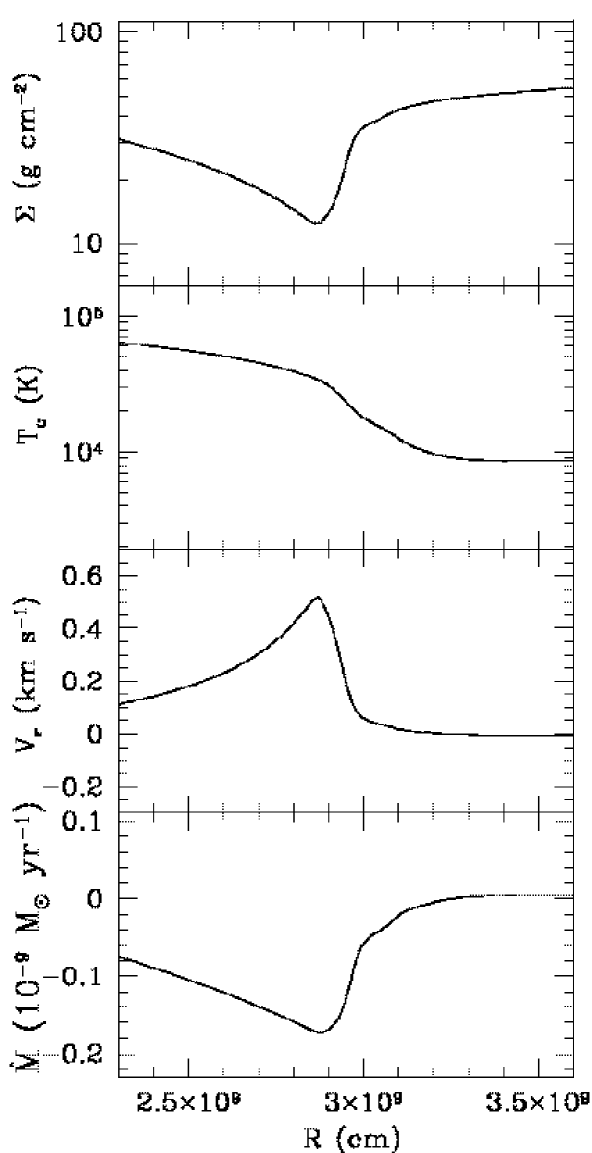
In the hot disc whereas the critical surface-density (Eq. 67). Therefore somewhere in the outer disc the surface density is close to the critical value (see e.g. Fig. 12). Since must now decrease, the outer disc will have to leave the -curve. On the plane this corresponds to the region where cooling dominates heating. Again a steep temperature gradient is created. The viscosity in the inner hot part of the disc is now higher than in the outer ring, where . This creates an outflow which allows the low-temperature region (a cooling-front) to propagate inwards. As in the case of an inside-out heating front, a cooling front propagates against the density gradient. This creates a strong outflow, as seen in Fig. 13. The outflow can also be seen ‘implicitly’ in Fig. 11, where, after getting through , the system follows for a while the middle branch of the -curve. This corresponds to an outflow because this branch of the -curve has a negative slope, which from Eq. (28) corresponds to a negative accretion rate.
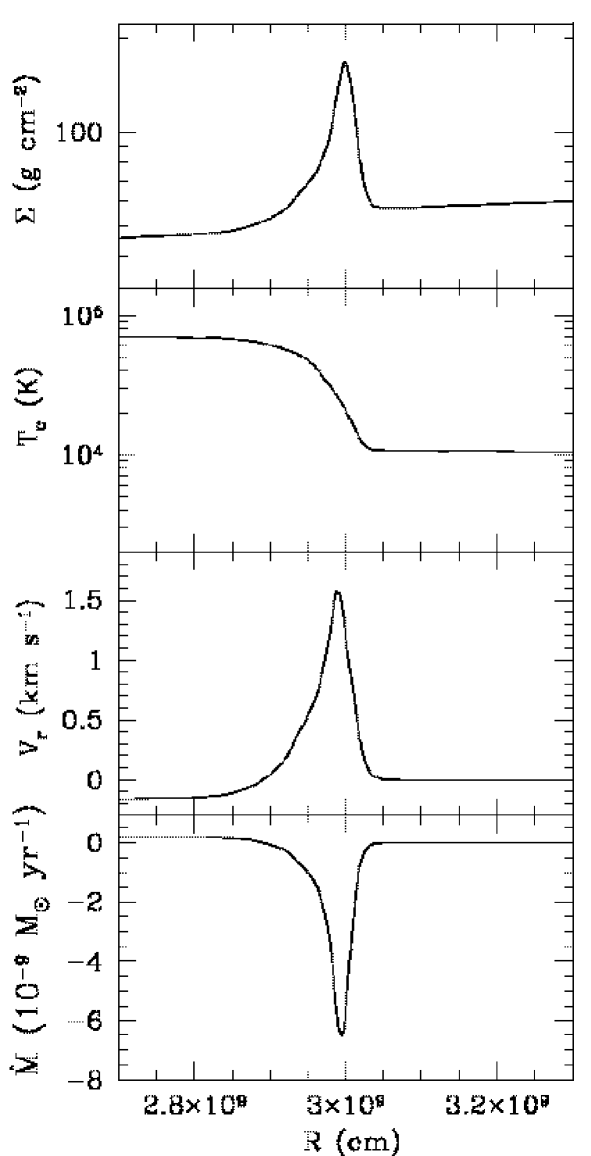
The outflow through the cooling front results in an increased surface-density and after the front passage (but not immediately, see Fig. 16) forms a profile parallel to . A cooling front will be able to keep propagating if the post-front surface density is lower than . If it is not, a heating front will form in the wake of the cooling front and new outburst will start (a “reflare”, see Sect. 4.3). This is a problem ‘inverse’ to the one encountered by an inside-out heating front. There, the danger was that the post-front will be too small for the front to propagate; here the surface density might be too large. In both cases the light-curves produced do not correspond to what is observed in real systems, so a way should be found of getting rid of these undesirable reflection features. The heating-front ‘reflection’ is more of a problem for dwarf-nova models, while ‘reflares’ are a deficiency of LMXBT models.


When the cooling front is allowed to propagate, as in the case shown in Fig. 10, it arrives at the inner disc edge, switching off the outburst. At the end of the cooling-front journey the whole disc settles down to a quiescent state.
4.2.2 Fronts
As pointed out by Meyer (1984), heating fronts in dwarf-nova accretion discs are similar to ignition fronts in combustion waves. Such ignition fronts propagate into unburnt matter (“cool state” in a disc) leaving behind burnt matter (“hot state”). Matter inside the front is heated on the burning time-scale and then by heat diffusion ignites the matter into which it is propagating. During the burning time heat diffuses over a distance covered by the front during this time, so the front speed can written as:
| (39) |
where is the coefficient of thermal diffusion. In accretion discs the the thermal diffusivity coefficient (which is the same as the kinematic viscosity coefficient) can be written as
| (40) |
where , so that the front speed is .
These heating-front properties were confirmed in detailed numerical calculation by Menou et al. (1999a) with some complications due to the fact that two values of must be used in the model of dwarf nova outbursts. The dependence on is, however, rather weak and the front velocity is of the order . Another ignition-front property is also confirmed by Menou et al. (1999). The width of the heating front is
| (41) |
as estimated by Meyer (1984). The thermal structure of the front proper (called a ‘precursor’ by Menou et al. 1999a) is dominated by viscous radial heat diffusion, which explains the success of the ignition front analogy presented above. One should not forget, however, that the term , describing radial radial energy transport, is rather uncertain, so the actual value of the front velocity depends on what is assumed about this term (Menou et al. 1999a). Especially the fact that could lead to a Rayleigh instability enhancing the radial energy transport (Lin, Papaloizou & Faulkner 1985). In their observations of EX Dra, Baptista & Catalán (2000) reported heating-front speeds a factor 2 slower that those predicted by Menou et al. (1999a).
Cooling fronts were subject to intensive discussions after Cannizzo, Chen & Livio (1995) had claimed that, according to their numerical calculations, the width of cooling fronts is and not as expected based on arguments similar to those used for heating fronts. Menou et al. (1999a), however, used the high resolution code of HMDLH to show that the front width is, as expected, , thus closing the discussion. The Cannizzo et al. (1995) paper had the merit of stimulating Vishniac & Wheeler (1996) (see also Vishniac 1997) to try to give an analytical description of cooling front propagation. The formula they got for cooling front propagation speed
| (42) |
where is the sound speed at the cooling front, is very useful if one wishes to understand the properties of the decay from outburst. The factor ‘2’ was added here following Menou et al. (1999a) who noticed that Vishniac & Wheeler’s (1996) assumption that gas velocity at the front is much larger than the front velocity is not confirmed by numerical calculations; the velocities are in fact comparable. Observations of the decay from outburst of the eclipsing dwarf nova IP Peg are consistent with Eq. (42). This formula is a good approximation of the cooling front velocity in what Menou et al. (1999a) call the ‘asymptotic regime’, reached after a rapid deceleration of the front occurring soon after its appearance. These authors note that this deceleration is a generic property of the DIM and could be an important test of the model. Recently, Baptista $ Catalán (2000) reported observing this feature during an outburst of EX Dra as well as cooling front speeds comparable to those predicted by Menou et al. (1999a).
However, the self-similar character of the decay from outburst found by several authors (Vishniac 1997; Menou et al. 1999a) is an approximation valid only for a restricted range of parameters, as discussed in the next section.
Most of the study of the cooling fronts and decay from outbursts was motivated by the desire to obtain ‘exponential’ light curves for LMXBTs in the framework of the standard DIM. As pointed out by King & Ritter (1998), however, such light curves are due to the disc’s irradiation which inhibits cooling front propagation (see Sect. 6) and models neglecting this effect are therefore only of academic interest. An additional motivation was provided by results of calculations in which the outer disc radius was kept constant. It is reassuring, however, that even erroneous motivations may give interesting insight into the structure of the DIM.
4.3 Reflares
We have already mentioned the difficulties encountered by some types of fronts when propagating in the disc. Both inside-out heating fronts and cooling fronts (which are always ‘outside-in’ and therefore have to move against the density gradient) may be stopped and ‘reflected’. Only outside-in heating fronts travel unhindered down the density slope.


The multiple reflections of heating and cooling front produce ‘reflares’, as shown, for example, in Fig. 15. Reflares are a natural property of the DIM. In particular, in a model in which fronts reflect indefinitely and produce only small amplitude variations of the disc luminosity instead of a dwarf-nova type light curve (see Fig. 1 in Mineshige & Osaki 1985). This is why different ’s must be used in outburst and quiescence. Some authors claim that the reflares they found are just numerical artifacts (e.g. Cannizzo et al. 1995). This is possible in low-resolution calculations, but high-resolution calculations by Menou et al. (2000) and DHL show that reflares are definitely due to physical effects even when the viscosity parameter is different on the high and low branches of the -curve. Menou et al. (2000) discussed the reflare problem and showed that the presence or absence of reflares depends not only on but also on the mass of the accreting object. It was claimed in this article that for a central mass of 1.2 M⊙ no reflares appear in the model while for a mass o 7 M⊙ reflares are clearly present. This mass dependence was explained by an ‘analytical’ model.
Fig. 15, which shows a light-curve (strictly speaking the accretion rate onto the central object as a function of time) for a mass of 1.4 M⊙, is in obvious contradiction with the conclusions of Menou et al. (2000). The reasons for this contradiction are very instructive: they show how prudent one must be when generalizing results of particular numerical calculations and they also show the limited value of ‘analytical’ arguments in dealing with the physics of time-dependent accretion discs.
The argument presented in Menou et al. (2000) begins with the correct statement that the surface density at the cooling front is (see Sect. 4.2.2 and Fig. 16)
| (43) |
Then, following Vishniac (1997), it is assumed that the cold, outer regions of the disc behind the cooling front are frozen during the cooling front propagation so that behind the front , where depends on the viscosity parameter and the mass of the accreting object . Menou et al. (1999a) obtained for a central mass M⊙, and for M⊙. Since the ratio of the ‘maximum’ to ‘minimum’ surface densities is (Eqs. 67 and 67)
| (44) |
one has
| (45) |
Therefore, for M⊙ the post-cooling-front surface density , and no reflares are expected, while for M⊙, the post-cooling-front surface density and one should expect the presence of reflares. Menou et al. (2000) show why and how depends on the mass of the accreting object: .
The problem with this argument is that, as noticed by Menou et al. (1999a), just after the front the post cooling-front density is not proportional to . This is clearly seen in Fig. 16 (upper panel: just behind the front there is small region with a slope flatter than . (This region grows after the passage of successive reflares. A better approximation of the post-front surface-density distribution would be rather: (instead of ) so that in general there is always a radius for which behind the cooling front becomes greater than and reflares should always be present if the range of radii considered is wide enough. Menou et al. (2000) did not see reflares in the case of low-mass accreting objects because they used a code which included strong evaporation (see Sect. 6) of the inner disc during decay from outburst. As a result the inner disc radius was receding fast enough to prevent a reflare (see Sect. 6).
In conclusion: the Menou et al. (2000) argument is not false, it is incomplete: the presence of reflares depends not only on the values of and the central mass, but also on the disc’s radial extent. Dwarf-nova discs which typically extend from cm to a few times cm are not prone to the presence of reflares, if the hot to cold ’s ratio is large enough ().
The reflare problem is not just a boring technical question. Reflares are a fundamental part of the DIM but they seem to be observed neither in dwarf novae nor in LMXBTs containing neutron stars or black holes. ‘Kinks’ in the light-curves of black-hole LMXBTs or ‘secondary’ outbursts seen in both dwarf-novae and LMXBTs (Kuulkers, Howell & van Paradijs 1996) look totally different. One must, therefore get rid of them for the DIM to work when applied to observed systems. For dwarf novae this implies a moderate ratio of hot to cold ’s but for LMXBTs this ratio would have to be at least 20, but even then this will help only if the inner disc were truncated (Menou et al. 2000). Luckily, discs in LMXBTs are strongly X-ray irradiated (van Paradijs & McClintock 1995), which implies lower post-front surface densities and less chance for reflares to appear, as showed by DHL (see Sect. 6).
4.4 “Inside-out” and “outside-in” outbursts
After each outburst the disc has to fill up with matter before erupting once more. As discussed in Sect. (4.3), after the passage of the cooling front the surface density settles down to a value proportional to , i.e at the beginning of quiescence the surface-density distribution is roughly parallel to the critical densities (see Figs. 17 and 10).
What happens next depends on the mass-transfer rate, the size of the disc and viscosity (i.e. ).
Figure 14 shows inside-out (left) and outside-in (right) outbursts for the same system in which only the mass-transfer rate is different. Low mass-transfer rates produce inside-out outbursts whereas outside-in outbursts correspond to high mass-transfer rates. This can be easily understood in terms of the characteristic time-scales of the accretion processes at the disc’s outer edge. One has to consider two processes: accumulation and diffusion of matter. If the accumulation time is shorter than the (viscous) diffusion time, matter will accumulate near the disc’s outer edge and the resulting excess of surface density will trigger an inward propagating outburst. This is an “outside-in” outburst. In the opposite case matter will never be able to accumulate at the outer disc regions and will diffuse inwards. Since in a quiescent disc the accretion rate decreases steeply with radius matter will have to accumulate somewhere, and eventually cross the critical () line, starting an “inside-out” outburst. This case is illustrated in Fig. 17, which shows two surface-density profiles: one just after the end of an outburst and the second at the start of a new, inside-out outburst.
We may suppose that the faster one feeds the disc (the higher the mass-transfer rate), the shorter the time to accumulate matter where it is fed to the disc, so the fact that outside-in outbursts occur at high transfer rates is not surprising. However, observations show (or at least suggest) the presence of outside-in outbursts in systems with quite low mass-transfer rates, so it would be useful to understand what is meant by ‘lower’ and ‘higher’ in this context.
Osaki (1995) estimated the accumulation time to be
| (46) |
where is the mass-transfer rate from the secondary. is the time it takes to accumulate matter up to the critical density at which an outburst must begin. It is assumed that the width of the torus in which matter accumulates is governed by viscous spreading, i.e. (it is this assumption which gives in ).
The diffusion (‘drift’) time can be estimated by using the standard accretion-disc diffusion equation (Eq. (5.6) in Frank et al. 1992). The diffusion time is then defined as
| (47) |
(e.g. Smak 1993; Osaki 1995a). We are interested in the time in takes to produce an outburst after the disc had settled down to a quiescent state. This is, therefore, the time it takes to form (or to reduce) by viscous diffusion a surface density excess bringing close to . Following Osaki (1995a) one can then write
| (48) |
where , , is the power-law index in () and (typically ), is the quiescent surface density (see Sect. 4.3). In discs with short radial sizes the quiescent surface-density profiles are much flatter than and these assumptions about , etc. are no longer valid (see Fig. 19) .
From Eqs. (46) and (48) one obtains a condition for
| (49) |
One can now use Eq. (28) to write , where is the accretion rate corresponding to (Eq. 69). Therefore, the criterion for outside-in outbursts (Eq. 49) becomes simply
| (50) |
which seemed probable from the very beginning. Indeed, since in quiescence the accretion rate everywhere in the disc is lower than the critical accretion rate , fresh matter arriving at higher than the critical rate will have difficulty diffusing inwards and will tend to accumulate at the outer edge. This simple picture seems to work quite well in this case. Of course in real systems things will be more complicated because matter is never brought exactly to the disc edge, etc.
In terms of the system’s parameters the criterion for the occurrence of outside-in outbursts is
| (51) |
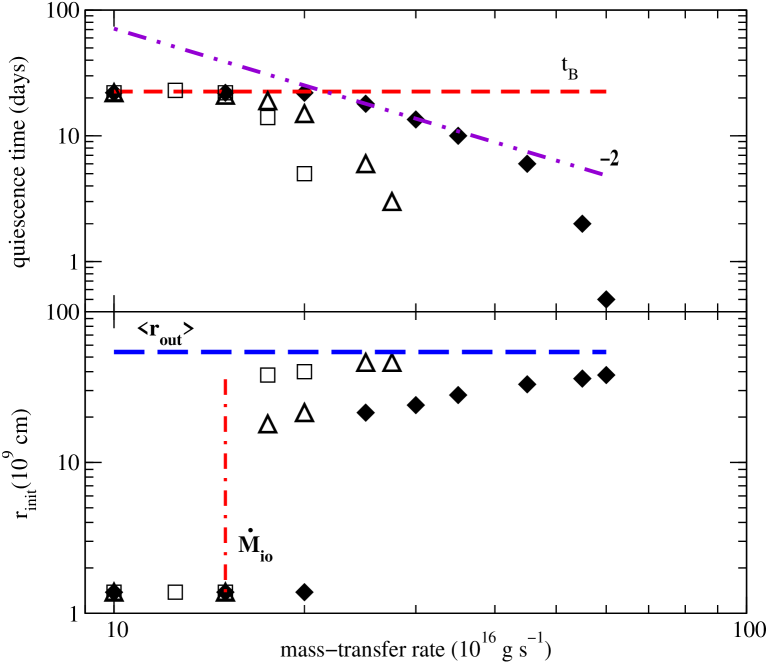
where we neglect the very weak dependence. The critical mass- transfer rate depends very strongly on the disc radius, so to obtain outside-in outbursts also for a low mass-transfer rate (as required by observations) one needs to have small discs. The problem is illustrated by the Figures 18 and 19 from Buat-Ménard et al. (2001a).
For the moment we are interested only in the lower panels of these figures; we will discuss the upper panels in Sect. 4.5. Figure 18 shows the radius at which the outburst begins as a function of the mass-transfer rate. The binary parameters are those of SS Cyg. Three model predictions are shown: the standard DIM, the DIM plus stream-impact heating and the DIM plus stream-impact and tidal-torque heating. It appears that Eq. (51) slightly underevaluates the value of the critical mass-transfer rate at which outbursts change the direction of propagation. The transition is quite neat: the inside-out outbursts all begin at cm (very close to the inner radius fixed at cm) whereas outside-in outbursts begin from 2.14 to cm depending on the mass-transfer rate. This is very close to the outer disc radius. Heating of the external disc lowers the critical mass-transfer rate and causes the outside-in outburst to start closer to the outer edge. The reason is that additional heating of the outer disc regions lowers the value of and and shortens the distance between them as can be seen in Fig 8. This makes it easier for thermal instability to be triggered close to the outer disc radius, where the effects are strongest. It also stabilizes the disc for mass-transfer rates that are lower than in the standard DIM: in Fig. 18 the highest mass-transfer models are close to the stability limit.
Additional heating reduces the critical mass-transfer rate to g s-1, which is 1.4 times smaller than in the standard case; this is reasonably close to estimates of SS Cyg mass transfer rate g s-1 (e.g. Patterson 1984). An increase of this mass transfer rate by a factor 2 – 3 is therefore sufficient to provoke outside-in outbursts.
Short period systems require special attention. In two of these systems OY Car (Vogt 1983) and HT Cas (Ioannou et al. 1999), outside-in outbursts have been directly observed (see Sect. 4.4.2). The mass-transfer rate in OY Car is g s-1, (Wood et al. 1989b) and a similar or lower rate is expected in HT Cas and most of the other short period systems (Baraffe & Kolb 1999). This requires very small discs radii if one wishes to obtain outside-in outbursts. Fig. 19 from BMHL shows the transition between inside-out and outside-in outbursts for disc with cm around a 0.8 M⊙ white dwarf. Here the transition is at g s-1 for the standard DIM and slightly lower when heating by the stream is added. Dissipation of the tidal torques is not included as it should be negligible in a disc whose radius is well inside the tidal radius (see BMHL for details). In this case the transition between inside-out and outside-in is less marked than for larger discs. This is caused by the reduced extent of the disc () and the fact that the disc structure everywhere feels the influence of the boundary conditions (see BMHL).
The disc radius in quiescence is cm in OY Car (Wood et al. 1989b) and cm in HT Cas (Horne, Wood & Stiening 1991) so the results presented in Fig. 19 are quite satisfactory, especially if one keeps in mind the simplistic way that stream heating is treated. The disc radius in OY Car was estimated when the system was in quiescence after a superoutburst and before a normal outburst. During the supercycle the mean disc radius radius increases and during a superoutburst reaches the 3:1 resonance radius (see Sect. 5.4). It would be interesting to see if the type of normal outburst changes during the supercycle. The disc radius in the outburst observed by Vogt (1983) seems to be similar (Rutten et al. 1992) to the one determined by Wood et al. (1989b).
Ichikawa & Osaki (1992) preferred to assume a special form of in order to get rid of inside-out outbursts at low mass-transfer rates. It is possible that has this desired form but since no physical argument is given to explain why and when such form should be assumed this solution does not seem to be very satisfactory.
4.4.1 Inside-out outburst in LMXBTs
LMXBTs have orbital periods longer than 4 hours. Their mass transfer rates are estimated to be less than g s-1 (van Paradijs 1996; Menou et al. 1999b) so that according to Eq. (51) in all cases one can expect only inside-out outbursts. This is confirmed by the models (Menou et al. 2000; DHL).
Because of an observed ‘X-ray delay’ the 1996 outburst of GRO J1655-40 had the reputation of being of the outside-in type (Orosz et al. 1997). However, the successful model of the rise of this outburst by Hameury et al. (1997b) clearly shows an inside-out outburst. Because in this model the disc is truncated the outburst starts rather far from the black hole (and ‘outside’ the inner ‘hole’) but at the inner edge of the cold disc, and a heating front propagates outwards. In this model the inner hole is filled by an ADAF (Abramowicz et al. 1995; Narayan & Yi 1995). So if this model is correct this should be an inside-out outburst. A 3-day delay between light and X-rays was observed at the rise to outburst of the neutron-star LMXBT Aql X-1 in August 1997 by Shahbaz et al. (1998). These authors call this event an ‘outside-in’ outburst, but if the same reasoning as for GRO J1655-40 is applied to this system it is clear that what they observed was an inside-out outburst.
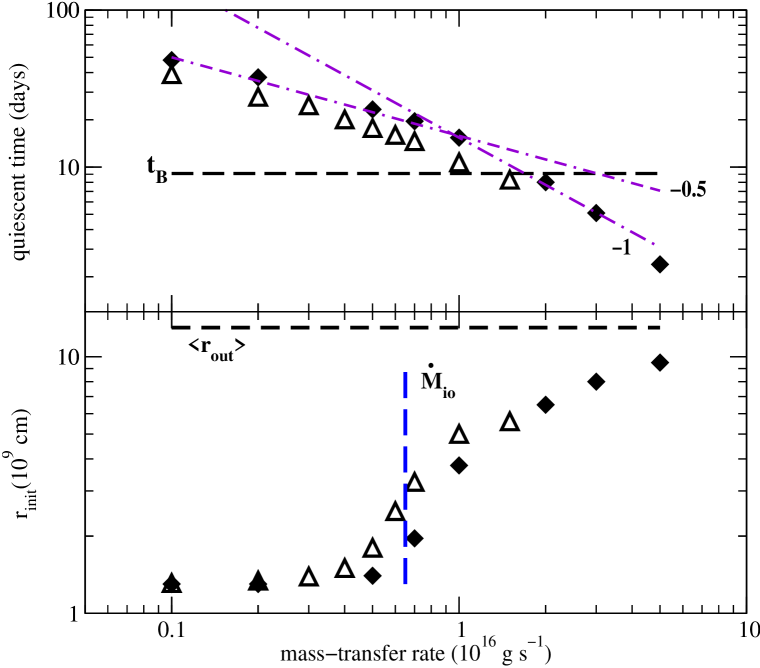
This leads to the question: how can we tell from observations that an outburst is outside-in or inside-out? Three indicators have been used in the literature:
-
•
The evolution of the eclipse profile during the outburst
-
•
The shape of the outburst’s lightcurve
-
•
The length of the “UV-delay”
We will now discuss these three methods.
4.4.2 Eclipse profiles
This method is the surest but by its nature is limited only to a minority of systems. It can also be useful, however, as a test for the other two methods, which can be applied, in principle at least, to all systems. Observations of eclipsing systems show where the outburst begins. Already in 1971 Smak observed an outburst of U Gem that began at the outer disc rim. A normal (i.e. not a superoutburst) of OY Car was also seen to start at the outer disc (Vogt 1983; Rutten et al. 1992). The same is true of a normal outburst of HT Cas (Ioannou et al. 1999), whereas outbursts of IP Peg (Webb et al. 1999) and EX Dra (Baptista, Catalán & Costa 2000) were seen to begin close to the inner disc edge. Webb et al. (1999) confirm in this case that a slow rise usually associated with inside-out outbursts (see below) is indeed observed in the IP Peg outburst, whose type is determined from the eclipse profiles.
4.4.3 Shapes
Sequences of inside-out and outside-in outbursts are shown respectively in left and right panels of Fig. 14. One can see that the two types of outbursts differ in the shapes of their light-curves. The inside-out outburst light-curves are fairly symmetrical: the rise is slow since at the outburst’s beginning only a small surface and little mass are implicated in the process. We will call such a shape a ‘type-B’ shape. The outside-in outbursts are asymmetrical: the rise is faster than the decay and there is a flat-top part just after the maximum. This shape is characteristic of outbursts in which a large surface and most of the disc’s mass take part in the outburst from the outset. We will call such a shape a ‘type-A’ shape.
This nomenclature relating to light-curve shapes is introduced to distinguish between the shape and the direction in which the outburst propagates, because in some conditions inside-out outbursts may have also ‘type-A’ shapes. This is possible when the inner disc is truncated. Such truncated discs seem to be necessary in LMXTBs (see Sect. 6) and they are often invoked in the context of dwarf novae and CVs in general. In particular if the inner disc is truncated at a sufficiently large radius an inside-out outburst will have a ‘type A’ shape as seen in Fig. 20, where such an outbursts is shown (solid lines). In this model the inner disc radius is variable, and its value is determined by an evaporation law (slightly different from Eq. (11), see Hameury et al. 1999 for details). In quiescence it is equal to cm, i.e to about 7 white dwarf radii. The outburst starts near the inner disc radius and propagates only outwards as there is nothing to propagate into in the other direction. Fig. 20 shows also two other models of outbursts for a disc extending down to the white dwarf surface. The inner part of such a disc is irradiated by the white dwarf (dotted line) and by both the white dwarf and the boundary layer between the disc and the white dwarf. The inner part of such a disc remains hot in quiescence, as suggested by King (1997), but contrary to King’s suggestion the DIM the predicts an optically thick accretion disc. Smak (1998) describes these outbursts as having rounded shapes typical of ‘type-B’. However, a look at Fig. 7 in Hameury et al. (1999) shows that this is true only of the light-curves representing the secondary outbursts which appear when the inner disc is irradiated.

Fig. 21, which will be discussed in more detail in Sect. 5.1 shows another example of ambiguous shapes. Despite their different shapes, both types of outbursts are inside-out. A closer look shows that for both types of outbursts the rise-time is the same, but neither of them could be described as having a ‘rounded shape typical of type B outbursts’, as Smak (1998) says about Fig. 20 (and Fig. 7 in Hameury et al. 1999). Also Fig. 25 shows two types of inside- out outbursts (see Sect. 5.3) neither of them really ‘rounded’.
Of course the use of the term ‘rounded shape’ may be a question of taste (as when applied to human bodies) if it is not quantified. In view of the variety of observed and calculated outburst shapes it is not clear that such a quantification would make much sense. Already in 1934 Campbell classified outbursts of SS Cyg into four types. However, each types contains, a variety of shapes (see Fig. 3.6 in Warner 1995a). In any case:“no two outbursts in a given [dwarf nova] are exactly alike” (Warner 1995a). As we will see in the next section, the ‘UV-delay’ also does not determine the outburst type unambiguously.
4.4.4 The “UV-delay”
In several dwarf-nova systems whose outbursts were observed simultaneously in the UV (or EUV) and in visual light, one could see a delay between the rise to outburst at short wavelengths and that at long wavelength, the visual-light flux was rising first (see e.g. Table 2. in Smak 1998 and reference therein). Such a delay is expected by the DIM (Smak 1984b). There sometimes an ambiguity in the meaning of the ‘UVs’. One certainly expects a delay in EUVs but practicaly none in the near UVs) . In the case of outside-in outbursts the heating of the outer disc regions is reduced as Fig. 12 shows, but since a large emitting area is available a significant increase in visual flux occurs very early. The UV flux will rise only when the temperature grows sufficiently high, which corresponds to the heating front arriving at the inner disc. This is especially true of the EUV flux, which can be emitted only very close to the white dwarf (in the ‘boundary layer’). In the case of inside-out outbursts things are more complicated. The heating front now forms close to the white dwarf but there, as discussed in the previous Section, the accretion rate is rather low at first. Also the emitting area is small. It is only after the arrival of the heating front at the outer disc that the accretion rate onto the white dwarf increases significantly. Then, however, the outer disc is already hot, so that also in this case the visual-light flux may begin to increase before the rise in the UV and a UV-delay can be expected. The observed UV-delays are between to day. The same range of UV-delays can be obtained in the standard DIM (Smak 1998).
It would seem, therefore, that there is no “UV-delay problem” in the DIM. It might then appear rather strange that this subject gave rise to many articles, debates and has been considered as one of the main difficulties plaguing the standard DIM. The reason was, as pointed out by Smak (1998), that most of the papers claiming that there is a UV-delay problem were using disc models with constant and too small outer disc radii. Such models produce a problem just by their unphysical assumptions. According to Smak there should be no UV-delay problem if one uses correct boundary conditions and large enough discs (large enough to correspond to radii expected from observations) and he produced a set of models to substantiate his point. However, for systems with large discs Smak’s models did not reproduce the UV-delay and the outside-in character of the outbursts. Thus the UV-delay deserves more discussion.
Let us look at the problem in more detail. First, the definition of the UV-delay is ambiguous, at least in practice. In principle one is concerned with the delay between the rise to outburst in visual and UV (or EUV) light; the delay in the rise and not in the maximum. It is easy to understand that in practice it is often difficult to decide when the rise to outburst in a particular wavelength begins. To see this it is enough to have a look at the beautiful (and important) EUV and optical observations of SS Cyg by Mauche and his collaborators (Mauche 1996; Mauche, Raymond & Mattei 1995). In Mauche (1996) two outbursts of SS Cyg are shown. An ‘anomalous’ 1993 outburst and a type A, 1994 outburst. The 1993 outburst has a typical ‘B’ shape and is anomalous in its length of rise to maximum: days. Because of this very slow rise it is difficult to determine the UV delay, or even if there is one at all. In Mauche et al. (1995) a 3-day delay is mentioned, but the most prudent statement by Mauche (1996), that the EUV ‘rose more quickly that the optical’, seems more appropriate. There is no doubt about the 1994 outburst: its typical A-type steep rise in both wavelengths shows a clear UV delay of 1 day. Therefore if one identifies ‘type A’ with ‘outside-in’ and ‘type B’ with ‘inside-out’, as Mauche does in his 1996 article, everything seems to be in order: a delay in the outside-in, (almost) no delay in the ‘inside-out’.
This is the problem posed by models presented in Smak (1998). Smak compares observations with his models, in which UV delays can be as long as 2 days. One of these observations is attributed to Mauche (1996) with a quoted (E)UV delay of 1 day. Smak’s model no. 16 gives a very similar delay, but this model corresponds to an inside-out outburst. The 1994 outburst, however, has the typical type-A shape attributed to outside-in outbursts. Therefore, although Smak is obviously right about the fact that correct models with large disc radii produce very long UV delays, he does not seem to be able to produce the right type of outburst for a system like SS Cyg. Indeed, he does not have models for type A outbursts for orbital periods larger than 4.2 hours. For this period one obtains an type A outburst for an outer radius of cm and an accretion rate of g s-1. The orbital period and radius are too short for SS Cyg but the mass-transfer rate is already too high. Hence, to produce type A outbursts in SS Cyg would require unreasonably high mass-transfer rates, as shown in Fig. 18, where (for cm) outside-in outbursts appear only for g s-1. This figure also shows that taking into account heating by the accretion-stream impact and tidal forces alleviates the problem and allows outside-in outbursts for g s-1 (Buat-Ménard et al. 2001a). This is still high, but if the alternating sequence of type A and B outbursts in SS Cyg is due to mass-transfer fluctuations, an increase of mass-transfer rate by a factor of 2-3 would allow type A outbursts.
Of course the mass-transfer rate in SS Cyg is not really known, and one could decide that since type A outbursts are observed, the mass-transfer rate must have whatever value is necessary for their occurrence. However, as mentioned above, a ‘type A’ shape is not in itself proof that the outburst is outside-in. There is enough disc surface available for the optical flux to rise quickly, whereas the EUV flux will start to rise much later, when the inner disc arrives close to the white dwarf’s surface, which happens in viscous time.
Finally, it appears that information about (E)UV and optical light curves is not sufficient as test a of the DIM. It must be complemented by hard X-ray observations. Recently Wheatley, Mauche & Mattei (2000) observed a SS Cyg outburst simultaneously in X-rays, EUV and optical. The outburst had the typical, asymmetrical type-A shape and there was a bona fide EUV delay. However, hard (RXTE) X-rays began to rise hours before the EUV. They were shut out when the EUV started to rise. This multiwavelength observation is not easy to reconcile with the ‘standard’ picture in which type-A outbursts are always of the outside-in type; it is a rather natural outcome of the truncated disc model. In this case the outburst rising close to the inner disc edge results in an enhancement of the accretion rate, which in turn increases the evaporation rate and thus the hard X-ray emission from the hot inner accretion flow.
4.5 Recurrence time
The accumulation time defined by Eq. (46) is the time spent in quiescence between outside-in outbursts. One must make the difference between the recurrence time (from onset to onset) and time spent in a quiescent state (from the end of an outburst to the onset of the next one), especially when the outburst duration is a significant part of the recurrence time. For typical parameters this time is
| (52) |
The quiescence time obtained with this formula is a very good estimate of the quiescent duration in the outside-in outburst cycle shown in Fig. 14.
Eq. (52) is valid as long as (estimated at the outer disc radius). When the mass-transfer rate is too low or the outer radius too large for this inequality to be satisfied the quiescent time will be given by the diffusion time defined by Eq. (48). This is the quiescence time for an inside-out outburst because it is the time it takes to build up a surface-density excess (with respect to the quiescent ) that will reach the critical surface density. Now the relevant radius is not the outer disc radius but the radius where a density excess forms. Since the diffusion time decreases with distance to the center, this radius will be, in general, close to the inner disc edge. From Eq. (48) one obtains a quiescence time (between inside-out outbursts)
| (53) |
This time is independent of the mass-transfer rate as one should expect of a diffusion time. Fig. 18 illustrates this property of the quiescence time of inside-out outbursts (see also Ichikawa & Osaki 1994). Figure 19 shows, however, that Eq. (53) is only an approximation, valid only for discs with . In this case most of the disc’s structure is affected by the boundary conditions and the assumptions used to derive Eq. (53) do not apply. We will discuss this in more detail in Sect. 4.5.1. Outbursts of irradiated discs in LMXBTs also fail, in general, to follow Eq. (53) as discussed in detail in Sect. 6.
Menou et al. (2000) used a different formula for the quiescence time (recurrence time in their case, since in LMXBTs they consider the duty cycle is very short), using the effective instead of the midplane temperature. Their formula is an upper limit for the quiescence time because the factor is not taken into account. This corresponds rather to a uniform growth of surface-density. In the case of small truncated discs where the profile is flat, especially if they were irradiated during outburst (see Fig. 34), a formula without the ‘slope’ factor can be useful for comparisons with model calculations. The drawback of the formula used by Menou et al. (2000) is its very strong dependence on the effective temperature.
4.5.1 Very long recurrence times
For the parameters of U Gem-type dwarf novae, quiescence times given by Eqs. (52) and (53) are very close to those calculated in the models and, luckily, close to the observed ones. Problems arise when one wishes to make a DIM model of long recurrence times systems as, for example WZ Sge (Smak 1993; Osaki 1995a). The recurrence time for this system is years. In this case the difference between quiescence and recurrence time is not important. It is clear from Eq. (53) that the DIM will give such long recurrence time only if is much lower than the used in the standard approach; the value of the viscosity parameter would have to be to give a recurrence time of about 30 years. This conclusion about the very low value of is confirmed by a second argument (Smak 1993; see also Hameury et al. 1997) which we will now present.
The mass in the disc can be estimated if we assume that the quiescent disc just before the outburst is filled up to the critical surface density. The mass (the maximum disc mass) is
| (54) |
(see Eq. (67)). The mass transfer rate in WZ Sge is estimated to be g s-1, a value expected at such a short orbital period ( 80 min). The outer disc radius is cm and the white-dwarf mass M⊙ (see Lasota, Kuulkers & Charles 1999 and references therein). The quiescence (‘recurrence’) time can be defined as the time it takes, after an outburst, to refill the disc up to the critical level. Therefore:
| (55) |
where the fraction of the disc’s mass lost during outburst is and is the accretion rate at the disc’s inner edge.
Since in the standard DIM , getting the observed recurrence time for WZ Sge requires very small viscosity parameter in quiescence: . In the standard case , so that the required value of () would be very small indeed.
WZ Sge is very special: it shows only superoutbursts. Its superoutbursts are also special: they last more than a month whereas usual superoutbursts of SU UMa systems last for about two weeks. Once more this could suggest very low ’s in quiescence. The duration of the outburst can be estimated as (Hameury et al. 1997)
| (56) |
where we took g s-1 (Smak 1993). Therefore, to obtain a duration of days, one needs , if . Finally, an equivalent argument shows that since for the maximum mass of the disc is g while was accreted during the outburst, either or mass was added to the disc during the outburst. This last possibility means in practice that during the outburst the mass-transfer rate increased to a value close to , i.e. by more than two orders of magnitude.
WZ Sge outbursts pose two problems: the recurrence time and the outburst duration are much too short when calculated in the standard DIM. Both problems can be solved by assuming that for this system the viscosity parameter in quiescence is much lower than in other dwarf-nova discs. We will discuss the quiescent disc viscosity problem in Sect. 5.5. Even with these small ’s not all problems are solved: one must still explain the unusual duration of the (super)outburst and its ‘tremendous’ amplitude. These two properties of WZ Sge cannot be explained by the DIM. The tidal-thermal instability model (see Sect. 5.4) is more successful (Osaki 1995a, 1996).
There is another possibility. As suggested by Hameury et al. (1997, see also Lasota, Hameury & Huré 1995) the disc in WZ Sge could be truncated at a radius sufficiently large to make what is left of the disc stable or marginally stable. This, however, would solve only part of the problem, because although this would allow us to keep ‘normal’ ’s in quiescence, the outburst itself would be a flop (see Warner, Livio & Tout 1996). And no tidal-thermal process would help because there is simply not enough mass in the disc. If one wishes to keep not extravagantly low ’s one must add mass to the disc during outburst as proposed by Hameury et al. (1997).
The secondary star in WZ Sge is a very low-mass cold star () K but during outbursts it gets heated up to K (Smak 1993). The irradiation flux, 1000 times larger than the star’s intrinsic flux must influence the rate at which matter is transfered. We will discuss the secondary’s irradiation effects in Sect. 5.3. Here it suffices to mention that the increase of mass-transfer rate by a factor of 100 that would be required in WZ Sge is not unreasonable as shown in Hameury et al. (2000).
It is difficult to decide at present what is the solution of the WZ Sge puzzle. On the one hand the fact that in WZ Sge g is equal to the mass accreted during outburst speaks strongly in favour of the DIM, and hence in favour of very low ’s (as pointed out by A.R. King - private communication); on the other, there are reasons independent of the dwarf-nova character of WZ Sge for supposing that its quiescent disc is not an accretion disc at all, but a magnetically controlled (by the white dwarf’s magnetic field) flow (Lasota, Kuulkers & Charles 1999). In such a case the quiescent “disc” would be stable (as originally proposed by Lasota et al. 1995). The outbursts would occur only when an upward fluctuation of the mass-transfer rate reconstructs the disc. The idea that dwarf nova systems become stable close to the CV’s minimum period (thus ceasing to be dwarf novae) may help to solve the discrepancies between evolutionary model predictions and observations (Baraffe & Kolb 1999). Models predict a CV minimum period at min while the observed minimum is at min. Also an excess of systems with the minimum orbital period is expected but not observed. Mass-transfer rates at short periods ( g s-1 ) should be such that all CVs harbouring full fledged accretion discs should be unstable with respect to the dwarf-nova instability. Such faint systems can be identified only if they undergo substantial outbursts if not they would be ‘invisible’.
Because of the very long recurrence times of LMXBTs a similar problem arises. Similar but not the same, because in this case there is enough mass in the disc to account for the mass accreted during the outbursts. Also disc irradiation allows for longer recurrence times. We will discuss this problem in Sect. 6.
5 The generalized DIM
5.1 Bimodality of outburst duration: a solution
As mentioned at the beginning of Sect. 4, outburst durations (widths) fall into two classes: short (narrow) and long (wide). (Superoutbursts are different from long outbursts, e.g. Warner 1995a; Smak 2000, and will be discussed in Sect. 5.4). The bimodality is best seen in SS Cyg. It is interesting that the article by Bath & van Paradijs (1983) in which this effect was analyzed was devoted to the support of the mass-transfer instability model and to a critique of the DIM. Nowadays the bimodality of SS Cyg and co. outbursts is still seen as the DIM’s weakness, and mass-transfer fluctuations are called at its rescue (Smak 1999a, 2000, Hameury et al. 2000). However, nobody any longer believes in the mass-transfer instability model. The bimodality was observed in over a dozen of U Gem and Z Cam type stars (Warner 1995a and references therein). It seems that no bimodality of normal outbursts was observed in SU UMa stars (the exception being TU Men, which has the longest orbital period among SU UMa stars: the only such star above the ‘period gap’).
As mentioned before, the main deficiency of the DIM is its inability to reproduce a sequence of alternating narrow and wide outbursts with roughly the same amplitude. If one could superimpose the two panels of Fig. 14 one would get something close to the required result. Of course these figures cannot be superimposed; they represent models in which the mass-transfer rate differs by an order of magnitude. Varying the mass-transfer rate by a factor of 10 would not give the right result. But mass-transfer variations could help, as shown by Smak (1999a).
The i1dea is to repair what the middle panel of Fig. 9 shows: the narrow outbursts result from heating fronts unable to reach the outer disc regions. In his numerical experiments Smak used a factor of 2, instant enhancement of the mass-transfer rate. As a result he obtained a sequence of outbursts of the same amplitude but also of the same duration. To obtain wide outbursts Smak (1999a) used ‘major’ mass- transfer rate enhancements which brought the disc to a steady state. We will see that a variant of this idea explains the standstills of Z Cam stars. It could also produce SS Cyg type wide outbursts but the width of the outburst would be given by a ‘clock’ in the mass-losing star. There is nothing wrong with such a solution: after all, the duration of Z Cam stars standstills is supposed to be determined by such a clock. But here a different solution is possible. In fact several solutions, all involving mass-transfer fluctuations, are possible.
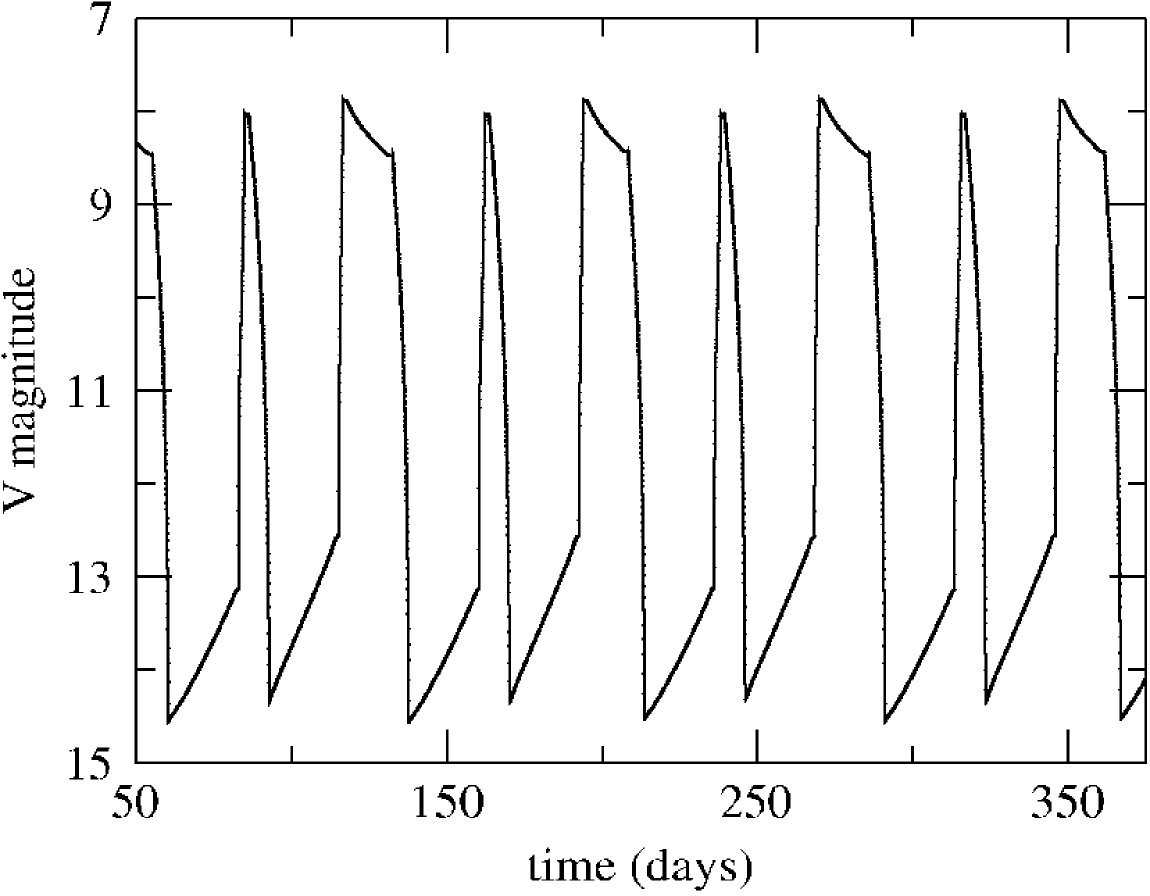
We shall see in Sect. 5.3 how mass-transfer fluctuations treated in a slightly more sophisticated way than Smak’s may give narrow and wide outbursts without assuming enhancements to bring the disc to a steady state.
Here, however, we will present a different although related model. BMHL showed that including the heating of the outer disc by tidal torque dissipation and by the stream impact naturally produces a sequence of narrow and wide outbursts for a rather narrow range of mass-transfer rates , which depend on the orbital period. They are close to the values dwarf novae are supposed to have above the period gap ( hr) but much larger than the secular mass-transfer rates of short period systems such as SU UMa stars. At hr g s-1 and it increases to g s-1 at hr.
Fig. 21 shows an example of a sequence of narrow and large outbursts for a system with SS Cyg parameters; g s-1. Only tidal-torque dissipation is taken into account. Including heating by stream impact reduces by . Outer disc heating helps inside-out propagating heating-fronts to reach the outer rim. As explained in Sect. 4.2.2 heating fronts get reflected when they cannot bring the surface density above . Heating by the stream and tidal torques lowers the value of this critical surface density, which allows the fronts to reach the outer rim and all the outbursts have a decent maximum brightness. The width of the outburst depends on the mass-transfer rate. For only narrow outbursts are present while in the opposite case only wide outbursts appear.
Long outbursts are slightly brighter than the short ones; a property observed in real systems (Oppenheimer et al. 1998). Near the peak of the outburst, the outer radius increases and with it the tidal dissipation. The tidal dissipation lowers the value of so it takes longer for the disc to empty down to the critical density where a cooling front will start to propagate shutting off the outburst. Outbursts therefore last longer than in the standard case and have the characteristic “flat top” shape.
Narrow outbursts are always of the inside-out type, whereas wide outbursts can be of either type because the critical mass-transfer rate above which they occur . In Fig. 21 all outbursts are inside-out, but if moderate (factor 2–3) fluctuations of the mass-transfer are present, even at outbursts will be of both propagation-direction types because is usually very close to . For example for the binary parameters of SS Cyg g s-1 while g s-1 .
Including the heating by tidal-torque dissipation and stream-impact heating in the DIM may therefore solve one of the main ‘unsolved problems’ (Smak 2000) of this model: the origin of the bimodal distribution of the outburst widths.
van Paradijs (1983) found a correlation between outburst width and the orbital period. The BMHL models reproduces this correlation for short outbursts but this is true for everybody . Their duration is independent of the mass transfer rate and depends on the disc’s size (i.e. on the orbital period) and (Smak 1999b). It is more difficult to reproduce this alleged correlation for long outbursts, since their duration is quite sensitive to , whose variation with the orbital period is not really known. And it is not well established, as (i) the sample is small, and (ii) the correlation may result in part from the very definition of “long” outbursts: they must last longer than short outbursts, whose duration does increase with the orbital period (see above).
Moderate mass-transfer fluctuations play only a auxiliary role here: they are necessary to produce a sequence of inside-out and outside-in outbursts. A model combining both the additional heating effects and mass-transfer fluctuation has still to be calculated, but it will certainly give the desired result. Of course, one must always keep in mind that the way additional heating (especially by the stream impact) is included into the DIM is rather rough.
5.2 Z Cam stars

Z Cam stars are characterized by a ‘standstill’ phenomenon: the decline from normal outburst maximum is interrupted and the luminosity of the systems settles down to a value mag lower than the peak luminosity (see Fig. 22. In some cases the magnitude difference is smaller (see Warner 1995a). Such standstills may last from ten days to years. After that the system luminosity declines to the usual quiescent state. Osaki (1974) interpreted standstills as stable phases of accretion in the framework of his disc instability model. In his disc-radius and mass-transfer rate diagram, Smak (1983) described these stars as an intermediate case between stable nova-like stars and unstable dwarf novae. Meyer & Meyer-Hofmeister (1983b) proposed that Z Cam stars are dwarf novae with a mass transfer rate that fluctuates about the critical rate. Also Lin et al. (1985) concluded that such moderate fluctuations of the mass-transfer rate can produce Z Cam-type light curves. Despite this early and generally accepted diagnosis no model has been able to reproduce the observed light curves of Z Cam stars. The latest attempt by King & Cannizzo (1998) was not very successful (for reasons explained below).

Buat-Ménard, Hameury & Lasota (2001b) showed that in this case the outer-disc heating by stream impact and dissipation of the tidal torques play an crucial role. Although as they show, it is possible to obtain Z Cam-type light curves in the framework of the standard DIM, the parameters required to obtain this result are not realistic; getting the often observed would require extreme fine tuning of the parameters or might not be possible at all.
Additional heating helps by lowering the critical parameters of the system. Fig. 23 shows the model applied to Z Cam. The results are very satisfactory. One obtains a magnitude difference between peak and standstill mag for a fluctuation of 30 % around g s-1. Having the outer disc heated by the stream impact and tidal torques bestows a bonus: narrow and wide outbursts which are observed in Z Cam (Oppenheimer et al. 1998). The duration of the narrow outbursts is 8 – 9 days, of the wide outbursts 16 – 20 days. The recurrence time is 32 days between narrow outbursts and 40 days between wide outbursts. These compare quite well with observed values: the average duration of the narrow outbursts is 10 days, of the wide outbursts 17. The average cycle length of narrow and wide outbursts is 23 and 31 days respectively.
This is not all. When one calculates Z Cam-type light curves with the standard DIM and requires the mass-transfer rate fluctuations to be moderate one always obtains outside-in outbursts. The reason is obvious: the mean mass-transfer rate has to be close to the stability limit, i.e. it is so high that only outside-in outbursts can take place (see Fig. 18) as e.g. in RX And. However, Z Cam stars show also inside-out (type B) outbursts e.g. in Z Cam and AH Her(Warner 1995a, Table 3.6)! This can be understood as the result of stream-impact and tidal-torque heating of the outer disc lowering not only the values of mass-transfer rates critical for stability - and for outburst type - (Fig. 18) but also the value of which makes possible also inside-out outbursts during the unstable phase of Z Cam systems even for moderate fluctuations of the mass-transfer rate. In Fig. 23 all the outbursts are of the inside-in type, which tallies with observations of Z Cam and AH Her.
The conclusion that in Z Cam is close to has interesting implications for the relation between Z Cam and U Gem stars (Osaki, private communication). Indeed, also for SS Cyg the two critcal accretion rates should be close and the transfer rate close to , so that a small increase of the average mass-trasnefr rate should transform SS Cyg into a Z Cam stars. This would be a confirmation of the old suspicion (Warner 1995a) that “all U Gem stars are unrecognized Z Cam stars”.
Therefore, modeling Z Cam-type outbursts by varying the mass-transfer rate around the value critical for disc stability is very successful when effects of heating by the stream-impact and tidal torque dissipation are included in the DIM. In Fig. 23 the outburst preceding the standstill is longer than observed which suggests that mass-transfer variations do not follow the prescription assumed in this particular model and the mass-transfer increase should begin around 5 days after the outburst maximum. (see Buat-Ménard et al. 2001b).
One should note that the range of parameters producing standstills is rather restricted. This is because close to the disc’s outer edge non-local effects of the outburst bring the surface density very close to the critical value (see Fig. 12), i.e. close to . Since at maximum the accretion rate in the disc is roughly constant . In Esin, Lasota & Hynes (2000) it is assumed that and deduced that an enhancement of mass transfer above will always produce a standstill brighter than the outburst maximum. This is not true because in reality the peak accretion rate is larger by a factor of about 2. Therefore, King & Cannizzo (1998), who obtained ‘standstills’ brighter that the outburst maximum, guessed correctly that they had increased the mass-transfer rate by an amount too large to get a Z Cam-type standstill (they increased the mass-transfer rate by a factor 6).
5.3 Irradiation and fluctuations
It seems that some of the basic outburst properties of U Gem and Z Cam type dwarf novae can be reproduced by the DIM if effects of outer disc heating are taken into account and if moderate fluctuations of the mass- transfer rate occur during the outburst cycle. These fluctuations can be due to various effects. The stochastic fluctuations leading to the bimodal distribution of outburst duration and heating-front propagation direction could be due to stellar spots (e.g. Livio & Pringle 1994). This could also be the origin of the fluctuations generating Z Cam behaviour. Not much is known about these stellar spots. Stellar spots might be responsible for the low states of AM Her and other magnetic systems (Hessman, Gänsicke & Mattei 2000) but contrary to the assertion by Schreiber et al. (2000) mass-transfer fluctuations in dwarf-nova systems cannot be of the same type, as shown by BMHL.
Another type of mass-transfer fluctuation (enhancement) is due to irradiation of the secondary during the dwarf-nova outburst, as argued by Smak (1996,1999a,2000 and references therein; see also Hameury et al. 1997). Secondary stars in dwarf-nova binaries are observed to be irradiated by the accretion flow (the irradiating source is usually called the “boundary layer”) and the resulting enhancement of the mass-transfer rate is observed as a brightening of the ‘hot spot’ where the stream of transferred matter hits the disc rim (Smak 1996). Also Warner (1998) has suggested that a large variety of observed dwarf-nova outbursts could be explained by the DIM if this model included effects of irradiation of both the secondary and the inner disc.
The importance of the irradiating flux depends on the binary parameters. Smak (2000) plotted the ratio of the mean irradiating to the secondary’s intrinsic flux for several dwarf novae with well established properties. For dwarf novae not showing superoutbursts this ratio is less than 10, while dwarf novae with superhumps (which we deliberately do not call ‘SU UMa stars’ for reasons that will be clear in a moment) have much larger values . For WZ Sge the ratio may be larger than (Smak 1998). It is therefore clear that in superoutburst systems irradiation of the secondary must play a crucial role.
U Gem, the prototypical dwarf nova, exhibited a very long (45 days)large amplitude outburst in 1985 (Mattei et al. 1987; Mason et al. 1988). Applying Eq. (56) to U Gem, one gets the maximum duration of an outburst in this system:
| (57) |
Contrary to WZ Sge, U Gem shows mainly normal outbursts with a recurrence time of 100 days, so that cannot be smaller than 0.01; in fact it should be greater (e.g. Livio & Spruit 1991). Therefore, could never be as high as 45 days. This means that the total amount of mass accreted during this very long outburst is larger than the mass of the disc in quiescence; this is possible only if the mass transfer rate from the secondary has increased to a value close to the mass accretion rate onto the white dwarf (see Sect. 4.5.1). Such an increase of the mass transfer rate is very likely caused by irradiation, since U Gem has a borderline ratio (Smak 2000).
The large outburst of U Gem is not usually called a ‘superoutburst’, because it did not exhibit the ‘superhump’ characteristic of superoutburst light-curves of SU UMa stars. The period of superhumps is a few percent longer that the orbital one. Superhumps are believed to result from disc deformations due to a 3:1 resonance between the disc flow and the binary motion (Whitehurst 1988, Whitehurst & King 1991; Hirose & Osaki 1990; Lubow 1991,1994). This resonance is possible only if the mass ratio (secondary/primary) is (see e.g. Frank et al. 1992). For U Gem (Friend et al. 1990) so no superhump is expected, nor was one observed.
Is a superhump a necessary ingredient of a superoutburst? Osaki (1989, see 1996 for a review) and his collaborators answer ‘yes’. They generalized the DIM, adding a tidal instability to the original thermal thus creating the tidal thermal instability model (TTI) which would apply to SU UMa stars. In the TTI the mass-transfer rate is assumed to be constant during the whole cycle of normal outbursts and superoutbursts. Vogt (1983) and Smak (1984c), however, suggested that superoutbursts result from mass-transfer rate enhancements. Osaki (1985) proposed a model according to which these enhancements are due to irradiation of the secondary by the accretion flow. In these models the superoutburst was supposed to be due an irradiation-triggered instability of the secondary. Hameury et al. (1986) showed that this not possible in a binary in which the accreting body is a white dwarf. The later evolution of the respective opinions on this subject is quite interesting: Osaki devised the TTI model while Hameury and the author of this review studied the role of irradiation of the secondary in various classes of dwarf nova stars (e.g. Hameury et al. 2000).
In the next section we will discuss SU UMa stars and superoutburst models.
5.4 SU UMa stars
SU UMa stars are dwarf novae having superoutbursts. This is the traditional definition; Warner (1985a) says that the current “operational definition” of SU UMa stars involves the further requirement that they exhibit superhumps. He adds that if dwarf novae are “ever found with superoutbursts lacking superhumps they will define a class of their own”. Therefore U Gem is not an SU UMa star, which is rather reassuring. With one exception all the SU UMa stars have orbital periods of less than 2.1 hours, i.e. below the CV period gap. The exception is TU Men whose period is very close to the upper edge of the period gap. Superoutbursts are mag brighter than normal outbursts; their light-curve at maximum has a form described as ‘flat-top’ or ‘plateau’. Superoutbursts last 5–10 times longer than normal outbursts.
In order to produce such superoutbursts in the standard DIM, two conditions must be fulfilled:
-
•
There must be enough mass in the disc for the outburst to last the required time
-
•
The cooling-front propagation must be withheld for most of the outburst duration to allow more mass
5.4.1 Tidal-thermal instability
These two conditions cannot be satisfied in the standard DIM. Osaki (1989), Ichikawa et al. (1993) (see Osaki 1996 for a review) satisfied this them by having a sequence of normal outbursts during which only a very small fraction of the disc mass is accreted onto the white dwarf. The disc mass therefore increases together with the disc outer radius. Once the outer radius reaches a critical radius , the tidal torque is increased by a factor of 20. This amounts to changing the value of in Eq. (5). Therefore, in the TTI model the superoutburst is due to a ‘tidal instability’. The critical radius is the 3:1-resonance radius and the ‘tidal instability’ is somehow related to the instability responsible for the superhump. The factor by which the tidal torque is increased is a free parameter, as is the radius at which the torque changes back to its normal value. In usual SU UMa stars this radius is assumed to be 0.35 , but in order to explain the properties of the rapid system RZ LMi, Osaki (1995b) has to assume that the tidal instability stops when the radius has shrunk by less than 10%. In the TTI model with the standard prescription according to which the viscosity parameters in the hot and cold states are constant normal outbursts are always inside-out for mass-transfer rates typical of SU UMa stars (see Sect. 4.4). Osaki and his collaborators prefer, however, to have outside-in normal outbursts and they use a radius-dependent (see below).
The TTI model is different from the standard DIM in two respects: it introduces a new free parameter whose value depends on the system to which the model is applied, and it modifies the viscosity prescription.
Vogt (1981) and Warner (1987, see also 1995a,b) found a correlation between the recurrence times of normal outbursts, and superoutbursts :
| (58) |
which means that the number of normal outbursts in a supercycle () is inversely proportional to its duration. Of course . According to Warner (1995b) d, whereas observations suggest the absence of normal outbursts for d. Eq. (58) reflects, therefore, an important property of the supercycle mechanism.
Osaki (1994,1995a,1996) argues that Eq. (58) has a simple interpretation in the framework of his tidal-thermal DIM. If the recurrence time for normal outbursts is given by Eq. (52) then . Since superoutbursts are supposed to occur when sufficient mass is accumulated in the disc and Eq. (58) follows. It was on this argument that Osaki based his ideas about the “SU UMa/WZ Sge connection” and in general about the relation between the mass-transfer rate and the dwarf-nova outburst type (1995, 1996). One should note, however, that this argument can also be used in favour of models in which superoutbursts are not produced by a tidal viscosity enhancement. It is sufficient for the normal outburst recurrence time to satisfy Eq. (52) and for the superoutbursts to result from mass accumulation (Hameury et al. 2000).
This apparently convincing argument, however, is based on very strong assumptions which, when looked at more closely, are not satisfied by the model. First, Eq. (52) is satisfied only by outside-in outbursts and as we saw in Sect. 4.4 it is very difficult to have this type of outburst for small discs and low mass-transfer rates typical of SU UMa stars. Osaki uses a form of the viscosity parameter specially designed to suppress inside-out outbursts (Ichikawa & Osaki 1992). However, in general, the relation is satisfied only for outside-in outbursts in systems with large discs (U Gem-type) as clearly seen in Figs. 18, 19, which considerably weakens the argument.
Second, and more important, Osaki’s argument assumes that recurrence times depend only (or mainly) on the mass-transfer rate. This is clearly not the case. It is clear that the recurrence time depends also on the viscosity parameter, as it is evident in Osaki’s explicit assumption about . In addition one should expect the recurrence times to depend on the binary parameters. In fact, Menou (2000a) showed that the recurrence times of both normal outbursts and superoutbursts are strongly correlated with binary component mass ratio. We will discuss his interpretation of this correlation in Sect. 5.5. Here it suffices to say that the existence of this correlation casts serious doubt on the interpretation of the correlation as reflecting a mass-transfer dependence of the recurrence times.

But the main deficiency of the TTI model is that it neglects a property of SU UMa stars and dwarf-novae outbursts in general: the observed enhancement of the mass-transfer rate during outbursts (Smak 1991,1995,1996,2000; Vogt 1983). This enhancement must change the sequence of events because it strongly influences the size of the disc. As indicated by Smak (1996) the weakest point of the TTI model is the sequence of events it predicts in the superoutburst: everything begins with the tidal instability leading to the formation of an eccentric disc and causing a major enhancement of the mass-transfer rate whereas the superhump is observed to appear well after the beginning of the superoutburst. Smak (1996,2000) therefore suggested that both the mass-transfer rate enhancement and the tidal instability could be combined into a “hybrid” model in which they would play a role at different phases of the superoutburst. The superoutburst would start with a major enhancement of the mass-transfer rate due to irradiation by a preceding normal outburst. The resulting contraction of the disc would screen the secondary from irradiation, thus decreasing the mass-transfer rate. This in turn would cause the disc expansion and bring the disc into the 3:1-resonance radius. Only then would the tidal instability enter the game. This is an attractive scenario but the ‘hybrid’ model might be slightly different. For example it is not clear that shrinking the disc changes the secondary’s irradiation.
Hameury et al. (2000, hereafter HLW) presented a series of numerical experiments in which irradiation of the secondary and other non-standard effects were examined. Their results make it easier to understand what the hybrid model of superoutbursts could look like.
The response of the secondary to sudden irradiation is rather complex (see e.g. Hameury et al. 1997) and HLW preferred to use a simpler approach in which a linear relation between the mass transfer rate from the secondary and the mass accretion rate onto the white dwarf is assumed:
| (59) |
where is the mass transfer rate in the absence of irradiation. Although it is an extremely crude approximation, it has at least the advantage of having only one free parameter . Its value must be in the range for stability reasons. Such an approach assumes that irradiation of the secondary can increase the mass-transfer rate by a substantial amount. As discussed by HLW, in principle irradiation during dwarf nova outbursts could bring the mass- transfer rate up to g s-1 , i.e. increase it by 3 orders of magnitude. Meyer-Hofmeister, Meyer & Liu (1998) expressed doubts about the possibility of the increase of about 300 required in the model of of WZ Sge by Hameury et al. (1997), but such values are not excessive considering the very large irradiating fluxes (see above).

Figure 24 shows a light curve (lowest panel) similar to those observed in SU UMa stars. In the model was assumed. The uppermost panel shows that during the supercycle (between two large outbursts) the disc radius increases. Smak (1991,1996) studied the observed disc radius evolution in two SU UMa stars: Z Cha and OY Car, the only two systems for which sufficient data is available. In Z Cha observations suggest that the disc radius is actually decreasing, but the data scatter is rather large. In observations of OY Car no trend can be seen. The radius increase is one of the fundamental elements of the the TTI model. The difference between the HLW and TTI models is that in the former the disc radius varies during normal outbursts (because of the mass-transfer rate enhancements) whereas in the latter it is almost constant. In the HLW model during a large outburst the disc expands after an initial contraction and can reach the 3:1–resonance radius. So in this model only the superhump, not the superoutburst, would be due to a tidal instability. It worth noting that the initial contraction of the disc followed by an expansion to a larger radius could postpone the appearance of the superhump. Smak (1991) also considered the effect of mass-transfer rate enhancements in a SU UMa star, but obtained a different radius behaviour. The reason for this difference is that while HLW assume that depends on (Eq. 59), in Smak’s model is increased by about one order of magnitude after the maximum of a normal outburst, during a fixed time. As a consequence, at the end of a large outburst HLW obtain a much smaller radius than Smak in his model. In HLW, when the cooling wave starts propagating, the accretion rate onto the white dwarf, and hence the mass transfer from the secondary, is unaffected, and the disc contracts as in the unilluminated case, whereas in Smak’s model, the disc expands rapidly when mass transfer is reduced by a factor of 10; the surface density at the outer edge then drops below the critical value, and a cooling wave starts in quite a large disc.
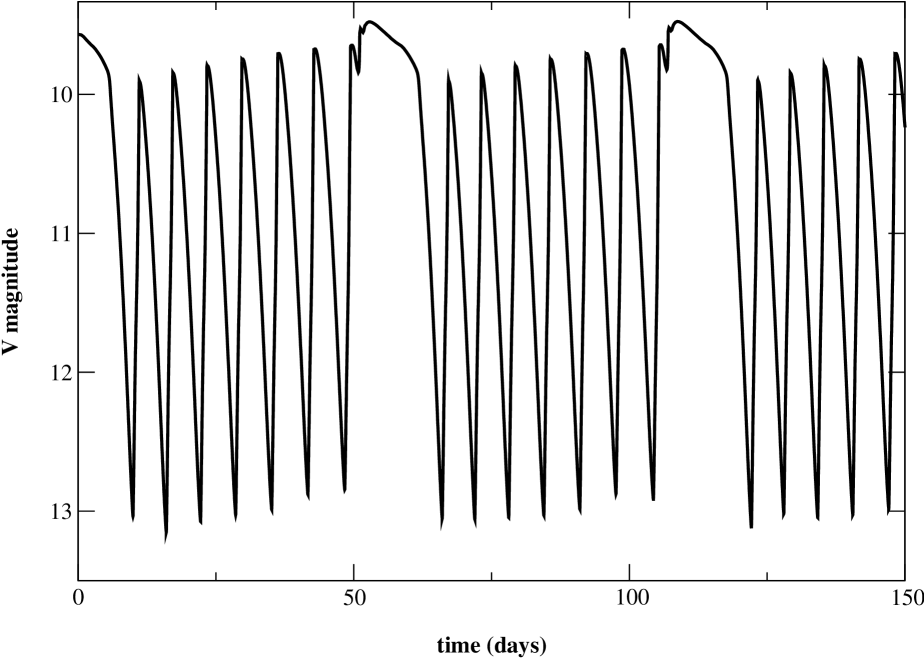
Fig. 24, however, does not represent a model of an SU UMa star: the mass transfer rate, g s-1 is too large for such a system. For lower mass-transfer the model fails to produce large outbursts. The reason is that too much mass is lost during normal outbursts: the enhanced mass-transfer rate increases the burst’s duration. This failure of the model is due to the linear relation between the accretion and the mass-transfer rates. This relation was assumed for the sake of simplicity but in real systems things are more complicated. One can nevertheless expect that Fig. 24 represents a more general class of models.
Fig. 25 and 26 show models in which the secondary is irradiated and in addition the inner disc is either truncated or irradiated by a hot white dwarf. The binary parameters and the mass- transfer rates are the same in both cases.
Fig. 25 shows a different way of obtaining sequences of ‘narrow’ and ‘wide’ outbursts, similar to what was suggested by Smak (1999a), the difference being once more that in the present case there is a relation between the mass-transfer and accretion rate while in Smak’s case the mass transfer rate is independent of the accretion rate.
When the disc extends down to the white dwarf but is irradiated as suggested by King (1997) one can obtain very curious light-curves (HLW). Fig. 26 is very reminiscent of the light curves of a subclass of frantic SU UMa stars: the ER UMa stars whose supercycles are very short. They range from 19 to 45 days (instead of the usual 130-160 days) (see e.g. Kato et al. 1999 and references therein). These systems are expected to have higher mass-transfer rates than SU UMa stars, so in this case g s-1 could be the appropriate mass-transfer rate. Osaki (1995b,c) obtained almost identical light-curves in the framework of the TTI model. But in the case of RZ LMi, the system with the shortest supercycle he had to assume a significantly lower strength of the tidal torques. HLW, on the other hand, use a very simple irradiation law. Perhaps also in this case a hybrid model is the answer.
So far so good: with the help of additional ingredients we were able to use the DIM to explain many properties of dwarf nova outbursts. The real trouble begins when one tries to describe the quiescence in dwarf nova outburst cycles.
5.5 Quiescence
According to the DIM a quiescent accretion disc is cold everywhere, i.e. its effective temperature is everywhere lower than the critical temperature given by Eq. (71): K. In fact, the effective temperature is much lower because after the outburst the disc ends up well below the critical values of and (see e.g. Fig. 11). In the models the midplane temperature may be as low as 2000-3000 K, whereas observations suggest K (e.g. Wood et al. 1986,1989a). One encouraging fact (maybe the only one) is that the DIM predicts flat radial temperature profiles and such profiles are indeed observed. At first the flatness of temperature profiles elicited surprise among some authors, who seemed to expect a profile despite the very clear prediction of the model (Smak 1984b; Smak, presumably irritated by the surprise constantly elicited by the flat temperature profiles, reminds the reader that in Fig. 4 of his earlier paper such profiles are clearly seen).
The low quiescent temperatures predicted by the DIM cause several problems. First, they do not, of course, correspond to observations. However, since temperature profiles are determined only for eclipsing systems, i.e. for high inclination systems, it is not clear what the 2D modeling (Horne 1991; Smak 1994) refers to. A corona above the disc could spoil the whole procedure (but see Vrielmann 2000). In any case simple (one zone) models of the observed emission from quiescent disc require (Wood, Horne, Stiening 1992), while more refined modeling (Idan et al. 1999) is only ostendibly better at lowering the values (). Observations of the quiescent state of EX Dra by Baptista & Catalán (2000) contradict the DIM, independent of the version the data they use (contrary to what they seem to believe).
It is important to determine the exact value of the temperature in quiescence is important because it will provide us with crucial information about the viscosity mechanism operating during this phase of the outburst cycle. The most recent calculations by Hawley (2000) seem to indicate that turbulent viscosity in real accretion discs is produced by the Balbus-Hawley mechanism. Since this mechanism would not operate in a quiescent dwarf nova disc for K (Gammie & Menou 1998; the real limit is on the magnetic Reynolds number: ), viscosity in quiescent discs would have to be attributed to a different mechanism if one wants to preserve the DIM. The DIM does not assume a specific viscosity mechanism but does assume that the angular-momentum transport mechanism is local. In other words, the disc in the DIM is an -disc.
The DIM predicts quiescent temperatures which are below the critical value needed for the Balbus-Hawley instability to operate. This statement is not based on a self-consistent calculation because in calculating the critical numbers one assumes a value of , but let us accept this conclusion for the sake of the argument. Then, for the DIM to be valid a different viscosity mechanism must be at work in quiescence. For example, if at low temperature turbulence were of hydrodynamical origin (as proposed by Zahn 1991), the DIM could be rescued. (The interpretation of the Gammie-Menou ‘effect’ by Livio 1999 is nonsense because it uses the hot Shakura-Sunayev solution to describe the cold branch od the -curve – see Lasota 2000b).
Of course one should keep in mind that the main assumption made in the DIM about viscosity – the increase of in outburst – has yet to be confirmed by calculations. Even the relevance of in the context of the Balbus-Hawley mechanism (or the relevance of the Balbus-Hawley mechanism to -discs) has still to be demonstrated.
Non--disc solutions are also possible. It has been proposed that there is no viscosity in quiescent dwarf-nova disc (e.g. Paczyński 1977; Różyczka & Spruit 1993; Gammie & Menou 1998; Kornet & Różyczka 2000). In such a case matter would have to accumulate where it arrives from the secondary: at the outer disc edge. Therefore all outbursts would have to be of the ‘outside-in’ type. And they are not. Of course one does not have to assume that all quiescent discs are the same. For example, the very low -value interpretation of the long recurrence time of WZ Sge assumes that for some reason the disc in this system is different. If it is confirmed that all normal outbursts in SU UMa stars are ‘outside-in’, one could argue that in this systems there is no viscosity in the disc during quiescence. One would the have to explain wher the observed X-rays come from (they clearly come from the accretion flow), but the popular panacea of accretion astrophysics, disc coronae, could presumably save the day. In any case such models would be fundamentally different from the DIM and a global hydrodynamical instability would have to be at the origin of the outbursts (e.g. Różyczka & Spruit 1993). Also other m echanisms (e.g. Caunt & Tagger 2001 and references therein) cannot be ruled out.
Menou (2000a) argued that spiral waves (or shocks) tidally induced by the secondary could be the main physical process responsible for accretion in quiescence. Spiral patterns are indeed observed in some dwarf nova systems (see Steeghs 2000 for a review). To support his suggestions Menou shows that there exists a correlation between recurrence times of SU UMa stars and their mass- ratios (see Sect. 5.4.1). This could indeed suggest that recurrence times have something to do with tidal torques. However, as Terquem (2000) has pointed out, tidal torques would be effective only in the outer disc, so the problem of the impossibility of ‘inside-out’ outbursts would persist (Menou expects the mechanism to apply to all dwarf-nova types). In any case the ‘tidal-spiral’ mechanism cannot be described in the framework of -discs (Balbus & Papaloizou 1999).
Last but not least, while all versions of the DIM predict increasing quiescent fluxes, observations show that they are constant or decreasing (see e.g. Smak 2000). This may require a major revision of the DIM.
Quiescence is therefore the biggest unsolved problem of the DIM.
X-rays
According to the DIM the disc should be neutral. We do not expect to observe X-rays emitted by such a system. But we do observe them. Quiescent dwarf novae and LMXBTs both emit quite an impressive quantity of X-rays with luminosities reaching erg s-1 (Eracleus et al. 1991, van Teeseling et al. 1996; Richards 1996). Observations of quiescent X-rays in eclipsing systems show clearly that they are emitted by the accretion flow close to the white dwarf. If the quiescent disc were to extend down to the white dwarf surface and the X-rays emitted by a hot boundary layer (Pringle & Savonije 1979; Tylenda 1981; Patterson & Raymond 1985), the required accretion rates would be about two orders of magnitude higher than those allowed by the DIM (e.g. Meyer & Meyer-Hofmeister 1994). Hence the idea that the disc does not extend down to the white-dwarf surface. The consequences of ‘holes in discs’ for the DIM have been discussed above. What fills the holes is of less importance for the DIM (in practice, however, it adds one or two free parameters) as long as fronts do not propagate into it.
Holes can be due to magnetic fields (e.g. Livio & Pringle 1992; Lasota et al. 2000) or to evaporation into a ‘siphon flow’ (Meyer & Meyer-Hofmeister 1994, Meyer, Meyer-Hofmeister & Liu 1996, 1998) or to an ADAF (Menou 2000b). The main challenge for last the two classes of models (especially for the ADAF model) is to explain why emission is observed to come from a source the size of a white dwarf radius (e.g. van Teeseling 1997; Wood et al. 1995) while the hot plasma forms a much more extended structure.
6 Low-mass X-ray binary transient systems


Compared to dwarf nova eruptions, outbursts of low-mass X-ray binary transients are both easier and more difficult to describe. Easier because fewer systems are known and recurrence times are much longer, so there is less information about outbursts to deal with. There are also fewer multi-wavelength observations, so much of the data is of rather limited value to theorists (or is of unlimited value to those who use them to support their suspect models). Most of the bolometric luminosity in outburst is emitted in soft X-rays, but often only hard X-ray data are available, etc. In the case of dwarf novae, one can always count on an optical telescope to observe the outburst. In fact, this is a field in which amateur astronomers play a very important role. In the case of LMXBTs we are at the mercy of the X-ray satellites that happen to be in orbit during the outburst. In addition, simultaneous multiwavelength observations are often difficult to arrange. The systems themselves are also not so well observed: only four neutron-star LMXBTs have well determined orbital periods and only one such system is eclipsing; nine orbital periods of black-hole LMXBTs are known and only one is eclipsing. Despite this relative scarcity of data, constructing a model is rather difficult because the systems themselves are more complicated physically.
Discs in low-mass X-ray binaries are strongly X-ray irradiated; this influences their stability properties (Sect. 3.2) and affects the propagation of heating and cooling fronts during outburst. The optical flux during eruptions is due to X-ray reprocessing. There is also a fundamental problem with the geometry of irradiation. The simplest model, in which a point-source located in the midplane at the center irradiates a planar disc, cannot work (see e.g. DHLC). Also eclipse statistic suggests values of the disc’s aspect ratio that are much too large (Milgrom 1978) to be accommodated by a vertically static planar disc. Therefore extended sources and/or warped discs have to be considered, and these, especially the latter, may completely change the character of the outburst models. In addition, the DIM for LMXBTs suffers from all the deficiencies of the dwarf-nova version, although some of them disappear when the effects of irradiation are included in the model.
Fig. 27 shows lightcurves of two LMXBTs believed to contain accreting black holes. A0620-00, the veteran prototype X-ray transient system has a typical FRED-type lightcurve. But is it a typical LMXBT lightcurve? The answer is no since even among FREDs it is exceptional, in with a fast quasi-exponential decay over almost 2.5 decades and XTE J1118+48 shows that completely different lightcurves are observed in LMXBTs. Attempts to model LMXBT outbursts with the DIM try to reproduce A0620-00, for obvious reasons: this model ‘naturally’ produces fast-rise/slow-decay lightcurves.
Van Paradijs & Verbunt (1984) and Cannizzo, Wheeler & Ghosh (1985) suggested that LMXBT outburst could have the same origin as dwarf nova eruptions. Time-dependent models of LMXTB outbursts, however, have been even less successful than models of dwarf novae. Models by Huang & Wheeler (1989) and Mineshige & Wheeler (1989) were the first heroic attempts to obtain LMXBT’s light curves, but the result was not really compelling: neither the amplitudes nor the recurrence times corresponded to reality. Several later attempts concerned only some of the phases of the outburst cycle, e.g. the decay from outburst (Cannizzo et al. 1995) or evolution in quiescence (Meyer-Hofmeister & Meyer 2000). In 1998 Cannizzo presented LMXTB models for truncated discs, in which a non-standard viscosity law was assumed. In addition Cannizzo (1998a) used an incorrect fixed-radius boundary condition. It was an interesting and useful contribution to the problem but not a viable model. Menou et al. (2000) calculated a series of LMXBT models in which the disc is truncated and used a correct outer boundary condition. They used the conventional viscosity prescription in which is constant on the thermally stable branches of the -curve. They considered two classes of models: with a ‘neutron star’ (1.4 M⊙) and a ‘black hole’ (=6 M⊙). The evaporation was described by Eq. 11 which gives larger rates than those of Cannizzo. In fact, in the neutron-star models of Menou et al. (2000) the evaporation is unfortunately much too strong: the mass used in Eq. (11) is 6 M⊙ instead of 1.4 M⊙ (Dubus, private communication).
Menou et al. (2000) found that in black-hole models strong evaporation does increase the recurrence times (in agreement with earlier calculations by Cannizzo 1998a), but is not sufficient to reproduce the longest known recurrence times of LMXBTs when standard values of the viscosity parameter are used in the disc (, ). The recurrence time could be increased to years if one assumed . Because of very slow rises-to-outburst, however, the light-curve shapes were not acceptable, even if the lower value of disposed of reflares present for higher values.
Menou et al. (2000) concluded that ‘future models’ must include the missing (but observed in real systems) ingredient: irradiation. This conclusion was not new: King & Ritter (1998) have pointed out that LMXBT light-curve shapes are determined by X-ray irradiation. Recently DHL have obtained models of irradiated and truncated accretion discs describing complete outburst cycles.
6.1 Irradiation
Accretion discs in low mass X-ray binaries are irradiated by the X-rays emitted by the accretion flow and at high luminosities their optical light is due to X-ray reprocessing (van Paradijs & McClintock 1995). The outer disc’s emission is then dominated by irradiation. This does not mean, however, that the disc’s structure is dominated by irradiation. The condition for irradiation to dominate the vertical disc’s structure can be obtained from Eq. (31) and reads
| (60) |
(Lyutyi & Sunayev 1976; Tuchman, Mineshige & Wheeler 1990; Hubeny 1991; Huré et al. 1994; DLHC) and not just as too often assumed in the literature. If this condition is satisfied the disc is (in the simplest case) isothermal. In other words: irradiation dominates the disc’s structure only if the irradiation temperature is larger than the midplane temperature of the disc.
Shakura & Sunyaev (1973) devised a simple way of describing a disc’s irradiation by a midplane, central point source: Eq. (37). They wrote as:
| (61) |
where is the X-ray albedo and is the local height at which irradiation energy is deposited, or the height of the disc “as seen by X-rays”. One often writes instead of but this could lead to misunderstandings because is not equal to the local pressure scale-height . Therefore one cannot use the value estimated from observations to evaluate e.g. the value of from Eq. (21). According to Shakura & Sunyaev (1973) the rhs of Eq. 61 should be multiplied by () if the accreting body is a black hole and not an object with a ‘hard’ surface.
When one calculates a self-consistent irradiated-disc structure using Eq. (37) with Eq. (61) one finds that it is not affected by irradiation (Tuchman et al. 1990; DLHC). The reason is that in such a model the outer part of the disc that would be most affected by irradiation cannot see the irradiating source because of the disc’s self-screening. Observations, however, show that discs in LMXBs are irradiated. Therefore the irradiating source is not point-like or/and the disc is not planar. In the first case the outer disc would be irradiated e.g. by a scattering corona. In the second the disc would be warped. There is evidence for both of these effects but incorporating them into the DIM is practically impossible. DHL chose to use the simplest description of irradiation as given by Eq. (37) with a constant , whose value is chosen in such a way as to correspond to observed X-ray reprocessed fluxes. More precisely, for time-dependent calculations DHL took
| (62) |
is the mass accretion rate at the inner disc radius and is the accretion efficiency ( is calculated assuming ). In models including evaporation varies during the outburst cycle.
is a measure of the fraction of X-rays that heats the disc and, as such, contains information on the irradiation geometry, X-ray albedo, X-ray spectrum, etc. Kim, Wheeler & Mineshige (1999) used an analogous prescription for the indirect irradiation flux. On finds that the observed optical magnitudes and stability properties of persistent low mass X-ray binaries are compatible with a value of 5 (with , DLHC). However, there is no reason for to be a constant in the disc or in time. For instance, Ogilvie & Dubus (2001) showed how could vary in a warped disc while Esin, Lasota & Hynes (2000) argued that disminished during the 1996 outburst of the X-ray transient GRO J1655-40. For simplicity, DHL assumed =5. It should be remembered that this is the simplest assumption but not necessarily the most realistic one.
6.2 Outburst
We will base the description of the LMXBT outburst cycle on a model discussed in details in DHL. The parameters used in this model are: the ‘black hole’ mass M⊙, the mass-transfer rate , , , cm. Evaporation of the inner disc is described by Eq. (11). Below the inner radius all matter evaporates into an ADAF. Because of the steep dependence of on , evaporation above this radius can be neglected. Menou et al. (2000) noticed that the detailed functional dependence of , or of , has essentially no effect on the results; what matters is the value of the inner disc radius during quiescence.
The ADAF radiative efficiency scales as (i.e. the luminosity scales as , Esin et al. 1997) . From Eq.11, this is equivalent to . Irradiation is taken into account using Eq. 62 with when (in outburst) and when (in quiescence). Irradiation is usually negligible in quiescence so these assumptions have little importance for the description of this phase of the outburst cycle.
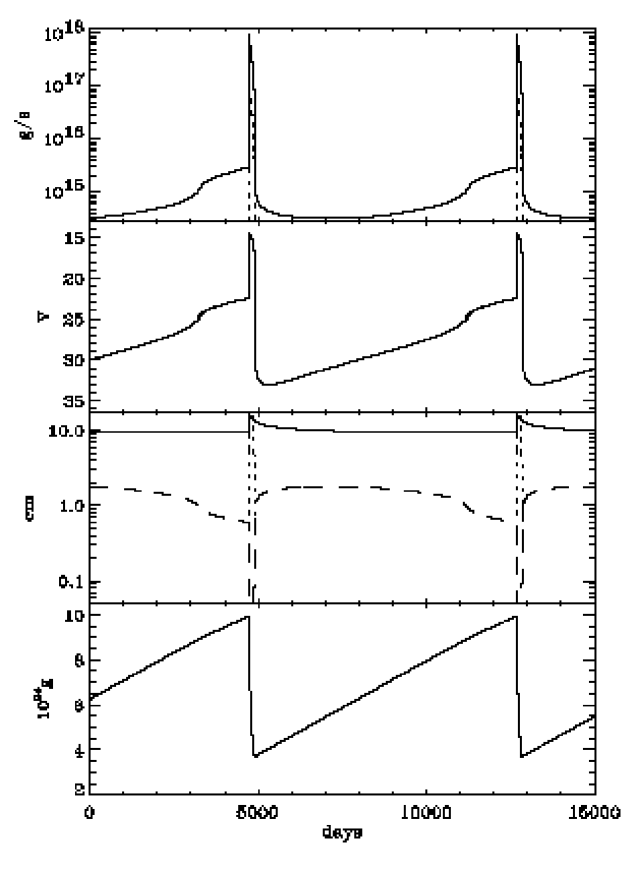
The outburst cycle for these parameters and assumptions is shown in Fig. 28. The recurrence time is 22 years, the peak luminosity erg s-1. The average mass of the disc is g and during the outburst : due to irradiation a much larger fraction than in a standard dwarf-nova disc.
We will now discuss the outburst cycle in more detail.
6.2.1 Rise to maximum
A LMXBT outburst starts in the same way as in a dwarf nova since in quiescence irradiation is of no importance. As mentioned before, one expects these outbursts to be of the ‘inside-out’ type. In a disc truncated by evaporation this ‘inside’ can be pretty far from the accreting object; in the model presented in Fig. 28 just before the outburst cm, i.e. 2900 . As the inside-out heating front propagates, rises and the outer cold disc is increasingly irradiated (see Fig. 29). Heating by X-ray irradiation reduces the critical density on the hot branch, thus facilitating front propagation. Obviously, a larger hot region implies a greater optical flux and irradiation always implies larger peak optical luminosities.

The heating front structure is not modified by irradiation as can be seen comparing Figs. 13 and 30. However, that as explained in detail in DHL, the description of the heating front propagation is not complete. The problem is that the outer disc regions are ‘frozen’ in the cold state on a timescale on which evolves (see Fig. 29). If increases on a timescale shorter than the thermal timescale in the cold disc, at some radii one can have . The code used by DHL is not adapted to such a situation, so they assumed that in such a case the disc is isothermal at and that irradiation contributes an additional heating term to the radial thermal equation which to reflect the imbalance at the photosphere between the outgoing flux and the incoming flux . This difficulty has little practical significance in the context of the DIM but may be a sign that some additional physical processes should be included in the model. This could be the case irradiation with evaporation of the upper layers of the disc (Begelman et al. 1983; Hoshi 1984; Idan & Shaviv 1998; de Kool & Wickramasinghe 1999).
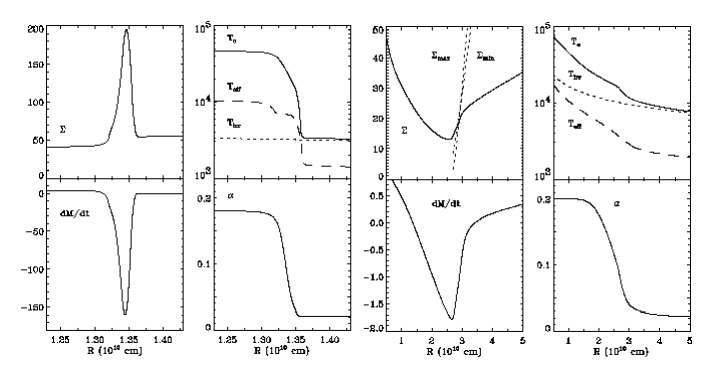
The arrival of the heating front at the outer disc rim does not end the rise to outburst. What happens then can be seen in Fig. 31 which corresponds to a model with parameters slightly different from those discussed earlier in this section (the main difference is a higher mass-transfer rate which lengthens outburst’s timescales). Fig. 31 shows that after the whole disc is brought to the hot state a surface density (and accretion rate ‘excess’) forms in the outer disc. The accretion rate in the inner disc corresponds to the critical one but is much higher near the outer edge. While irradiation keeps the disc hot the excess difffuses inwards until the accretion rate is roughly constant. During this last phase of the rise to outburst maximum increases by a factor of 3. In Fig. 29 this phase begins at the 4th dot on the light-curve. Irradiation has little influence on the actual vertical structure in this region, as discussed in DLHC and we duly find , as in a non-irradiated steady disc. Only in the outermost disc regions does the vertical structure becomes irradiation-dominated, i.e. isothermal.
Now the disc is ready to begin the decay phase of the outburst cycle.

6.2.2 Decay
The shapes of decay lightcurves in LMXTBs have generated a considerable amount of theoretical activity. The reason was that their alleged ‘exponential’ slopes were not a “natural” outcome of DIM calculations. Various speculations and models involving viscosity-law modifications and other attempts to modify the accretion disc’s physics were put an end to (not immediately, however) by King & Ritter (1998), who pointed out that X-ray irradiation of the disc produces “naturally” exponential decays. As mentioned above, previous attempts to include irradiation in the disc’s models used Eq. (61) and arrived at the correct conclusion that because of self-screening irradiation cannot be important in LMXBTs. King & Ritter took a more realistic approach, noticing that since there is extremely strong observational evidence for disc irradiation, the inability of the model to reproduce this feature just highlights its ‘limitations’. King & Ritter used Eq. (61) but this did not change the validity of their main conclusion: by heating the outer disc regions X-ray irradiation prevents the propagation of the cooling front that would switch off the outburst: only a viscous decay is then possible. The corresponding lightcurve has an exponential slope. Objections were put forward to this last conclusion (Cannizzo 1998b) but they were based on models not relevant in the context of LMXBT oubursts, as we will see below.

Fig. 32 shows the sequel to what was described in Fig. 29. One can see that in general decay from the outburst peak can be divided into three parts:
-
•
First, X-ray irradiation of the outer disc inhibits cooling-front propagation. Obviously the peak accretion rate is much higher than the mass-transfer rate so the disc is drained by viscous accretion of matter, as proposed by King & Ritter (1998).
-
•
Second, the accretion rate becomes too low for the X-ray irradiation to prevent the cooling front from propagating. The propagation speed of this front, however, is controlled by irradiation.
-
•
Third, irradiation plays no role and the cooling front switches off the outburst on a local thermal time-scale.
‘Exponential decay’
In Fig. 32 the first phase lasts until roughly day 80-100 and corresponds to the “exponential decay” of the light-curve. At the ouburst peak the accretion rate is almost exactly constant in the disc (Fig. 31). The subsequent evolution is self-similar: the disc’s radial structure evolves through a sequence of quasi-stationary () states. Therefore and the total mass of the disk is thus
| (63) |
At the outburst peak the whole disc is ionized and, as mentioned above, except for the outermost regions its structure is very well represented by a Shakura-Sunyaev solution. In such discs, as well as in irradiation dominated discs, the viscosity coefficient satisfies the relation . In ‘hot’ Shakura-Sunyaev discs , and in irradiation dominated discs = 1/3. During the first decay phase the outer disc radius is almost constant so that using Eq. (63) the disc-mass evolution can be written as:
| (64) |
showing that evolves almost exponentially, as long as can be considered as constant (i.e. over about a decade in , as found by King & Ritter 1998 for irradiated discs, and by Mineshige, Yamasaki & Ishizaka 1993 for non-irradiated discs with loss of angular momentum). The belief that viscous decay must produce power-laws with indices close to -1 is based on models in which it is assumed that the disc evolves with constant angular momentum. In such models no tidal torques are present and the outer disc radius must expand indefinitely (Lyubarski & Shakura 1987; Cannizzo, Lee & Goodman 1990; Mineshige et al. 1993). Clearly such models are not appropriate for discs in close binary systems.
‘Exponential’ decays in the DIM are only approximately exponential, as pointed out by King (1998), who considered an ‘analytical’ model in which the disc structure was totally dominated by irradiation. The quasi- exponential decay is due to two effects: 1.) X-ray irradiation keeps the disc ionized, preventing cooling-front g propagation, 2.) tidal torques keep the outer disc radius roughly constant.
‘Linear’ decay
The second phase of the decay begins when a disc ring cannot remain in thermal equilibrium. Locally this corresponds to a fall onto the cool branch of the -curve. In an irradiated disc this happens when the central object does not produce enough X-ray flux to keep the above K. A cooling front appears and propagates down the disc at a speed of (see Sect. 4.2.2).
In an irradiated disc, however, the transition between the hot and cold regions is set by because the cold branch exists only for K. In an irradiated disc a cooling front can propagate inwards only down to a radius at which K, i.e. as far as there is a cold branch to fall onto. Thus the decay is still irradiation-controlled. The hot region remains close to steady-state but its size shrinks (as can be seen in Eq. 62 with ). The structure of the cooling front is not different from the non-irradiated case. Also here the cooling front propagation produces both inflow and outflow (see Fig 30) of matter so the decline is steeper than what some analytic approximations would predict (e.g. King 1998).
Thermal decay
In the model shown in Fig. 32 irradiation is unimportant after days because becomes very small for gs-1. The cooling front thereafter propagates freely inwards, on a thermal time scale. In this particular case the decrease of irradiation is caused by the onset of evaporation which lowers the efficiency. In general there is always a moment at which becomes less than K; evaporation just shortens the ‘linear’ decay phase.
6.3 Visual lightcurves

In FRED-type lightcurves the decay in visual light is slower than in X-rays. This is also a property of the irradiated DIM (Fig. 33). This effect is due to irradiation which, under very general conditions, can keep the cold outer disc hotter than usual during the propagation of the cooling front. Fig. 32 shows the disc behind the front is dominated by irradiation and almost isothermal. Obviously, the peak optical flux is much higher when the disc is irradiated than when it is not.
6.4 Recurrence times
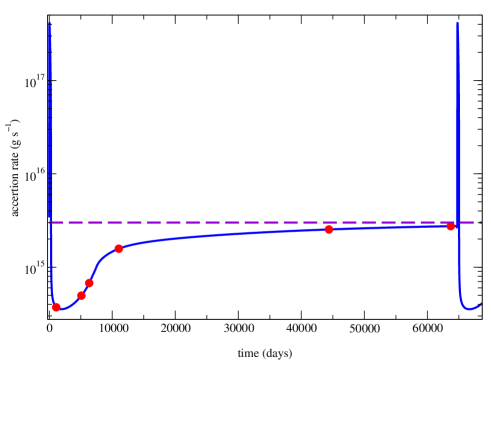
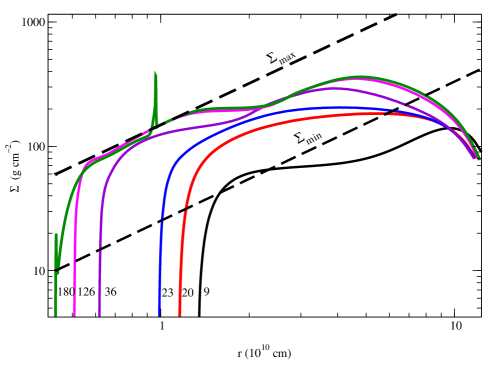
Models with truncated and irradiated discs produce recurrence times from 1 to 180 years. Since observations indicate that LMXBTs have recurrence times from 0.5 to 50 years this is very encouraging. It is therefore interesting to see why these recurrence times are so long and what are the respective contributions of truncation and irradiation to this longevity of quiescence. Figure 34 shows an extreme case where this can be studied. The recurrence time is 180 years.
The first profile in Fig. 34 shows the density profile about 9 years after the disappearance of the cooling front. (Similar profiles can be found in Meyer-Hofmeister & Meyer & Liu 2000, but in their case only the quiescent phase of the cycle is calculated). It shows that the post-outburst surface-density is lower than . This is, of course, the result of the first phase of the decline from outburst during which the cooling front propagation is inhibited and the disc is emptied on a viscous time. Therefore, the ‘usual’ assumption that at the start of the quiescent phase (Osaki 1996) is clearly invalid in this case, as is, at least numerically, the quiescence-time estimate given by Eq. (53). The subsequent evolution proceeds through a sequence of rather flat surface-density profiles. The disc is small so that the whole disc feels the effect of the boundary condition. As the disc fills up with matter the accretion rate increases and the inner disc radius decreases. After 36 years of this evolution the inner accretion rate is g s-1 and roughly 30% of the mass accreted during the outburst ( g) has been refilled into the disc. A significant change in the profile has taken place. A look at Fig. 6 elucidates what is going on: the outer, cold part of stationary discs has the same profile. Therefore, a large part of the disc becomes stationary. This is not surprising because the accretion rate is now close to the mass-transfer rate. After another 90 years the accretion rate arrives very close to the mass-transfer rate and now the disc is ‘full’ and quasi-stationary. It will take another fifty years before the line is crossed at last.


.
It is probably impossible to reach such longevity in real systems. The reason is that in the last stages of this long quiescence even a small fluctuation in the mass transfer from the secondary (which will propagate inwards in less than a hundred days) will be able to trigger an outburst. If we allow fluctuations of a factor of two, the ‘real’ quiescence time would rather be years. The refilling time-scale for the disc is years (see Eq. (55 with . One can therefore conclude that the DIM model enriched with the effects of evaporation and irradiation can produce the recurrence times observed in LMXBTs).
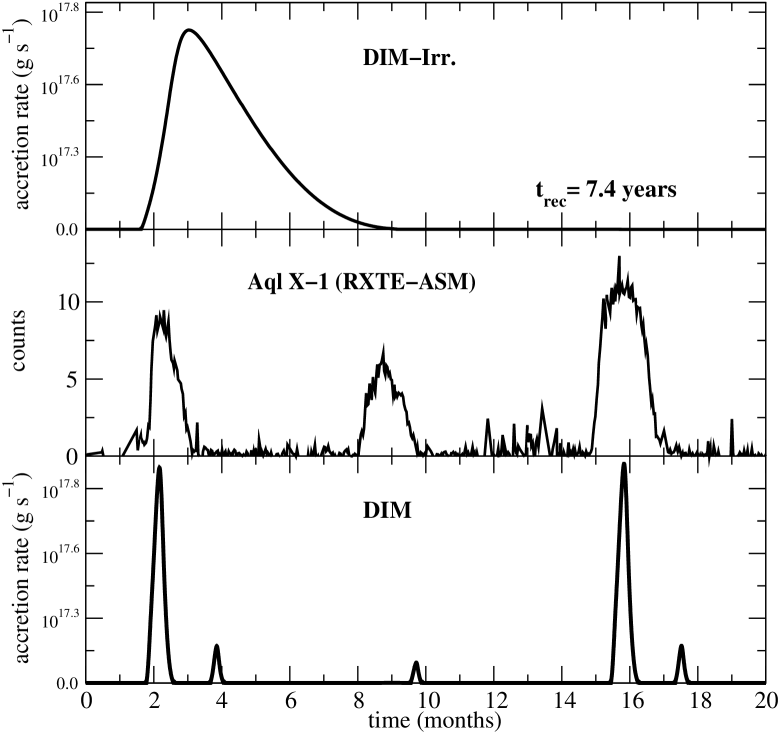
6.5 The X-ray delay
In contrast to the dwarf-nova UV-delay, of which several well documented occurrences were observed, there is only one example of an X-ray delay in a LMXBT. This observation was almost a miracle considering how rare are outbursts in these systems. The April 1996 observation of the rise to outburst the black-hole transient source GRO J1655-40 showed a 6 day delay between the beginning of the rise of the BVRI light and the RXTE-ASM X-rays (Orosz et al. 1997). Orosz et al. (1997) also reported a delay between I, R, V and B light-curves and considered this to be an indication of the outside-in nature of the outburst. The DIM, however, predicts no observable delay between the rise of light in these wavelengths. The heat front produced by the instability increases the effective temperature to K, for which the relevant colour indices are close to zero, so no delay is expected. Hameury et al. (1997) explain that the impression of a successive delay between the I, V, R and B light is given by the different slopes of the respective light-curves. These wavelength-dependent slopes are determined by the presence of the diluting emission from the luminous, F4-type companion star.
Figure 35 shows the results of calculations by Hameury et al. (1997), who compared multi-wavelength light-curves obtained with DIM with and without inner disc truncation. Only the model in which the inner disc radius is cm can reproduce both the 6-day X-ray delay and the slopes of the X-ray and optical light-curves. In addition, obtaining an outside-in outburst with a full disc requires a specially designed initial surface-density profile. This is a strong, theoretical argument in favour of the presence of inner ‘holes’ in quiescent discs of LMXBTs. (Arguments based on the X-ray reflection spectra are ont bery compelling, see Done & Nayakshin 2000).
6.6 Comparison with observations
The truncated and irradiated DIM should be considered as providing a basic framework for the description of LMXBT outbursts rather than a successful model. Its successes are limited to a few points: it reproduces rise- and decay- times of a subclass of LMXTBs and the recurrence times obtained compare well with observed ones. The model in its simplest form, however, cannot reproduce other properties or other subclasses of LMXTBs. For example, in Fig. 36 we compare the observed (RXTE) X-ray lightcurve of Aql X-1 (a neutron-star binary) with two theoretical ‘lightcurves’. One should bear in mind that theoretical ‘X-ray lightcurves’ shown here represent just the accretion rate onto the central body and not the X-ray luminosity in some specified energy domain. These lightcurves can be thought of as bolometric X-ray lightcurves only if a 0.1 efficiency is assumed. Therefore in models with evaporation the accretion rate does not correspond to the bolometric luminosity for . The upper panel of Fig. 36 corresponds to a model with a ‘standard’ value of ; the lower one to a ‘standard’ DIM with no irradiation or evaporation. The mass of the accreting body is 1.4 M⊙, the mass transfer rate is g s-1, and . The average outer radius is equal to cm in the irradiated-disc model, and cm in the DIM. In the irradiated-disc case the recurrence time is 7.4 years, much too long since the recurrence time of Aql X-1 is year; the standard disc gives 0.8 year, closer to the observed value. However, outburst duration is too short in the standard DIM and too long in the irradiated-disc case. This suggests that by adjusting the value of one could obtain a better agreement between model and observation. Of course playing with parameters is of no interest if it is not supported by physical arguments; and reliable physical arguments could be difficult to find, because determining the value(s) of presumably involves not only solving the transfer problem for irradiating X-rays but also modeling the changing shape of the warped disc (Ogilvie & Dubus 2001).
Comparisons of the model with other types of LMXBTs such as GRO J1655-40 may require the addition of other effects to the irradiated-truncated DIM. Esin et al. (2000a) have suggested that the plateau phase of the outburst in this system could be due to mass-transfer enhancement triggered by the (observed) X-ray irradiation of the secondary. As for dwarf novae, a successful model will have to include several additional physical mechanisms not taken into account in the ‘standard’ version.
Many X-ray light-curves of LMXTBs show secondary maxima (“kinks”). They don’t have an explanation in the framework of the irradiated-truncated DIM. The explanation proposed by King & Ritter (1998) (a two-phase irradiation of the disc) is not confirmed by model calculation (DHL). Cannizzo (2000) noticed that the fast rise-time of the secondary maximum precludes a viscous origin of this phenomenon and in consequence cannot be due to mass-transfer rate fluctuations. Cannizzo proposed that the secondary maximum is due to irradiation-induced evaporation and re-filling of the inner disc during the decay from outburst. However, Dubus (2001) showed that in models in which irradiation is directly related to the accretion rate at the inner disc edge the resulting secondary maxima should have shapes different from observed ones.
Several LMXBTs show also ‘secondary outburst’ (sometimes also called ‘reflares’ but we have reserved this term for the features discussed in Sect. 4.3) similar to those observed in WZ Sge-type systems (Kuulkers et al. 1996). No convincing model exist for this phenomena.
6.7 X-rays in quiescence
As mentioned in Sect. 5.5, the DIM rund into the same difficulties with quiescent LMXBTs as it does with quiescent dwarf novae. In particular, quiescent X-ray luminosities are too large compared to the predictions of the model.
The truncated DIM provides a natural explanation of quiescent X-ray fluxes: they are emitted by the inner hot, optically thin ADAF (Narayan et al. 1996; Lasota et al. 1996; Narayan et al. 1997a). As discussed in detail above, disc truncation is also necessary to make the DIM work in the other phases of the LMXBT outburst cycle (Hameury et al. 1997; Menou et al. 2000; DHL). Therefore according to the truncated DIM quiescent X-rays are produced by accretion.
However, since observed X-ray luminosities are often rather low, one should be sure that the X-rays are not emitted by other sources, in principle less powerful than accretion. Dwarf novae observations show that, quiescent X-rays are emitted by the accretion flow and not by the secondaries coronae (see Sect. 5.5).
In the case of neutron-star LMXBTs, Brown, Bildsten & Rutledge (1998) attribute the quiescent X-rays to thermal emission from the neutron-star surface. This emission would be due to repeated deposition during the outbursts of nuclear energy deep in the crust. This could be a viable alternative to the accretion model (Rutledge et al. 1999). In this case X-ray observations would allow the quiescent disc to extend down to the neutron star (or the last stable orbit). Menou et al. (1999c) discuss in detail the model in which the inner part of the quiescent accretion flow around a neutron star forms an ADAF. In this case the advected thermal energy must be emitted from the stellar surface; so, for the same mass-transfer rate, quiescent neutron-star LMXTBs should be more luminous than those containing black holes. This difference in luminosities is indeed observed. The problem, however, is that the ADAF model predicts quiescent neutron-star LMXTB luminosities much higher than observed. In order to reduce the accretion rate onto the neutron star (three orders of magnitude are needed) an ADAF model has therefore to involve the presence of winds and/or the ejection of the accretion flow by the magnetic field of a rapidly rotating neutron star: the ‘propeller effect’ (Menou et al. 1999c). According to Chandler & Rutledge (2000) no pulsations were observed in the system Aql X-1 in a phase of the outburst cycle where the propeller effect should be at work. This could just constrain the geometry of the system, or it could support the Rutledge et al. (1999) model. On the other hand Colpi et al. (2000) found that this model applied to Cen X-4 would require the neutron star in this system to be much heavier than that of e.g. Aql X-1, a difference which is not easy to understand.
Recent Chandra observations of quiescent Cen X-4 (Rutledge et al. 2000) show an X-ray thermal plus power-law component spectrum. The properties of the thermal component are compatible with the Brown et al. (1998) model. The origin of the (variable) power-law component is not clear. It could come from an ADAF but Menou & McClintock (2000) have pointed out several difficulties faced by the ADAF model of neutron-star LMXTBs. They show that if such a model is applied to Cen X-4, the quiescent optical-UV emission can be due neither to the disc nor to the ADAF. Lasota et al. (1996) and Narayan et al. (1996) argued that in black-hole LMXTBs the optical-UV emission should originate in the ADAF. Menou & McClintock (2000) show that in Cen X-4 this emission could be due to the ‘bright-spot’. If this were also the case for black-hole LMXBTs, conclusions based on the Narayan et al. (1996) model would have to be revised (there may also be other reasons for revising them, in view of Quataert & Narayan 1999 results). Menou & McClintock (2000) also show that the hard X-ray component observed in Cen X-4 and in neutron-star LMXBTs (Barret & Vedrenne 1994) cannot be only the result of Compton up-scattering in an ADAF. They conclude that if an ADAF is present around the neutron star in quiescent LMXBTs it does not leave any signature of its presence. All these problems are not really embarrassing for the irradiated-truncated DIM for LMXBT outbursts: it requires only a truncation, an inner ‘end’ of the disc. What exactly fills the hole is of lesser importance.
This implies that arguments against the propeller hypothesis based on the DIM should be treated with care. Zhang, Yu & Zhang (1998) and Campana et al. (1998) observed in Aql X-1 a three-order-of-magnitude decay of the X-ray flux in less than 10 days. They thought this implied a turned-on rotation-powered pulsar. An even faster decay has been observed by Gilfanov et al. (1998) during an ouburst of the millisecond X-ray pulsar SAX J1808.4-3658. In this case, of course, the propoller explanantion seems obvious but Gilfanov et al. also consider the possibility that the fast decay is due to the propagation a cooling wave. Although fast decays (“linear decay”) are observed in some dwarf-novae they are never as drastic as in Aql X-1 and SAX J1808.4-3658. In any case, in several dwarf-novae the propeller effect could be at work (e.g. Lasota et al. 1999). Gilfanov et al. (1998) state that “abrupt cut-offs of the light curves are common” in black-hole LMXBTs, but consulting for example Chen et al. (1997) rather confirms Campana et al. (1998) remark that “no indication of sudden steepening” is seen. As shown in the previous sections, a consistent DIM for LMXBTs requires a truncated inner disc which favours a propeller’s action … if a magnetic field is present. For the moment there are no predicted X-ray light-curves but they could appear (Dubus, Menou & Esin 2001).
Bildsten & Rutledge (2000) assert that in the case of black-hole LMXTBs the quiescent X-rays may be due to coronal emission from stellar companions. They argue that in these systems the ratio of the X-ray flux to the stellar bolometric flux is as in RS CVn stars, which are active, close, detached binaries of late-type stars (a G of K type giant or subgiant in orbit with a late-type main-sequence or subgiant) in which, for orbital periods of days, the rotation of both components is synchronous with the orbit. Their coronal X-ray emission may be as large as erg s-1 (Dempsey et al. 1993). However, Lasota (2000a) showed that all the available evidence makes it is very unlikely that companions of black-hole LMXTBs are the source of the quiescent X-ray luminosity. In fact, as clearly seen in Fig. 1 of Lasota (2000a), the luminosities of the three X-ray detected black-hole LMXTBs are much higher than those of RS CVn stars and well above the observationally determined (and rather well understood theoretically) upper limit of the X-ray luminosity of rapidly rotating late type stars. In addition there is no reason for the secondaries in black-hole LMXTBs to be different from their equivalents in dwarf novae (e.g. King 1999). Therefore as in quiescent dwarf novae, quiescent X-rays cannot come from the secondary’s coronal activity: they must be emitted by the accretion flow. This conclusion was firmly confirmed by Garcia et al. (2000) whose Chandra detection of GRO J0422+32 at erg s-1 should put an end to the unfortunate story of X-ray coronal emission from LMXTBs.
Lasota (2000a) noticed that the quiescent X-ray luminosity of the three then detected black-hole LMXTBs satisfies the relation:
| (65) |
which finds a natural explanation in the context of the truncated DIM. Chandra observations by Garcia et al. (2000) confirm the period dependence predcited by Eq. (65). These observvations also show that the quiescent X-ray luminosity of LMXBTs varies by factors from 2 to .
7 Conclusions and perspectives
The thermal-viscous disc instability model of dwarf novae and low-mass X-ray binary transients can describe many aspects of the outburst cycle of these systems if it is complemented by additional physical mechanisms not taken into account in the original version. Mass-transfer rate variations (intrinsic or irradiation-induced), disc heating by stream impact and tidal torques, disc irradiation by the the white dwarf, disc truncation by magnetic fields or by evaporation, enhanced-by-tidal-torques angular-momentum removal, are physical processs which when taken into account in the appropriate circumstances, can in principle reproduce the wealth of dwarf-nova outburst light-curves and spectral variations. Disc (self)irradiation and inner truncation due to evaporation must be taken into account for the model to reproduce some simple properties of LMXBTs light-curves. Clearly, additional structures such as accretion-disc coronae and warps should be incorporated into the model if more complex or ‘non-standard’ lightcurve shapes are to be reproduced. Since disc X-ray irradiation plays a dominant role in LMXBT behaviour, variations of X-ray spectra should be included in the model.
The Achilles’ heel of the DIM is quiescence. This phase of the outburst cycle is not accurately described by the model and some of its basic assumptions might have to be drastically revised. This is the most fundamental problem which must be solved before the model can be considered a credible description of disc outbursts in close binaries.
From the very beginning, the DIM’s main problem has been the origin of the angular-momentum transport and energy dissipation mechanisms. Although it is often called the “viscosity problem”, its solution might imply that other than viscous mechanisms are at play.
Inner disc evaporation is an important ingredient of the ‘generalized’ DIM, especially when it is applied to LMXBTs. Although several models have been proposed, the exact nature of inner disc truncation still awaits eplanation.
In addition one can list the following more detailed problems that remain to be solved and questions to be answered (or answered unequivocally):
-
•
What produces superoutbursts? The most probable answer to this question would come from a ‘hybrid’ model combining tidal torques and mass-transfer enhancements (Smak 1996).
-
•
Why do recurrence times of SS Cyg and U Gem differe by a factor 2.5?
-
•
Why is the recurrence time of WZ Sge so long?
-
•
The origin and evolution of warps in accretion discs during outbursts. This problem is of course more general because steady discs should also be warped.
-
•
How is matter fed into the disc? There is some observational evidence that in dwarf novae during decline from outburst (see e.g. Steeghs et al. 2000) and in quiescence (absence of hot spot in HT Cas - Wood, Horne & Vennes 1992) part of the stream overflows the outer disc rim. Then it should hit the disc somewhere close to the circulation radius (Lubow 1989). Similar ideas were proposed for LMXBs by Frank, King & Lasota (1987).
-
•
What are the reasons for secondary outbursts in WZ Sge-type dwarf novae and LMXBTs? Despite similarities between the two types of systems (Lasota 1996a,b; Kuulkers et al. 1996) the reasons could be different.
-
•
Why do some LMXBTs after many years of quiescence enter into an active phase during which several outbursts occur within a couple of years (e.g. GRO J1655-40)?
-
•
Does the thermal instability produce only outbursts? Can it produce more gentle luminosity modulations as has been observed by e.g. Dubus et al. (1997)? The answer seems to ‘yes’ (Dubus & Lasota 2001).
-
•
What is the origin of the various spectral components of the quiescent emission from LMXBTs? The answer to this question is important not only for testing the DIM but for deciding whether quiescent LMXBTs which are supposed to host black-holes because of high masses of the accreting bodies, show evidence for event horizons as claimed by Narayn, Garcia & McClintock (1997; see also Lasota & Hameury 1998; Menou et al. 1999c; Garcia et al. 2000).
-
•
How are accretion disc X-rays irradiated? What is the geometry? What are the respective roles of the corona and warp.
-
•
In many (all ?) black hole X-ray binaries powerful jets are observed in what is called the “low/hard X-ray state” (see Fender 2000 for a review). Do these outflows influence the outbursts and how? Of course to answer these questions one should presumably understand what produces jets.
Acknowledgments
I am most grateful to Jean-Marie Hameury, Guillaume Dubus and Kristen Menou, without whom this article could not have been written. The reasons for this are evident: a quick look at this article shows how much I owe them. GD, JMH and KM also read various preliminary versions of this article and made very useful comments and suggestions. I express my gratitude to Joe Smak who taught me so many things about the disc instability model. Thanks are also due to Valentin Buat-Ménard, Phil Charles, Anya Esin, Jean-Marc Huré, Rob Hynes, Irit Idan, Erik Kuulkers, Jeff McClintock, Ramesh Narayan, Giora Shaviv, Brian Warner and Insu Yi with whom I collaborated on disc-instability models of dwarf novae and X-ray transients. Discussions over the years with Marek Abramowicz, Steve Balbus, Didier Barret, Axel Brandenburg, John Cannizzo, Wolfgang Duschl, Juhan Frank, Charles Gammie, Carole Haswell, John Hawley, Keith Horne, Andrew King, Wojciech Krzemiński, Emmie Meyer-Hofmeister, Friedrich Meyer, Shin Mineshige, Yoji Osaki, Bohdan Paczyński, John Papaloizou, Hans Ritter, Oded Regev, Rob Robinson, Sławek Ruciński, Henk Spruit, Caroline Terquem, Craig Wheeler, Janet Wood and Jean-Paul Zahn were of great help. This work was supported in part by the Programme National de Physique Stéllaire of the CNRS.
References
- Abramowicz et al., (1995) Abramowicz M.A., Chen X.-M., Kato S., Lasota J.-P., Regev O. 1995, ApJ 438, L37
- Armitage et al., (2000) Armitage P.J., Reynolds C.S., Chiang J., 2000, ApJ, in press, astro-ph/0007042
- Balbus & Hawley, (1998) Balbus S.A., Hawley J.F., 1998, Rev.Mod.Phys., 70, 1
- Balbus & Papaloizou, (1999) Balbus S.A., Papaloizou J.C.B., 1999, ApJ, 521, 650
- Baptista & Catálan, (2000) Baptista R., Catalán M.S., 2001, MNRAS, in press, astro-ph/
- Baptista et al., (2000) Baptista R., Catalán M.S., Costa L., 2000, MNRAS, 316, 529
- Baraffe & Kolb, (1999) Baraffe I., Kolb U., 1999, MNRAS, 309, 1034
- Barret & Vedrenne, (1994) Barret D., Vedrenne G. , 1994, ApJS, 92, 505
- Bath & van Paradijs, (1983) Bath G.T, van Paradijs J., 1983, Nature, 305, 33
- Begelman et al., (1983) Begelman M.C., McKee C.F., Shields G.A., 1983, ApJ, 271, 70
- Bildsten & Rutledge, (2000) Bildsten L., Rutledge R.E. 2000, ApJ 541, 980
- Brown & Bildsten, (1998) Brown E.F., Bildsten L., Rutledge R.E. 1998, ApJ 504, L95
- Buat-Ménard et al. , (2001a) Buat-Ménard V., Hameury J.-M., Lasota J.-P., 2001a, A&A, in press, (BMHL)
- Buat-Ménard et al. , (2000b) Buat-Ménard V., Hameury J.-M., Lasota J.-P., 2001b, A&A, in press
- Campana et al., ( 1998) Campana S., Stella L., Mereghetti S. et al., 1998, ApJ, 499, L65
- (16) Cannizzo J.K., 1993a, in Accretion Disks in Compact Stellar Systems, ed. J. Wheeler World Scientific, Singapore, p. 6
- (17) Cannizzo J.K., 1993b, ApJ, 419, 318
- (18) Cannizzo J.K., 1998a, ApJ, 494, 318
- (19) Cannizzo J.K., 1998b, in: Wild Stars in the Old West: Proceedings of the 13th North American Workshop on Cataclysmic Variables and Related Objects, S. Howell, E. Kuulkers, C. Woodward, (Eds.), San Francisco, ASP, 308
- (20) Cannizzo J.K., 2000, ApJ, 534, L35
- (21) Cannizzo J.K., Wheeler J.C. 1984, ApJ, 55, 367
- (22) Cannizzo J.K, Chen W. & Livio M., 1995, ApJ, 454, 880
- (23) Cannizzo J.K., Lee H.M., Goodman J., 1990, ApJ, 351, 38
- (24) Cannizzo J.K., Ghosh P., Wheeler J.C., 1982, 260, L83
- (25) Cannizzo J.K., Wheeler J.C., Ghosh P., 1985, in Proceedings of the Cambridge Workshop on Cataclysmic Variables and Low- Mass X-ray Binaries, D.Q. Lamb, J. Patterson (Eds.), Reidel, Dordrecht, p. 307
- (26) Caunt S.E., Tagger M., 2001, A&A, submitted, astro-ph/0101293
- (27) Chandler A.M., Rutledge R.E., 2000, ApJ in press, astro-ph/0010555
- (28) Chen W., Shrader C.R., Livio M., 1997, ApJ, 491, 312
- (29) Colpi M., Geppert U., Page D., Possenti A., 2000, ApJL submitted, astro-ph/0010572
- (30) Dempsey R.C., Linsky J.L., Fleming T.A., Schmitt J.M.H. 1993 ApJSS 86, 599
- (31) Done C., Nayakshin S., 2000, ApJ, in press
- (32) Dubus G., 1998, Thèse de doctorat, Université Paris 7
- (33) Dubus G., 2001, A&A, in preparation
- (34) Dubus G., Lasota J.-P., 2001, in preparation
- (35) Dubus G., Menou K., Esin, A.A., 2000, in preparation
- (36) Dubus G., Lasota J.-P., Hameury J.-M., Charles P.A., 1999, MNRAS, 303, 139
- (37) Dubus G., Hameury J.-M., Lasota J.-P., 2001, A&A, in press
- (38) Dubus G., Charles P.A., Long K.S., Hakala P.J., 1997, ApJ, 490, L47
- (39) Eracleus M,. Halpern J., Patterson J. 1991, ApJ 382, 290
- (40) Esin, A.A., McClintock J.E., Narayan, R., 1997, ApJ, 489, 865
- (41) Esin, A.A., Lasota, J.-P., Hynes, R.I. 2000a, A&A, 354, 987
- (42) Esin A.A., Kuulkers E., McClintock J.E., Narayan R., 2000b, ApJ, 532, 1069
- (43) Faulkner J., Lin D.N.C., Papaloizou J.C.B., 1983, MNRAS, 205, 359
- (44) Fender R., 2000, in: Proceedings of the 3rd microquasar workshop, A.J. Castro-Tirado, J.Greiner, J.M. Paredes (Eds.), AASS, in press, astro-ph/0010613
- (45) Fleming T.A., Gioia I.M., Maccacaro T. 1989, ApJ 340, 1011
- (46) Frank J., King A.R., Lasota J.-P., 1987, MNRAS, 178 , 137
- (47) Frank J., King A.R., Raine D., 1992, Accretion Power in Astrophysics. Cambridge University Press, Cambridge
- (48) Friend M.T., Martin J.S., Connon-Smith R., Jones D.H.P., 1990, MNRAS, 246, 637
- (49) Gammie C.F., Menou K., 1998, ApJ, 492, L75
- (50) Gänsicke B.T. et al., 1999, A&A, 347, 178
- (51) Garcia M.R., McClintock J.E., Narayan R., et al. 2000, ApJL, submitted, astro-ph/0012452
- (52) Gilfanov M., Revnivtsev M., Sunyaev R., Churazov E., 1998, A&A, 338, 83
- (53) Gontikakis C., Hameury J.-M., 1993, A&A, 271, 118
- (54) Gu P.G., Vishniac, E.T., Cannizzo J.K., 2000, ApJ, 53, 380
- (55) Hameury J.-M., King, A.R., Lasota J.-P., 1986, A&A, 161, 71
- (56) Hameury J.-M., Lasota J.-P., Huré J.-M., 1997, MNRAS, 287, 937
- (57) Hameury J.-M., Lasota J.-P., Dubus G., 1999, MNRAS, 303, 39
- (58) Hameury J.-M., Lasota, J.-P., Warner, B., 2000, A&A, 353, 244
- (59) Hameury J.-M., Lasota J.-P., McClintock J.E., Narayan, R. 1997,ApJ, 489, 234
- (60) Hameury J.-M., Menou K., Dubus G., Lasota J.-P., Huré J.-M., 1998, MNRAS, 298, 1048, (HMDLH)
- (61) Harrop-Allin M.K., Warner B., 1996, MNRAS, 279, 219
- (62) Hawley J.F., 2000a, ApJ, 258, 452
- (63) Hawley J.F., 2000b, ApJ, submitted, astro-ph/0011501
- (64) Hessman F.V., Gänsicke B.T., Mattei J.A., 2000, A&A, in press
- (65) Hirose M., Osaki Y., 1990, PASJ, 42, 135
- (66) Homer L., Charles P., 1998, NAstr., 3, 345
- (67) Honma F. 1996, PASJ 48, 77
- (68) Horne K., 1991, in: Bertout C., Collin S., Lasota J.-P., Tran Than Van J., (Eds.), Structure and Emission Properties of Accretion Disks. Editions Frontières, Gif-sur-Yvette, p. 3
- (69) Horne K., Wood J.H., Stiening R.F. 1991, ApJ, 378, 271
- (70) Hoshi R., 1979, Prog. Theor. Phys. 61, 1307
- (71) Hoshi R., 1984, PASJ, 36, 785
- (72) Hubeny I., 1991, in: Bertout C., Collin S., Lasota J.-P., Tran Than Van J., (Eds.), Structure and Emission Properties of Accretion Disks. Editions Frontières, Gif-sur-Yvette, p. 227
- Huré et al., (1994) Huré J.-M., Collin-Souffrin S., Le Bourlot J., Pineau des Forêts G., 1994, A&A, 290, 19
- (74) Ichikawa S., Osaki Y., 1992, PASJ, 44, 15
- (75) Ichikawa. S., Osaki Y., 1994, in Duschl W.J. et al. eds., Theory of Accretion Disks-2, Kluwer, Dordrecht, p. 169
- (76) Ichikawa S., Hirose M., Osaki Y., 1993, PASJ, 42, 243
- (77) Idan I., Shaviv G., 1996, MNRAS, 281, 604
- (78) Idan I., Lasota J.-P., Hameury J.-M., Shaviv G., 1999, Phys. Rep. 311, 213
- (79) Ioannou Z., Naylor T., Welsh W.F., Catalán M.S., Worraker W.J., James N.D., 1999, MNRAS 310, 398
- (80) Kato S., Nakamura K.E. 1999, PASJ 50, 559
- (81) Kato T. et al., 1999, in: S. Mineshige, J.C. Wheeler (Eds.), Disk Instabilities in Close Binaries - 25 years of the Disk Instability Model, Universal Academy Press, Tokyo, p. 191
- (82) Kim S., Wheeler J.C., Mineshige S., 1999, PASJ, 51, 393
- (83) King A.R., 1997, MNRAS, 288, L16
- (84) King A.R., 1998, MNRAS, 296, L45
- (85) King A.R. 1999, Phys. Rep. 311, 337
- (86) King A.R., Cannizzo J.K., 1998, ApJ, 499, 348
- (87) King A.R., Ritter H., 1998, MNRAS, 293, 42
- (88) King A.R., Ritter H., 1999, MNRAS, 309, 253
- (89) de Kool M., Wickramasinghe, D., 1999, MNRAS, 307, 449
- (90) Kornet K., Różyczka M., 2000, Acta Astron., 50, 163, astro-ph/0003169
- (91) Kuulkers E., Howell S.B., van Paradijs J., 1996, ApJ, 462, 87
- (92) Lasota, J.-P., 1996, in: van Paradijs, J., van den Heuvel, E.P.J, Kuulkers, E. (Eds.), Compact Stars in Binaries, IAU Symp. 165, Kluwer, Dordrecht, p. 43
- (93) Lasota, J.-P., 1996, in: A. Evans & J.H. Woods, (Eds.), Cataclysmic Variables and Related Objects, Kluwer, Dordrecht, p. 385
- (94) Lasota, J.-P., 1999, in: S. Mineshige, J.C. Wheeler (Eds.), Disk Instabilities in Close Binaries - 25 years of the Disk Instability Model, Universal Academy Press, Tokyo, p. 191
- (95) Lasota, J.-P., 2000a, A&A, 360, 575
- (96) Lasota J.-P., 2000b, in: Black Holes in Binaries and Galactic Nuclei: Diagnostics, Demography and Formation, eds. L. Kaper, E.P.J. van den Heuvel, and P.A. Woudt, Springer, Berlin, in press
- (97) Lasota J.-P., Hameury J.-M., 1998, in Holt S., Kallman T., eds, Accretion Processes in Astrophysical Systems - Some Like it Hot, Proceedings of the 8th Annual October Conference in Maryland. AIP, p. 351
- (98) Lasota J.-P., Hameury J.-M., Huré J.-M., 1995, A&A, 302, L29
- (99) Lasota J.-P., Narayan R., Yi I., 1996, A&A, 314, 813
- (100) Lasota J.-P., Kuulkers E., Charles P., 1999, MNRAS, 305, 473
- (101) Lin D.N.C., Papaloizou J.C.B., Faulkner J., 1985, MNRAS, 212, 105
- (102) Liu B.F., Meyer F., Meyer-Hofmeister E. 1997, A&A 328, 247
- (103) Liu B. F., Yuan W., Meyer F., Meyer-Hofmeister E., Xie G. Z. 1999, ApJ 527, 17
- (104) Livio, M., 1999, in: J.A. Sellwood, J. Goodman (Eds.), Astrophysical Discs - An EC Summer School, ASP Conference Series Vol. 160, p. 33
- (105) Livio M., Spruit H.C., 1991, A&A, 252, 189
- (106) Livio M., Pringle J.E., 1992, MNRAS, 259, 23P
- (107) Livio M., Pringle J.E., 1994, ApJ, 427, 956
- (108) Lubow S.H., 1989, ApJ, 340, 1064
- (109) Lubow S.H., 1991, ApJ, 381, 259
- (110) Lubow S.H., 1994, in: W.J. Duschl et al. (Eds.), Theory of Accretion Disks-2, Kluwer, Dordrecht, p. 109
- (111) Ludwig K., Meyer F., 1998, A&A, 329, 559
- (112) Lyubarskii Y.E., Shakura N.I., 1987, SvAL, 13, 386
- (113) Lyutyi V.M., Sunyaev R.A., 1976, SvA, 20, 290
- (114) Manmoto T., Kato S., Nakamura K.E., Narayan R. 2000, ApJ 529, 127
- (115) Mason K.O., Cordova F.A., Watson M.G., King A.R., 1988, MNRAS, 232, 779
- (116) Mattei J.A., Saladyga M., Waagen W.O., Jones C.M., 1987, AAVSO Monogr. No. 2
- (117) Mauche C. W., 1996, in: Bowyer S., Malina R.F., (Eds.), Astrophysics in Extreme Ultraviolet, IAU Coll. 152, Kluwer, Dordrecht, p. 317
- (118) Mauche C.W., Raymond J.C., Mattei J.A., 1995, ApJ, 446, 842
- (119) Menou K, 2000a, Science, 208, 2022
- (120) Menou K, 2000b, ApJ, submitted, astro-ph/0007185
- (121) Menou K, McClintock J.E., 2000, ApJ, submitted, astro-ph/0010430
- (122) Menou K, Quataert E., 2000, ApJ, in press
- (123) Menou K., Hameury J.-M., Stehle R., 1999a, MNRAS, 305, 79
- (124) Menou K., Narayan R., Lasota J.-P., 1999b, ApJ, 513, 811
- (125) Menou K., Hameury J.-M., Lasota J.-P., Narayan R., 2000, MNRAS, 314, 498
- (126) Menou K., et al., 1999c, ApJ, 520, 276
- (127) Meyer F., 1984, A&A, 131, 303
- (128) Meyer F., Meyer-Hofmeister E., 1983a, A&A 121, 29
- (129) Meyer F., Meyer-Hofmeister E., 1983b, A&A, 128, 420
- (130) Meyer, F., Meyer-Hofmeister, E., 1994, A&A 288, 175
- (131) Meyer F., Meyer-Hofmeister E., 1983c, A&A, 104, L10
- (132) Meyer F., Meyer-Hofmeister E., Liu F.K. 1996, in: Röntgenstrahlung from the Universe, eds. H.U. Zimmermann, J. Trümper, H. Yorke, H., MPE Report 263, Garching p. 163
- (133) Meyer-Hofmeister, E., Meyer F., Liu, B.F. 1998, A&A, 339, 507
- (134) Meyer-Hofmeister, E., Meyer F., 2000, A&A, 355, 1073
- (135) Milgrom M., 1978, A&A, 67, 25
- (136) Mineshige S., Osaki Y., 1983, PASJ, 35, 377
- (137) Mineshige S., Osaki Y., 1985, PASJ, 37, 1
- (138) Mineshige S., Wheeler J.C., 1989, ApJ, 343, 241
- (139) Mineshige S., Yamazaki T., Ishizaka C., 1993, PASJ, 45, 707
- (140) Narayan R., Yi I. 1995, ApJ 444, 231
- (141) Narayan R., Barret D., McClintock J.E. 1997a, ApJ 482, 448
- (142) Narayan R., McClintock J.E., Yi I. 1996, ApJ 451, 821
- (143) Narayan R., Garcia M.R, McClintock J.E. 1997b, ApJ 478, L79
- (144) O’Donoghue D., 1986, MNRAS, 220, 23
- (145) Ogilvie G.I, Dubus G., 2001, MNRAS, in press
- (146) Oppenheimer B.D., Kenyon S.J., Mattei J.A., 1998, AJ 115, 1175
- (147) Orosz J.A., Remillard R.A., Bailyn C.D., McClintock J.E., 1997, ApJ, 478, L83
- (148) Osaki Y., 1974, PASJ, 26, 429
- (149) Osaki Y., 1985, A&A, 144, 369
- (150) Osaki Y., 1989, PASJ, 41, 1005
- (151) Osaki Y., 1995a, PASJ, 47, 47
- (152) Osaki Y., 1995b, PASJ, 47, L25
- (153) Osaki Y., 1995c, PASJ, 47, L11
- (154) Osaki Y., 1996, PASP, 108, 39
- (155) Paczyński B., 1965, Acta Astr. 15, 305
- (156) Paczyński B., 1977, in: Nonstationary Evolution of Close Binaries, ed. A.N. Żytkow, PWN, Warszawa, p. 89
- (157) Papaloizou J., Pringle J.E., 1977, MNRAS, 181, 441
- (158) Papaloizou J., Pringle J.E., 1985, MNRAS, 217, 387
- (159) Patterson J., 1984, ApJS, 54, 443
- (160) Patterson J., Raymond J.C., 1985, ApJ, 292, 535
- (161) Pringle J.E., 1981, ARAA, 19, 137
- (162) Pringle J.E., Savonije G.J., 1979, MNRAS, 187, 777
- (163) Quataert E., Narayan R. 1999, ApJ 520, 298
- (164) Richards H.T. 1996, ApJ 462, 404
- (165) Różyczka M., Spruit H., 1993, ApJ, 417, 677
- (166) Rutten R.G.M., Kuulkers E., Vogt N., van Paradijs J., 1992, A&A, 265, 159
- (167) Rutledge R.E., Bildsten L., Brown E.F. et al. 2000, ApJ, in press, astro-ph/0012400
- (168) Schreiber M., Gänsicke B.T., Hessman F.V., 2000, A&A, 358, 221
- (169) Shahbaz T., Bandyopadhyay R.M., Charles P.A. et al., 1998, MNRAS, 300, 1035
- (170) Shakura N.I., Sunyaev R.A., 1973, A&A, 24, 337
- (171) Shaviv G., Wehrse R., 1986, A&A, 159, L5
- (172) Shaviv G., Werhse R., 1991, A&A, 251, 117
- (173) Shaviv, G., Wickramasinghe, D., Wehrse, R., 1999, A&A 344, 639
- (174) Smak J., 1971, Acta Astr. 21, 15
- (175) Smak J., 1982, Acta Astr., 32, 199
- (176) Smak J., 1983, ApJ, 272, 234
- (177) Smak J., 1984a, Acta Astr., 34, 93
- (178) Smak J., 1984b, Acta Astr., 34, 161
- (179) Smak J., 1984c, PASP, 96, 5
- (180) Smak J., 1987, A&SS 131, 497
- (181) Smak J., 1989, Acta Astr. 39, 317
- (182) Smak J., 1991, Acta Astr., 41, 269
- (183) Smak J., 1993, Acta Astr., 43, 101
- (184) Smak J., 1994, Acta Astr., 44, 265
- (185) Smak J., 1995, Acta Astr., 45, 355
- (186) Smak J., 1996, in: A. Evans & J.H. Woods, (Eds.), Cataclysmic Variables and Related Objects, Kluwer, Dordrecht, p. 45
- (187) Smak J., 1998, Acta Astr., 48, 677
- (188) Smak J., 1999a, Acta Astr., 49, 383
- (189) Smak J., 1999b, Acta Astr., 49, 391
- (190) Smak J., 2000, NAR, 44, 171
- (191) Steeghs D., 2000, in: Proceedings of the Astro-tomography workshop, Brussels, H.Boffin, D.Steeghs, J.Cuypers (Eds.), Springer-Verlag Lecture Notes in Physics Series, in press, astroph/0012353
- (192) Steeghs D., O’Brien K., Horne K. 2000, MNRAS in press, astro-ph/0011489
- (193) Szkody P., Mattei J.A., 1984, PASP, 96, 988
- (194) Tanaka Y., Shibazaki, N. 1996, ARAA 34, 607
- (195) Terquem C., 2000, in: R.D. Mathieu & Zinnecker, (Eds.), The Formation of Binary Stars, ASP Conf. Series, in press
- (196) Trimble V., Aschwanden M.J., 2000, PASP 112, 434
- (197) Truss M.R., Murray J.R., Wynn G.A., Edgar R.G., 2000, MNRAS, 319, 467
- (198) Tuchman Y., Mineshige S., Wheeler J.C., 1990, ApJ, 359, 164
- (199) Tylenda R., 1981, Acta Astr., 31, 267
- (200) van Paradijs J., Verbunt F. 1984, in Woosley S.E., ed., High Energy Transients in Astrophysics, AIP Conf. Proc., New York, p. 49
- (201) van Paradijs J., 1983, A&A, 125, L16
- (202) van Paradijs J., 1996, ApJ, 464, L139
- (203) van Paradijs J., McClintock J.E., 1995, in Lewin W.H.G., van Paradijs J., van den Heuvel E.P.J., eds., X-ray Binaries. Cambridge University Press, Cambridge, p. 58
- (204) van Teeseling, A. 1997, A&A, 319, 25
- (205) van Teeseling, A., Beuermann, K., Verbunt F. 1996, A&A, 315, 467
- (206) Vishniac E.T., 1997, ApJ, 482, 414
- (207) Vishniac E.T., Wheeler J.C., 1996, ApJ, 471, 921
- (208) Vogt N., 1981, Mitt. Astr. Gesell., 57, 79
- (209) Vogt N., 1983, A&A, 128, 29
- (210) Vrielmann S., 2000, in: Proceedings of the Astro-tomography workshop, Brussels, H.Boffin, D.Steeghs, J.Cuypers (Eds.), Springer-Verlag Lecture Notes in Physics Series,
- (211) Warner B., 1987, MNRAS, 227, 23
- (212) Warner B., 1995a, Cataclysmic Variable Stars, Cambridge University Press, Cambridge
- (213) Warner, B., 1995b, Ap&SS 226, 187
- (214) Warner, B., 1998, in press, astro-ph/0012263 in: S. Howell, E. Kuulkers, C. Woodward (Eds.), Wild stars in the old west: proceedings of the 13th North American workshop on cataclysmic variables and related objects, ASP Conf. Ser. 137, San Francisco, p. 2
- (215) Warner B., Livio M., Tout C.A., 1996, MNRAS, 315, 467
- (216) Webb N.A., Naylor T., Ioannou Z., Worraker W.J., Stull J., Allan A., Fried R., James N.D., Strange D.,
- (217) Wheatley P.J., Mauche C.W., Mattei J.A. 2000, poster: www.star.le.ac.uk/p̃jw/
- (218) Whitehurst R., 1988, MNRAS, 232, 35
- (219) Whitehurst R., King A.R., 1991, MNRAS, 249, 25
- (220) Whitehurst R., 1994, MNRAS, 266, 35 1999, MNRAS 310, 407
- (221) Wolf S., Mantel K.H., Barwig H., Schoembs R., Baernbantner O., 1993, A&A, 273, 160
- (222) Wood J., Horne K., Vennes S., 1992, ApJ, 385, 294
- (223) Wood J.H., Horne K., Berriman G., Wade R. 1989a, ApJ, 341, 974
- (224) Wood J.H., Horne K., Vennes S., 1992, ApJ, 385, 294
- (225) Wood J., Horne K., Berriman G., Wade R., O’Donoghue D., Warner B., 1986, MNRAS, 219, 629
- (226) Wood J.H., et al., 1989b, MNRAS, 239, 809
- (227) Wood J.H., Naylor T., Hassal B.J.M., Ramseyer T.F. 1995, MNRAS 273, 772
- (228) Zahn J.-P., 1991, in: Bertout C., Collin S., Lasota J.-P., Tran Than Van J., (Eds.), Structure and Emission Properties of Accretion Disks. Editions Frontières, Gif-sur-Yvette, p. 87
- (229) Zhang S.N., Yu W., Zhang W. 1998, ApJ, 494, L71
Appendix A APPENDIX
Dubus (1998) obtained the following fits of (these fits correspond to the case called “optically thick” in HMDLH):
| (66) | |||||
| (67) | |||||
of the corresponding accretion rates:
| (68) | |||||
| , | (69) | ||||
of the critical effective temperatures:
| (70) | |||||
| (71) | |||||
and critical midplane temperatures:
| (72) | |||||
| (73) | |||||
For a second critical point appear on the lower branch of the -curve (Sect. 3.1). The critical surface densities and accretion rates can be represented as:
| (74) | |||||
| (75) | |||||
| (76) | |||||
| , | (77) | ||||
the critical effective temperatures as:
| (78) | |||||
| (79) | |||||
and the critacl midlplane temperature can be fitted by:
| (80) | |||||
| . | (81) | ||||