Photometric and kinematic studies of open star clusters
We present CCD photometry and proper motion studies of the three open star clusters NGC 4103, NGC 5281, and NGC 4755 ( Cru). By fitting isochrones to the colour magnitude diagrams, we found that all three objects are young open star clusters with ages of at most . They are located at distances from approx. to , derived from distance moduli ranging from to . We combined membership determinations based on proper motions and statistical field star subtraction to derive the initial mass function (IMF) of the clusters. The shape of the IMFs could be represented by power laws with exponents of for NGC 4103, for NGC 5281, and for NGC 4755, when – as a reference – Salpeter’s (salpeter (1955)) value would be . These results agree well with other IMF studies of open star clusters.
Key Words.:
open clusters and associations: individual: NGC 4103; NGC 5281; NGC 4755 – astrometry – stars: kinematics – Hertzsprung-Russell and C-M diagrams – stars: luminosity function, mass function1 Introduction
We continue our series of studies of open star clusters and present results on three clusters of the southern hemisphere, NGC 4103, NGC 5281, and NGC 4755 ( Cru).
Our goals are to determine the basic parameters age, distance, and reddening of the clusters, and the luminosity functions (LFs) and initial mass functions (IMFs) of the target objects. For reviews of the IMF see, e.g., Scalo (scalo1 (1986, 1998)). Restricted to certain mass intervals, the IMF can be described by a power law in the form . In this notation the “classical” value found by Salpeter (salpeter (1955)) for the Solar neighbourhood would be . According to Scalo (scalo2 (1998)), we can expect our values for to be located within the interval , a range which is valid for the intermediate mass range of .
For open star clusters the number of field stars in the region of the cluster is normally of the same order of magnitude as the number of cluster members. Therefore it is essential to subtract the field stars before determining the IMF to obtain a reliable mass function. This subtraction is performed by a combination of membership determination with stellar proper motions and a statistical field star subtraction on the basis of the colour magnitude diagrams (CMDs).
NGC 4103 is located at , . It is dominated by a handful of moderately bright stars with magnitudes around and is not very richly populated. According to the Lyngå (lynga (1987)) catalogue, it has a diameter of and an age of Myr. Besides some earlier publications on photographic photometry (Becker becker (1959), Wesselink wesselink (1969)), the cluster was recently studied with CCD photometry by Sagar & Cannon (sagar4103 (1997)). Proper motions were studied before by King (king4103 (1979)). With our work, we will be able to improve the previous results: We reach fainter limiting magnitudes than the previous photometric studies. For the astrometric part, we have a larger difference between first and second epoch plate material. In addition, we had the possibility to digitise and reduce entire photographic plates, which results in more precise and reproducible data. We therefore expect a higher precision of our results than in the earlier studies. Finally, the combination of photometry and astrometry will provide a better understanding of the stars which physically belong to the cluster. Our work is the first IMF study for NGC 4103.
NGC 5281 is located at , . Four bright (up to ) stars almost located in one line on the sky are striking. No large population of faint stars is visible. One only finds sparse photometric data on this cluster, e.g. the photoelectric photometry of 18 stars by Moffat & Vogt (moffatvogt (1973)). It has not yet been the target of CCD photometry or a proper motion study.
NGC 4755 (also known as Cru or Herschel’s Jewel Box) is located at , . The cluster is mentioned with an angular diameter of in Lyngå (lynga (1987)). It has been the subject of various studies before, including CCD photometry (Sagar & Cannon sagar4755 (1995)) and proper motion studies (King king4755 (1980)). However, the same reasons as for NGC 4103 hold for revisiting this object. The IMF of NGC 4755 has not yet been investigated. With approx. 10 stars with , NGC 4755 is an easy and prominent object in the southern hemisphere even for binoculars. The designation “Jewel Box” results from the bright stars with one of them being very red () whereas the others show blue colours with .
2 Photometry
The CCD observations of NGC 4103 and NGC 5281 were made from April 25 to 30, 1994, with the 1.54 m Danish telescope at ESO, La Silla, equipped with DFOSC and the pixel CCD chip ESO # 28. The pixel size of the detector is . The resolution of this configuration is resulting in a field of view of . The observations were done using Bessell , , and filters. The seeing during all observations was of the order of to . The NGC 4755 data were taken with the same telescope only in and filters from February 5 to 8, 1996, with a LORAL chip with a pixel size of . Since the outer regions of the images showed only a very limited signal, the usable field of view is approx. or . The seeing of the observations differed from to almost , a value which was reached in one night only.
To cover a sufficiently large area for the cluster and additional field star region, two (NGC 5281, NGC 4755) or three (NGC 4103) CCD fields were observed. These fields were observed in consecutive nights. At least one of the observations of each cluster could be proved to have taken place in photometric conditions. Tables 1 and 2 give an overview of the observations used for this work.
| cluster | field | filter | |||
|---|---|---|---|---|---|
| NGC 4103 | A | ||||
| B | |||||
| C | |||||
| NGC 5281 | A | ||||
| B | |||||
| field | filter | |||||
|---|---|---|---|---|---|---|
| A | ||||||
| B | ||||||
After standard image processing and addition of the images with equal exposure times, PSF photometry was performed with DAOPHOT II (Stetson daophot (1991)) running under IRAF. Before combining the results of the images of different exposure times we deselected objects with too high errors, sharpness, and values according to the DAOPHOT output. The data of one field per cluster were calibrated from instrumental to Johnson magnitudes using standard fields from Landolt (landolt (1992)) which were observed in addition to the objects. The other field(s) were calibrated with the help of the stars in the overlapping regions of the different fields.
After correction of the exposure time to we determined the parameters necessary for the calibration from the following equations:
| (1) | |||||
| (2) | |||||
| (3) |
where stands for the airmass, capital letters for apparent and lower case letters for instrumental magnitudes. The values for the zero points and colour coefficients are listed in Table 3, the extinction coefficients were provided by the Geneva Observatory Photometric Group (see Burki et al. extinkt (1995)). In all nights the extinction was of the order of , , and , respectively.
| NGC 4103 | NGC 5281 | NGC 4755 | |
|---|---|---|---|
| April 26, 1994 | April 28, 1994 | February 5, 1996 | |
2.1 NGC 4103
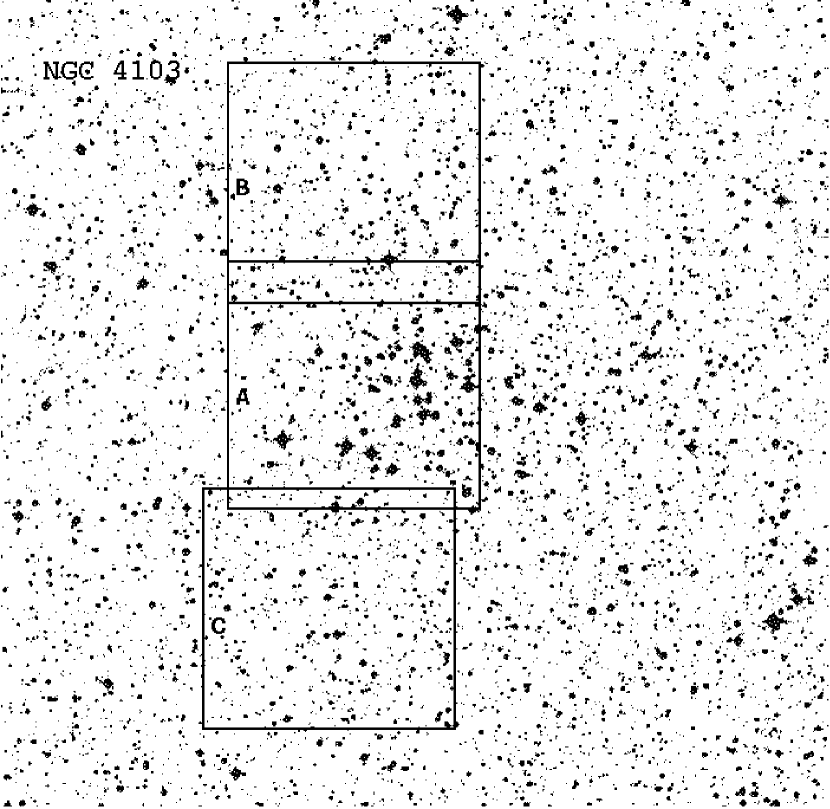
Three fields around this cluster were observed: the first one – hereafter referred to as “field A” – centred slightly east of the cluster’s centre, the second and third ones – “fields B and C” – pointing north and south of this position, respectively. Fields B and C were observed to provide a sufficiently large area which does not contain cluster stars, which is necessary for the statistical field star subtraction. Figure 1 shows a Digitized Sky Survey (DSS) image of the region of NGC 4103 with the location of the three fields marked.
Transformation of instrumental to apparent magnitudes was performed for field C, which was observed under photometric conditions.
Typical internal errors of stars in different magnitude ranges are given in Table 4. In addition, we compared our data with the results of two previous studies: A comparison with the data of Wesselink (wesselink (1969)) showed standard deviations of the order of in all , , and ; the corresponding values for the brighter () stars of the study of Sagar & Cannon (sagar4103 (1997)) are in , in , and in . The entire photometric data are listed in Table 4. Besides our own numbering system, we added the stellar numbers of Wesselink (wesselink (1969)) as a reference.
| [mag] | [mag] | [mag] | |
|---|---|---|---|
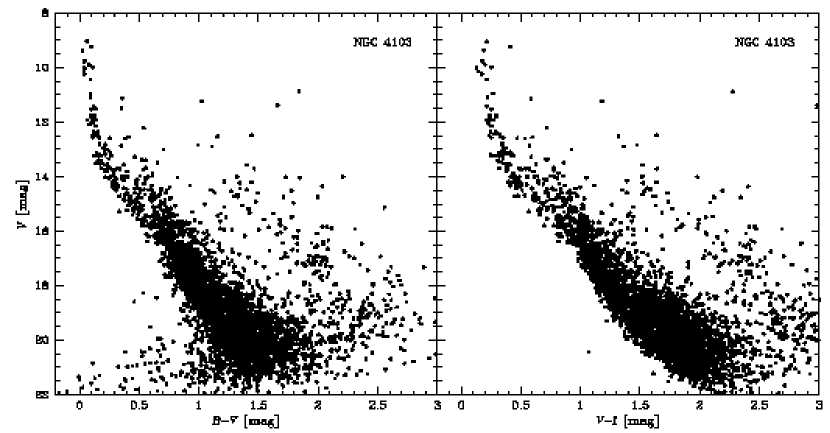
From all data of the three fields, we derived the and colour magnitude diagrams which we present in Fig. 2. The lack of bright red stars already shows at this point that NGC 4103 is a young star cluster. Around mag, an indication for a secondary main sequence is visible. From downwards, another scattered feature approximately parallel to the main sequence, but redder, is visible. These stars likely belong to the field population. As the CMDs are still contaminated with field stars, we postpone the analysis of the properties of the cluster to Sect. 4.1.
2.2 NGC 5281
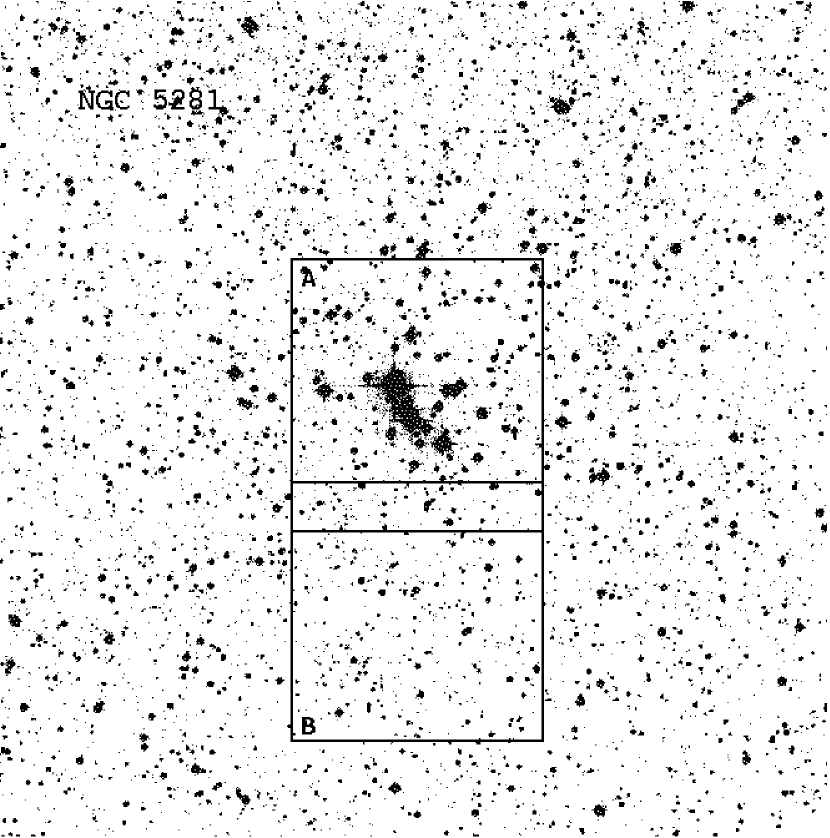
With an angular diameter of according to the Lyngå (lynga (1987)) catalogue, the object is slightly larger than the field of view of the telescope/detector configuration used for the photometric observations. Besides a pointing with the cluster in its centre (“field A”), we observed a region located south of the cluster (“field B”), see Fig. 3.
The first night, when field A was observed, was excellent, but the second one was not photometric. The values for the parameters and from Eqs. (1) to (3) are listed in Table 3. The typical photometric errors (see Table 6) show an uncommon behaviour: Down to , the errors rise up to a few hundredth of a magnitude to drop again in the magnitude range of to . A possible explanation is that the brightest stars could only be measured on the shortest exposures on which the photometric errors increase for brighter stars than on the longer exposures. We could have applied a more stringent error selection, however we accepted these uncertainties to avoid incompleteness in the corresponding magnitude range. An external check of the results with the photoelectric sequence of Moffat & Vogt (moffatvogt (1973)) showed coincidence within and for 15 stars. The brightest star in the field (, according to Moffat & Vogt (moffatvogt (1973)) could not be measured since it was overexposed even on the shortest images. We manually added this star in the CMDs presented in Fig. 4 and marked it with a triangle. As these diagrams are still contaminated with field stars, we will proceed with the analysis in Sect. 4.2. A list of the entire photometry is presented in Table 4 with the star numbers according to Moffat & Vogt (moffatvogt (1973)) included.
| [mag] | [mag] | [mag] | |
|---|---|---|---|
2.3 NGC 4755
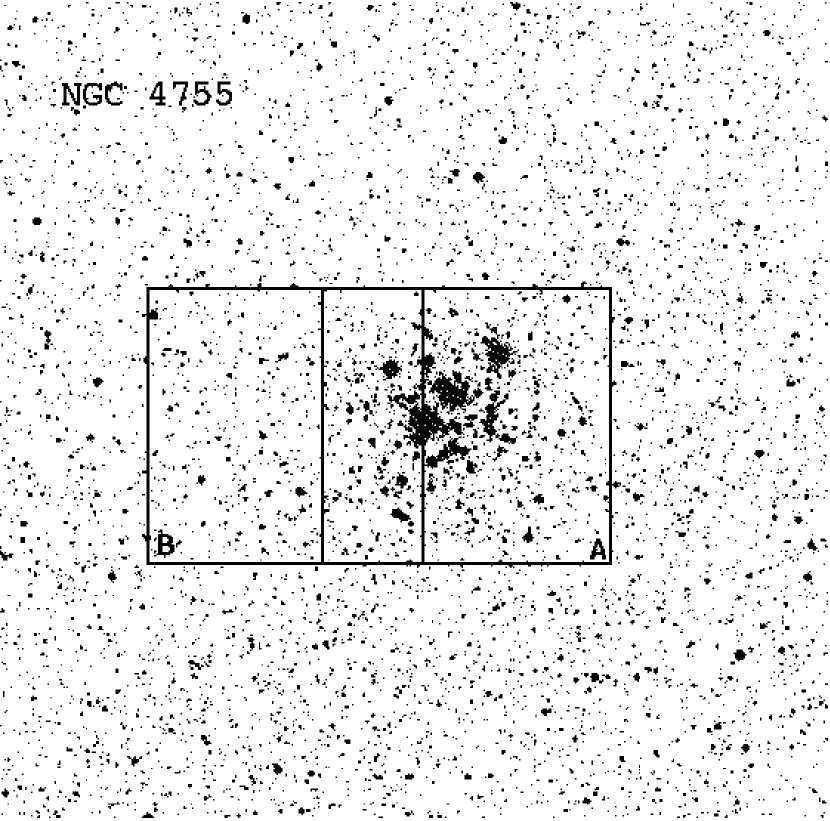
The diameter of NGC 4755 is given as (Lyngå lynga (1987)). Nevertheless, it was sufficient to observe two fields as we could prove with star counts. “Field A” has the cluster in its centre, and “field B” is located east of this position, see Fig. 5.
After calibrating field A with Landolt (landolt (1992)) standard stars, we found that with a linear and rotational transformation of the coordinates the stars in the region overlapping with field B could not well be cross-identified: In case the tolerances were chosen too restrictively, identification only worked out in a small region of the entire overlap, whereas increasing the tolerances led to mis-identification of numerous stars. This phenomenon is most likely caused by distortion in the outer regions of the CCD field. Therefore we decided to adjust the magnitudes and coordinates of field B to field A only with the help of the brightest stars: With their low density the tolerances could be increased without the problem of wrong identification. For our further analyses we used the entire field A and the part of field B which does not overlap with field A to avoid stars to be taken into account twice or not at all.
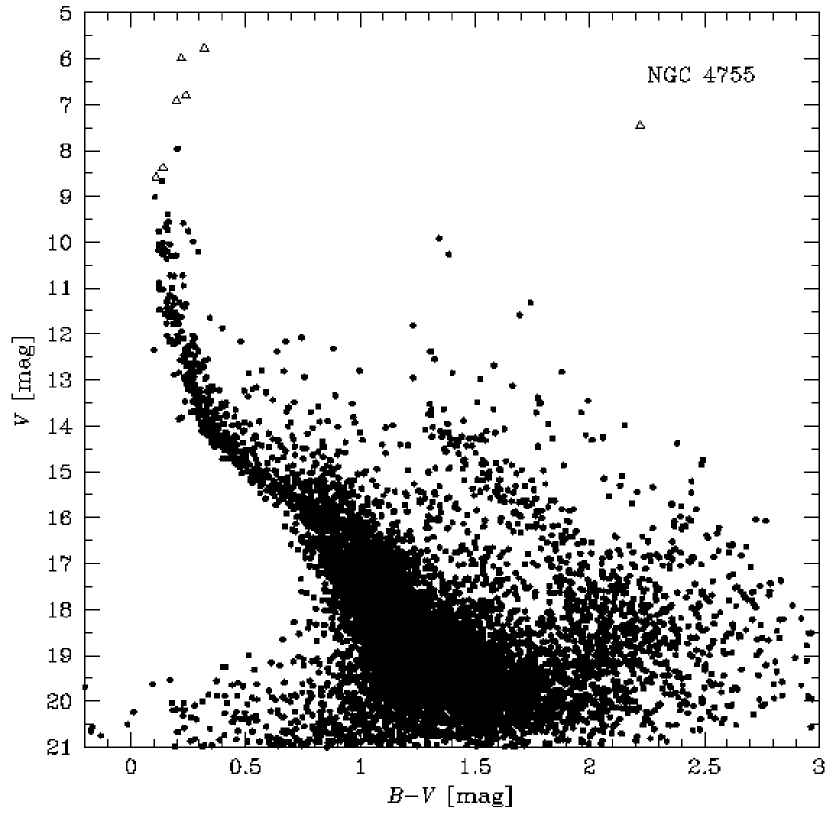
The average internal photometric error is of the order of for stars brighter than in both and and increases below this point towards values of in and in , respectively. The photoelectric photometry of Dachs & Kaiser (dachs (1984)) agrees very well with our data: The magnitudes show a mean difference of , the colour of the common objects of less than . This not only provides a good external control of the quality of our photometry, but their results of stars A, B, C, D, E, I–6, and III–5, which were overexposed on all our images, could replenish our photometry. To discriminate between these and our measurements these stars are marked with open triangles in the CMD in Fig. 6 (and as well in Fig. 12) which contains all stars for which both and magnitudes could be determined. With Table 6 we provide a list of the entire photometric data – excluding the Dachs & Kaiser (dachs (1984)) stars. Again, we added a reference system for stellar numbers – this time taken from Arp & van Sant (arp4755 (1958)). These numbers are encrypted in the following way: Numbers stand for the stars A to Q, the first digit of the numbers represents the quadrant. The two final digits are the running numbers in the notation of Arp & van Sant (arp4755 (1958)). This follows the nomenclature of the WEBDA database (Mermilliod webda (1999)).
Similar to NGC 4103, the CMD of NGC 4755 contains a number of stars in a structure parallel to the lower part of the main sequence. We will discuss these objects in Sect. 4.3.
3 Astrometry
We used the observations from the Carte du Ciel (CdC) project (Brosche brosche (1998)) as first epoch plates for the proper motion studies. The CdC was initiated in 1887 with the goals to provide a catalogue of the entire sky down to magnitude (which later on became the “Astrographic Catalogue”) and a sky chart reaching as far as magnitude. To achieve this goal, the sky was divided into declination zones which were assigned to different observatories worldwide. The observations were made with astrographs on photographic plates of a size of covering a field of view of approx. . The CdC archives provide a – for certain regions of the sky – unique source for proper motion studies, since it is easy to achieve differences between first and second epoch material of 100 years and more.
The regions of our star clusters belong to the declination zone of Sydney Observatory. The fields of the Sydney zone are labelled according to the number of the central star in an internal numbering system. All three clusters are located somewhat near the edge of the fields. As a consequence, NGC 4755 can be found on two different fields. Details about the fields that cover the objects are summed up in Table 9. Different systems of running numbers, which can be distinguished by super- and subscripts added, were used for the individual plates. In contrast to other CdC zones, most of the Sydney plates were not exposed in the typical way with three pointings forming the characteristical triangle pattern for each star (see, e.g., Ortiz-Gil et al. ortizcdc (1998)): Among the plates used for our studies we only found one plate with this property (). Some of the others, too, show up to three observations, but with different exposure times and with the stellar images collocated in one line.
| cluster | field | (2000) | (2000) | ||||
|---|---|---|---|---|---|---|---|
| h | m | s | ∘ | ||||
| NGC 4103 | |||||||
| NGC 4755 | |||||||
| NGC 5281 | |||||||
To replenish the sparse second epoch material, two additional plates of each field were observed with Perth Observatory’s astrograph. Table 10 gives an overview of all the plates used for this work.
Some of the first epoch plates from the Sydney archive were measured manually with Perth Observatory’s Carl Zeiss plate measuring machine, the others were digitised with APM at Cambridge, UK, the second epoch plates from Perth with Tautenburg Plate Scanner (TPS, see Brunzendorf & Meusinger TPS (1998, 1999)), all with a linear resolution of to . More details can be found in Table 10.
| No. | date of obs. | measured | |
| [min] | |||
| Field 1096 (NGC 4103) | |||
| 18.3.1896 | PER | ||
| 3.5.1897 | APM | ||
| 7.5.1901 | APM | ||
| 27.4.1978 | ? | PER | |
| 1.5.1978 | ? | PER | |
| 14.7.1998 | TPS | ||
| 15.7.1998 | TPS | ||
| Field 1282 (NGC 5281) | |||
| 25.3.1897 | APM* | ||
| 6.5.1897 | APM* | ||
| 14.5.1901 | APM | ||
| 14.6.1909 | APM* | ||
| 20.6.1998 | TPS | ||
| 23.6.1998 | TPS | ||
| Field 904 (NGC 4755) | |||
| 14.4.1896 | APM* | ||
| 29.4.1897 | APM* | ||
| 18.6.1901 | APM | ||
| 18.5.1909 | APM (3 exp.) | ||
| 18.3.1980 | APM* | ||
| 18.3.1980 | APM* | ||
| 15.6.1998 | TPS | ||
| 23.6.1998 | TPS | ||
| Field 905 (NGC 4755) | |||
| 16.4.1894 | ? | APM* | |
| 13.3.1896 | APM | ||
| 30.4.1897 | APM | ||
| 18.4.1902 | APM | ||
| 20.6.1998 | TPS | ||
| 23.6.1998 | TPS | ||
To further improve the second epoch data, we included the short CCD exposures in our analysis. The stellar positions were extracted from the CCD frames with DAOPHOT II routines (Stetson daophot (1991)).
Starting with an input catalogue to provide a transformation for the positions and proper motions, coordinates and the proper motions were computed using an astrometric software package developed by Geffert et al. (geffert97 (1997)).
To determine the membership probabilities, we selected areas around the centres of the clusters. The membership probabilities were computed on the base of the proper motions using the method of Sanders (sanders (1971)). The positions of the stars or their magnitudes did not play any role in the derivation of the membership probabilities. For further details we refer to Sanner et al. (n0581paper (1999)).
During an attempt to derive the proper motions with the help of the Hipparcos catalogue (ESA hipp (1997)) we found a strong dependence of the proper motions from the position of the objects on the plates which could not be corrected with the comparably small number of Hipparcos stars. Moreover, for NGC 5281 and NGC 4755 we found a dependence of and – to a much lower extent – on the stellar magnitudes. This effect was variable over the field of view, so that we decided to obtain the proper motions for these two clusters not for the entire plates, but only in the regions of the clusters themselves where we can assume the variations of this magnitude equation to be marginal. As our software to determine proper motions requires an input catalogue, this catalogue had both to be sufficiently dense to provide enough reference stars in the small field and had to cover the entire magnitude range of the photographic plates not to have to extrapolate the magnitude dependence. These conditions – together with good astrometric properties – are only fulfilled by the Guide Star Catalog (GSC). We used its version 1.2 developed by Röser et al. (1998b ).
For NGC 4103, a reduction of the data with the ACT (Urban et al. act (1998)) or Tycho–2 (Høg et al. tycho2 (2000)) catalogues did not significantly improve the results derived with the Hipparcos catalogue. Only when using the GSC 1.2 as the basis of our reduction, the effect described above could be eliminated well. Only in the very corners of the plates systematic deviations were still detected, however, these regions are not of importance for the study of NGC 4103.
For NGC 4103 we obtained good results using quadratic polynomials in and for transforming to for the photographic plates and cubic polynomials for the CCD images, respectively. The analysis of our data revealed that the magnitude trend in the fields of NGC 5281 and NGC 4755 could be well compensated with the addition of a linear magnitude term to the polynomial transformation. Adding terms with products of the or coordinates with the magnitudes, which are not uncommon for work with CdC plates (see, e.g., Ortiz-Gil et al. ortizcdc (1998)), or terms of higher order did not further improve the results for any of the clusters.
GSC 1.2 only contains positional data on the catalogue stars, but no proper motions. Therefore our results are only relative proper motions.
| object | ||
|---|---|---|
| NGC 4103 | ||
| field | ||
| NGC 5281 | ||
| field | ||
| NGC 4755 | ||
| field |
3.1 NGC 4103
With the method described above, we determined the positions and proper motions of a total of 4,379 stars in the entire field of the photographic plates. The standard deviations of the computed positions from the GSC 1.2 were of the order of in both and indicating a good transformation of the plate coordinates. The internal dispersion of the proper motions was computed from the deviations of the positions from a linear fit of and as functions of time. We derived mean values of for both and for individual stars. A list of all proper motions derived from the plates containing NGC 4103 is presented in Table 3.1.
We selected a wide field containing 311 stars around the centre of the cluster to determine the membership probabilities. This field is large enough to cover all members of the star cluster down to the limiting magnitude of the plates of around mag. The resulting vector point plot diagram is shown in Fig. 7 (left diagram).

With the standard deviation of the proper motions of as the width of the Gaussian distribution of the cluster stars, we determined the membership probabilities. As the separation point between members and non-members we chose a probability of , leading to 128 members and 183 non-members. The values we derived for the centres of the proper motion distributions for NGC 4103 and its surrounding field are given in Table 11.
As the field and cluster proper motions are very similar, we might have mis-identified several cluster stars as field objects and vice versa. This cannot be excluded without using further information about the stars (e.g. radial velocities), but it can be expected that the further investigations are only marginally affected.
To determine the absolute proper motion of NGC 4103, we compared our relative proper motions with the Tycho–2 catalogue (Høg et al. tycho2 (2000)). Tycho–2 proved to be a reliable source for stellar proper motions; its systematic difference to the Hipparcos system is marginal (Makarov et al. makarov (2000), Sanner & Geffert tychopaper (2001)). We determined a shift between the absolute proper motions of Tycho–2 and our data. Applying this shift to our relative proper motion centre given above, we computed the proper motion of NGC 4103 to be
| (4) | |||||
| (5) |
These values correspond well with the results of Baumgardt et al. (baudetwie (2000)) who determined the proper motions of open star clusters from the Hipparcos data.
The sample of our proper motions is complete (except for a few objects which are too close to a neighbour which made a correct determination of their positions impossible) down to mag.
3.2 NGC 5281
The area selected around NGC 5281 has a diameter of , large enough to cover the entire cluster. The final output catalogue contained 314 stars showing average uncertainties in proper motions of the order of . As for NGC 4103 the mean difference between the results and the positional GSC data were approx. for both coordinates. The resulting positions and (relative) proper motions are listed in Table 3.2.
The centres of the proper motion distributions of the cluster and the surrounding field are again given in Table 11. The standard deviation of the Gaussian fit to the distribution of the members in the vector point plot diagram is in both coordinates, which equals the error of the proper motions of individual stars. With Sanders’ (sanders (1971)) method we found a clear separation between field and cluster stars: Only approx. stars show membership probabilities of between and . We computed the proper motions for stars as cluster members by their membership probability of or higher, and as field stars. The corresponding vector point plot diagram can be found in Fig. 7.
Except for four stars (all having close neighbours) the proper motion study is complete down to , as we found by comparing the results with the photometric data.
Comparing our relative proper motions with the contents of the Tycho–2 catalogue (Høg et al. tycho2 (2000)), we were able to compute a shift from our values to the Hipparcos system leading to an absolute proper motion of NGC 5281 of
| (6) | |||||
| (7) |
These values do not coincide with the results of Glushkova et al. (glush (1997)) who proposed an absolute proper motion for NGC 5281 of and . However, there have been discrepancies of their results with other studies before (see Sanner et al. capaper (2000)) and their data were gathered from various sources in the pre-Hipparcos era. We find better coincidence with the results of Baumgardt et al. (baudetwie (2000)). There is a difference of approx. in both and , however, this discrepancy is still within the errors of our study.
3.3 NGC 4755
Advantageously, NGC 4755 was covered by two neighbouring fields in the Carte du Ciel survey (see Table 9). However, the star cluster is located almost at a corner of the photographic plates, so that the stellar images were quite elongated due to distortion effects. We identified 377 stars in the restricted area. These results are listed in Table 3.3. With the plate material available we were able to determine the proper motions with an accuracy of in both and for individual objects. The width of the proper motion distribution of the cluster in the vector point plot diagram (Fig. 7, right diagram) was slightly higher in this case (, see also Table 11), however, with star counts of the field and cluster areas we were able to confirm the number of members found.
The determination of a shift from our relative proper motions to the absolute system of the Hipparcos catalogue turned out to be critical. Even the Tycho–2 catalogue which is claimed to be complete down to (Høg et al. tycho2 (2000)) only contains six stars in common with our proper motion study. From these objects we derived a shift of , leading to an absolute proper motion of NGC 4755 of
| (8) | |||||
| (9) |
is almost the same value as found by Baumgardt et al. (baudetwie (2000)), for there is a difference of between their and our results, but within the errors this still shows a good conformity.
For three Hipparcos stars in the field of NGC 4755 we were unable to determine proper motions due to crowding on the photographic plates. With the derived shift from our relative proper motions to the Hipparcos system we found that all three objects are likely cluster members. Therefore they are included in the CMD of the cluster members (Fig. 12).
4 Analysis of the colour magnitude diagrams
To analyse the CMDs of the three clusters the diagrams have to be corrected for the presence of field stars. For the part of the CMD for which the proper motion studies are complete, we applied the membership probabilities found in Sect. 3 to discriminate between field and cluster stars. Below this point, the stellar numbers are high enough to statistically subtract the field stars. This method is described in Sanner et al. (n0581paper (1999)).
It has to be remarked that for all three clusters the completeness is higher in the outer fields than in the central cluster regions which contain a high number of bright stars (see Figs. 1, 3, 5, and 9, 11, respectively). We solved this problem, which is only of marginal importance for the isochrone fitting process, but essential for the determination of the luminosity and mass functions, as follows: For the field star subtraction, we “recalibrated” the number of stars in the outer fields to the completeness of the cluster region in each block of the CMD by
| (10) |
when is the measured star number in the outer field in an arbitrary block, the corrected star number in the same field, and and the completeness factors in the inner and outer fields, respectively. This correction means that the outer field completeness is artificially reduced to the values derived for the cluster region. In addition, we had to apply weights to compensate the different sizes of the areas under consideration. Thus, we can subtract the field from the cluster region in a 1:1 ratio, while later on, for the determination of the luminosity and mass functions, the remaining data can be treated for incompleteness in the usual way – but with the completeness of the inner cluster area. This means that we disimproved the completeness of the outer regions, but the limits for the LF and the IMF computation are set by the data with least completeness, anyway. This method was preferred to a full correction to completeness already at this point, since we would have had to deal with additionally added “fake” stars in the CMD.
With the figures corrected in this way, we statistically subtracted the field stars, obtaining a CMD with the completeness function of the cluster region.
After the statistical field star subtraction stars that immensely differ from the cluster main sequence remained in the CMDs. This can be explained with the low number of stars in these CMD regions and hence imperfect statistics. Stars which can be excluded to be cluster members had to be manually eliminated before the determination of the luminosity and initial mass functions. As a rule, we state that all stars which differ from the path of the isochrone by more than twice the combined photometric error in magnitude and colour do not belong to the cluster. For the “upper right”, i.e. the brighter (or redder), limit we allowed another mag in magnitude to account for probable double stars which can be lifted by up to this value in the CMD, assuming a 1:1 mass ratio of the two components (see, e.g., Aparicio et al. aparicio (1990)). These limits are marked in the corresponding CMDs with dotted lines.
We fitted isochrones based on the models of Bono et al. (isoteramo (1997)) and provided by Cassisi (private communication) to the cleaned and – if available – CMDs. We mainly used the data; with the CMDs we only checked the quality of the isochrone fits by comparing the parameters found for each diagram.
We computed the luminosity and initial mass functions on the base of the and data. The initial stellar masses were computed on the base of the information provided with the isochrones as order polynomials of the magnitudes:
| (11) |
Polynomials of lower than order caused higher deviations especially in the low mass range. The parameters as determined for the three clusters are listed in Table 15.
| NGC 4103 | NGC 5281 | NGC 4755 | ||||
|---|---|---|---|---|---|---|
The IMF was computed with a maximum likelihood technique. We prefer this method instead of the “traditional” fit to a histogram, since bin sizes and location of the bins may influence the results, and different weights are put on stars in different bins, as all bins obtain equal weights. For a more detailed discussion of this point, see Sanner et al. (capaper (2000)).
4.1 NGC 4103
To obtain a CMD of NGC 4103 from which the basic parameters of the cluster can be derived, we subtracted the field stars in the way described above: For stars brighter than we selected all stars with a membership probability of , for the fainter stars we statistically subtracted the stars of fields B and C from those of field A. Star counts showed a slight gradient in the field star population across the three fields observed, so that it was mandatory to use a weighted combination of both fields for the field star subtraction. On the other hand, it could be proved as well that in fields B and C the number of stars does not decrease with increasing distance from the centre of the cluster, whereas the stellar density is higher in field A. We therefore can assume that field A covers all cluster members, so that the subtraction of the entire fields B and C is justified.
The cleaned CMDs are much more sparsely populated than the original ones. Especially the feature which seemed to suggest a secondary main sequence has disappeared. The CMDs with the “best” isochrones fitted are shown as Fig. 8. The parameters found for NGC 4103 as derived from the isochrone fit are listed in Table 16. We found identical values for the and CMDs, indicating the good quality of the data and the calibration. Compared with the findings of Sagar & Cannon (sagar4103 (1997)), we find good agreement of these parameters. Only the reddening differs by .

Two stars in the range of the proper motion study (around mag with mag, marked with crosses in Fig. 8) differ from the main sequence by a few tenths of a magnitude in colour. These objects were not taken into account for the IMF investigations. The most likely explanation for their high membership probability is that these objects are field stars, but by chance show the cluster proper motion. In addition, located near the completeness limit of the photographic plates, the inaccuracies of their proper motions might be higher than average.
After eliminating the non-main-sequence stars as described in Sect. 4, we determined the LF of NGC 4103 as a function of the magnitude. We present this LF in the left diagram of Fig. 13. The IMF bases on 170 stars in a mass range from (corresponding to ) to (). The IMF slope was computed with our maximum likelihood software resulting in , a result which is in good agreement with the margin proposed by Scalo (scalo2 (1998)), however, the IMF appears to be a bit shallower than the average for the mass interval under consideration. The IMF is plotted in Fig. 14 (left diagram) together with a histogram which we added to the plot for reasons of illustration and as an additional check of the quality of our results.
Experiments with the lower mass limit of the IMF showed that if the value is chosen to be smaller than , the IMF slope increases with decreasing mass limit down to at . At this point, the completeness limit of field A is 0.5 (see the upper diagram of Fig. 9), and 292 stars are covered by this IMF. Since the maximum likelihood method puts equal weights on every star, the IMF is dominated by the high number of stars in the region below , so that the uniform increase of the IMF at higher masses becomes less important.

The effect might have its origin at the different completeness limits of the photometry. The incompleteness at higher magnitudes is caused by the brightest stars which cover significant portions of the cluster. In this sense, the completeness derived before provides only average values for field A. Assuming mass segregation (i.e. a concentration of low mass stars in the outer regions of the cluster, as proposed, e.g., by Raboud & Mermilliod raboud2 (1998)), many low mass stars would be located in the parts where the completeness is not influenced by the bright stars, so that the incompleteness in the inner region of NGC 4103 would be over-compensated by our completeness correction, resulting in a too steep IMF. Another explanation would be that NGC 4103 indeed possesses a higher than average fraction of stars with masses below which is in contrast to the shape of the IMF in the mass range as assumed by Scalo (scalo2 (1998)). This discussion could only be decided with additional observations.
Stetson (stetson4103be (1981)) suggests Wesselink’s (wesselink (1969)) star 12 (our star 2; marked with circles in Fig. 8) to be a Be star. The membership probability of gives no clear evidence about whether this object indeed is a member of NGC 4103 or not. Its location in the CMDs supports Stetson’s (stetson4103be (1981)) proposition.
4.2 NGC 5281
The determination of the completeness of the data provided a major challenge in this study: As a consequence of the bright stars in the centre of the cluster, large portions of the cluster area were severely overexposed in the long exposures. Therefore, the completeness of our data sample varies within field A and from field A to field B, as can be seen in Fig. 9, lower diagram. With this background we decided to perform the statistical field star subtraction in two steps: We subtracted field B, which we corrected for the differing completeness and field size, from the inner region of field A, the portion which is heavily overexposed, and from the outer parts of field A separately. Before combining the two field star corrected samples, we removed further stars of the outer part to simulate the lower completeness of the cluster region.
With star counts we found that outside field A the stellar density remains at a constant level, so that we propose that the entire cluster fits into field A, at least within the reach of our photometry. This result means that NGC 5281 is slightly smaller than proposed in the Lyngå (lynga (1987)) catalogue (see the remarks in Sect. 2.2). After combining the members derived from the proper motion study for stars with with the results from the statistical subtraction, we derived the CMDs of NGC 5281 presented in Fig. 10. The diagrams show that the cluster is a very sparsely populated object.

In the CMD the two brightest stars measured (i.e. except for star 1 from the Moffat & Vogt (moffatvogt (1973)) sample) have significantly evolved from the main sequence. These two stars together with the objects with played an important role in the age detemination process by our isochrone fit. We found that the Myr isochrone best represents both CMDs of NGC 5281. This isochrone is overplotted in Fig. 10.
The two stars mentioned were subjects of earlier studies: Star 1 (Moffat & Vogt moffatvogt (1973): star 3) appears in Mermilliod’s (mermiobs (1982)) list of blue stragglers. Citing this work, Ahumada & Lapasset (bluestrag (1995)) included it in their list of blue stragglers, too. The star, marked in Fig. 10 with a cross, does not show abnormal behaviour in the CMDs, however, with a membership probability of , we have evidence for this object really to be a member of NGC 5281. For the other one, star 2 (star 11 in Moffat & Vogt moffatvogt (1973)) we can confirm its membership with . This star was discussed in Clariá et al. (claria (1989)) who declared the object to be a member only from its photometric properties (see also Clariá & Lapasset claria83 (1983)). They discussed the metallicity of red stars in open clusters and obtained for NGC 5281, justifying the choice of the Solar metallicity isochrone sample for the fitting procedure.
The magnitude range (or ) seems to be very sparsely populated. An explanation might be that the statistical field star subtraction removed too many stars in this interval. This effect is also very obvious in the LF, the middle diagram of Fig. 13. This phenomenon can most easily be explained by the differing completeness limits in combination with a probable inhomogeneity of the distribution of the cluster stars: Although we distinguished between the inner and outer regions of field A, we can assume the completeness to vary within the central part of the cluster as well. Assuming most cluster members of this magnitude range to be located in the part with worst completeness, their number would be underestimated. Furthermore, a probable mass segregation might decrease this effect for fainter stars. Under these circumstances, the determination of the IMF of NGC 5281 cannot produce reliable results for masses below . An IMF from to the turn-off point of the main sequence around (corresponding to ) leads to the slope of which is about the average value which can be expected. For this reduced mass interval only 55 members are taken into account for the IMF, so that the formal error of the maximum likelihood analysis increases up to . We present this result plotted with a histogram of the mass distribution in Fig. 14.
4.3 NGC 4755
Among the clusters under investigation, completeness correction was most critical for NGC 4755. Therefore we decided to study the completeness for (composite) images of three different exposure times, and we further distinguished between the central region of pix. around the centre of the cluster containing the brightest stars, the remaining parts of the field A exposures, and the part of field B which will be used as the field star region for the statistical field star subtraction. The results are portrayed in Fig. 11. As expected, the completeness drops earliest in the inner region of field A. For the completeness calculations we used the envelope of the overlapping completeness functions of the short, medium, and long exposures of the three regions. With the help of the information gathered for Fig. 11 we applied the statistical field star subtraction in the same way as for NGC 5281 (Sect. 4.2).

Also for NGC 4755 the proper motion results were complete down to within field A. Nevertheless, from the combination of cluster membership according to the proper motions and the statistical subtraction it appeared that the proper motions for the stars fainter than were no longer of sufficient quality: Obviously, a too high number of these stars was excluded from membership, as we found by studying the LF: At the border between the two methods of field star subtraction the number of stars climbed from around 20 stars per magnitude up to approx. 150 which appears to be very unlikely. Reducing the membership decision by proper motions to stars brighter than led to a more uniformly increasing LF (see Fig. 13, right diagram). A source for this phenomenon might be the higher positional errors for the fainter stars which could have led to a proper motion distribution which is wider than for the average. This would mean that a certain amount of faint members is located outside the cluster section of the vector point plot diagram.
In the CMD of the members of NGC 4755 (Fig. 12) as determined from the proper motion membership analysis and the statistical subtraction, we found that two red stars had remained in the brighter part (i.e. the part with membership determination by proper motions) of the CMD. We marked these objects with crosses. Analysing their proper motions we found that they are located in the vector point plot diagram very close to the border between members and non-members which provides evidence that their membership is not very well confirmed. We therefore conclude that these two objects do not belong to NGC 4755 and omit them in the following. Four further objects, which we marked with circles in Fig. 12, are located to redwards of the main sequence. For these objects, their nature is less clear. In terms of magnitudes, the objects are too high above the main sequence to represent a binary main sequence. Therefore it seems possible that some of these stars are Be stars (see, e.g., Zorec & Briot zorec (1991)). Indeed, Slettebak (slettebak (1985)) lists the three objects around as Be stars.

In addition, various red stars () remained in the cluster CMD. There would be no physical explanation for these stars if they were members of the cluster, so that we assume them to have remained due to the imperfect statistics of the sample. All stars outside a corridor around the “ideal” main sequence according to the isochrone fit were not taken into account for the IMF determination. This corridor is plotted in Fig. 12.
In addition to our photometry, we added those stars from Dachs & Kaiser (dachs (1984)) for which we derived sufficiently high membership probabilities in the CMD (Fig. 12). These stars helped in the isochrone fitting process. We marked them in the diagram with triangles.
The isochrone with an age of fitted the main sequence best, however, the very red star is slightly too red for the isochrone created from the Bono et al. (isoteramo (1997)) model. On the other hand, older isochrones would no longer represent the brightest blue stars well. An isochrone from the model of the Geneva group (Schaller et al. schaller (1992)) seems to represent the upper part of the CMD better. The parameters derived from this isochrone are the same as with the Bono et al. (isoteramo (1997)) one. For a comparison, we overplotted the Schaller et al. (schaller (1992)) isochrone in Fig. 12. Table 16 sums up the parameters found for NGC 4755. The results are very similar to previous findings for this cluster, e.g. the values given by Sagar & Cannon (sagar4755 (1995)).
It becomes clear that NGC 4755 is the most populous cluster among the targets of this study: Down to , the point at which the completeness of the inner part of the cluster drops below 50 %, we found 417 members. Completeness correction would lead to a total number of stars of 494 brighter than this magnitude. The LF in Fig. 13 illustrates this richness of the cluster.
The IMF was computed on the basis of photometric information of these 417 objects, so that it reaches from down to . The result of represents an IMF slope which almost matches the average value proposed in Scalo (scalo2 (1998)). We present a plot of the IMF in Fig. 14.


According to Ahumada & Lapasset (bluestrag (1995)), six stars of NGC 4755 are blue stragglers. Three of them (Arp & van Sant arp4755 (1958) numbers: G, I–5, and III-1) have membership probabilities that indicate the stars as non-members, the other three (E, F, and III-5) have sufficiently high membership probabilities, however, according to their location in the CMD they do not seem to be blue stragglers. Jakate (jakate (1978)) found three Cephei stars in the field of NGC 4755. Two of them, stars F and IV-18, are members of the cluster, the third one, star I-5, is a field star according to our proper motion study.
We already mentioned the field stars fainter than and approx. redder than cluster main sequence stars of the same apparent magnitude (see Sect. 2.3 and Fig. 6). We analysed these objects with the help of isochrone fits. It is difficult to properly fit isochrones to such a mix of objects of different distances and ages, however, some restrictions could be applied at least to the value of the reddening: Assuming that the stars are closer than NGC 4755, the reddening has to be smaller than the value determined for the cluster, whereas more distant objects would have to be associated with a higher reddening. The most likely explanation for these stars is that they are nearby objects of low luminosity. Their distance can be approximated to be between and . Some of the stars might be distant, highly reddened stars with high absolute magnitude, but their number can be assumed to be small. For a more detailed investigation of these field stars, additional information (e.g. spectroscopic data) would be necessary.
5 Concluding remarks
We studied the initial mass function of the three open star clusters NGC 4103, NGC 5281, and NGC 4755 based on photometric and astrometric data. All three IMFs are consistent with a power law shape in the mass range under investigation, the exponents range from to , which is in agreement with typical values as proposed, e.g., by Scalo (scalo2 (1998)). The basic parameters of the clusters which were derived by fitting isochrones to the CMDs are listed in Table 16. Together with our previous studies (Sanner et al. n0581paper (1999, 2000)) we can summarise that the IMF of all clusters investigated is universal in the sense that they show the shape of a power law, however, the slopes of these power laws differ.
| NGC 4103 | ||
|---|---|---|
| distance modulus | = | |
| i.e. distance | = | |
| reddening | = | |
| age | = | |
| i.e. | = | |
| metallicity | = | |
| NGC 5281 | ||
| distance modulus | = | |
| i.e. distance | = | |
| reddening | = | |
| age | = | |
| i.e. | = | |
| metallicity | = | |
| NGC 4755 | ||
| distance modulus | = | |
| i.e. distance | = | |
| reddening | = | |
| age | = | |
| i.e. | = | |
| metallicity | = | |
One aspect of this work was to study the suitability of the Sydney Carte du Ciel plates as first epoch material for proper motion studies. Our research showed that in principle the precision of the stellar images on the plates proved to be satisfactory, although a magnitude dependence of the positions is present. Therefore it is problematic to derive absolute proper motions, since a sufficiently dense input catalogue is necessary which covers the entire magnitude interval of the plates (down to approx. ). Such a catalogue is not available yet, it will only be provided by future satellite missions like DIVA (Röser et al. 1998a ) and FAME (Horner et al. fame (1998)). On the other hand, since the completeness levels of these catalogues are claimed to be fainter than for the old photographic plates, the importance of these old archives – at least for positional astronomy – will significantly decrease. They will only be suitable for astrometric measurements for which long epoch differences are mandatory, like the search for binary stars which can be revealed by proper motions varying with time (Wielen et al. wielen (1999)), or studies in other fields of astronomy (for examples, see, e.g., Brosch et al. brosch (2000)).
Acknowledgements.
The authors acknowledge Greg Lowe from Perth Observatory for observing the second epoch plates for the proper motion study. Further thanks go to Alain Fresneau, Alan Vaughan, and Elisabeth Moore for initiating the digitisation of the first epoch plates in Cambridge and providing the pre-reduced data of the plates digitized with the APM. Alan Vaughan is acknowledged for the access to the Sydney and Melbourne Carte du Ciel archives, Andrea Dieball and Klaas S. de Boer for carefully reading the manuscript of this publication. J.S. thanks James Biggs and the entire staff of Perth Observatory for the permission to use the observatory’s plate measuring machine and a very pleasant stay in Bickley. J.B. acknowledges financial support from the Deutsche Forschungsgemeinschaft under grant ME 1350/3-2. This research has made use of NASA’s Astrophysics Data System Bibliographic Services, the CDS data archive in Strasbourg, France, and J.-C. Mermilliod’s WEBDA database of open star clusters.References
- (1) Ahumada J., & Lapasset E. 1995, A&AS, 109, 375
- (2) Aparicio A., Bertelli G., Chiosi C., & Garcia-Pelayo J. M. 1990, A&A, 240, 262
- (3) Arp H. C., & van Sant C. T. 1958, AJ, 63, 341
- (4) Baumgardt H., Dettbarn C., & Wielen R. 2000, A&AS, 146, 251
- (5) Becker W. 1959, Zeitschr. Astroph., 48, 279
- (6) Bono G., Caputo F., Cassisi S., Castellani V., & Marconi M. 1997, ApJ, 479, 279
- (7) Brosch N., Hudec R., Kroll P., & Tsvetkov M. 2000, Saving astronomical treasures, in A new era of wide field astronomy (in press)
- (8) Brosche P. 1998, Extracting the information content of the Carte du Ciel plates, in IV International Workshop on Positional Astronomy and Celestial Mechanics, ed. A. López García, L. Yagudin, M. Martínez Usó, et al. (Observatorio Astronómico de la Universitat de Valéncia, Valéncia), 47
- (9) Burki G., Rufener F., Burnet M., et al. 1995, A&AS, 112, 383
- (10) Brunzendorf J., & Meusinger H. 1998, Astrometric properties of the Tautenburg Plate Scanner, in The Message of the Angles – Astrometry from 1798 to 1998, ed. P. Brosche, W. R. Dick, O. Schwarz, et al. (Verlag Harri Deutsch, Thun, Frankfurt a.M.), 148
- (11) Brunzendorf J., & Meusinger H. 1999, A&AS, 139,141
- (12) Clariá J. J., & Lapasset E. 1983, JA&A, 4, 117
- (13) Clariá J. J., Lapasset E., & Minniti D. 1989, A&AS, 78,363
- (14) Dachs J., Kaiser D. 1984, A&AS, 58, 411
- (15) ESA 1997, The Hipparcos and Tycho Catalogues, ESA SP–1200
- (16) Geffert M., Klemola A. R., Hiesgen M., & Schmoll J. 1997, A&AS, 124, 157
- (17) Glushkova E. V., Zabolotskikh M. V., Rastorguev A. S., Uglova I. M., & Fedorova A. A. 1997, PAZh, 23, 90
- (18) Høg E., Fabricius C., & Makarov V. V. 2000, A&A, 355, L27
- (19) Horner S. D., Germain M. E., Greene T. P., et al. 1998, BAAS, 193, 1206
- (20) Jakate S. M. 1978, AJ, 83, 1179
- (21) Landolt A. U. 1992, AJ, 104, 340
- (22) Lyngå G. 1987, Catalog of open cluster data, edition
- (23) King D. S. 1979, Journ. Proc. RSNSW, 112, 13
- (24) King D. S. 1980, Journ. Proc. RSNSW, 113, 65
- (25) Makarov V. V., Odenkirchen M., & Urban S. 2000, A&A, 358, 923
- (26) Mermilliod J.-C. 1982, A&A, 109, 37
- (27) Mermilliod J.-C. 1999, WEBDA: Access to the Open Cluster Database, in Very Low-Mass Stars and Brown Dwarfs, ed. R. Rebolo (Cambridge Univ. Press, Cambridge) (in press)
- (28) Moffat A. F. J., & Vogt N. 1973, A&AS, 10, 135
- (29) Ortiz-Gil A., Hiesgen M., & Brosche P. 1998, A&AS, 128, 621
- (30) Raboud D., & Mermilliod J.-C. 1998, A&A, 333, 897
- (31) Röser S., Bastian U., de Boer K. S., et al. 1998a, Highlights in Astr., 11, 583
- (32) Röser S., Morrison J., Bucciarelli B., Lasker B., & McLean B. 1998b, Contents, Test Results, and Data Availability for GSC 1.2, in Proc. IAU Symp. 179, New Horizons from Multi-Wavelength Sky Surveys, ed. B. McLean, D. A. Golombek, J. J. E. Hayes, H. E. Payne (Kluver, Dordrecht), 420
- (33) Sagar R., & Cannon R. D. 1995, A&AS, 111, 75
- (34) Sagar R., & Cannon R. D. 1997, A&AS, 122, 9
- (35) Salpeter E. E. 1955, ApJ, 121, 161
- (36) Sanner J., Geffert M., Brunzendorf J., & Schmoll J. 1999, A&A, 349, 448
- (37) Sanner J., Altmann M., Brunzendorf J., & Geffert M. 2000, A&A, 357, 471
- (38) Sanner J., & Geffert M. 2001, A&A (submitted)
- (39) Sanders W. L. 1971, A&A, 14, 226
- (40) Scalo J. M. 1986, Fund. Cosm. Phys., 11, 1
- (41) Scalo J. M. 1998, The IMF revisited – A case for variations, in ASP Conf. Series 142 , ed. G. Gilmore, D. Howell (ASP, San Francisco), 201
- (42) Schaller G., Schaerer D., Meynet G., & Maeder A. 1992, A&AS, 96, 269
- (43) Slettebak A. 1985, ApJS, 59, 769
- (44) Stetson P. B. 1981, AJ, 86, 1500
- (45) Stetson P. B. 1991, Initial experiments with DAOPHOT II and WFC images, in ESO/ST-ECF Garching Data Analysis Workshop, ed. P. J. Grosbøl, R. H. Warmels (ESO, Garching), 187
- (46) Urban S. E., Corbin T. E., & Wycoff G. L. 1998, AJ, 115, 2161
- (47) Wesselink A. J. 1969, MNRAS, 146, 329
- (48) Wielen R., Dettbarn C., Jahreiß H., Lenhardt H., & Schwan, H. 1999, A&A, 346, 675
- (49) Zorec J., & Briot D. 1991, A&A, 245, 150