Radio Continuum Imaging of the Spiral Galaxy NGC 4258
Abstract
We analyze resolution, high sensitivity radio continuum images of the nearby spiral galaxy NGC 4258 at 6 and 20 cm derived from multiple observations used to monitor the radio supernova SN 1981K (Van Dyk et al. 1992, [ApJ, 396, 1995]). Seven bright H II region and five supernova remnant candidates are identified. Extinctions to the H II regions are estimated for the first time from a comparison of radio flux densities to new optical fluxes derived from H observations by Dutil & Roy (1999, [ApJ, 516, 62]). The bright end of the H II region luminosity function is established at each wavelength. The luminosity functions are best fit by power laws consistent with the shape of previously published radio and optical luminosity functions for a number of galaxies. The supernova remnants are all about 2–3 times the radio luminosity of Cas A. In addition, the galaxy’s nucleus is shown to have been variable over the SN 1981K monitoring period. The spectral index () distribution of the anomalous radio arms is investigated and found to be relatively uniform at .
Subject headings:
galaxies: individual (NGC 4258, M106) — radio continuum: galaxies — H II regions — supernova remnants — dust, extinction1. Introduction
Radio continuum emission from normal galaxies is a combination of both thermal and nonthermal discrete emission from individual sources and diffuse emission from the galactic disk. The individual thermal emitters are assumed to be free-free emitting H II regions, which affect the interstellar medium (ISM) through the ionizing radiation of young stars, and the nonthermal emitters are generally thought primarily to be supernova remnants (SNRs), which also profoundly affect the ISM by injecting enormous amounts of kinetic energy and enriched material. SNRs are the leading candidates for the production of cosmic rays and contributors to the relativistic ISM. Thus, studies of H II regions and SNRs provide important information on the beginning and endpoints of stellar evolution and reveal much about the evolution of the ISM and, ultimately, the evolution of galaxies.
Analyses of extragalactic SNRs and H II regions at radio wavelengths are not hampered by the distance ambiguities of Galactic samples and extinction by dust and gas. A relatively well-defined samples of SNR and H II region distributions in external galaxies can be used to yield an unbiased statistical picture of group properties, which can yield important information on star formation and the role of supernova (SN) and SNR shock waves in determining the energetic and dynamical evolution of the ISM, and, perhaps, even in triggering new epochs of star formation. Radio observations of H II regions are nearly a direct measure of the ionizing luminosity of the embedded stars. A comparison with optical line luminosities can result in estimates of the line-of-sight extinction, providing an alternative to hydrogen line ratio methods alone, and can make it possible to trace the distribution of dust and the nature of extinction gradients in other galaxies. Extinction measurements can also help determine the amount of dust internal to individual H II regions, which are essential for accurate estimates of atomic and molecular abundances and chemical gradients within galaxies. Comparisons between thermal radio and far-infrared properties can lead to a better understanding of the young stars that power H II regions and their role in the galactic-scale, far-infrared emission properties.
Due to limited resolution and sensitivity, large samples of discrete radio sources in external galaxies have only been observed in the Local Group (e.g., in M31, Braun & Walterbos 1993; in M33, Viallefond & Goss 1986, Duric et al. 1993, Duric et al. 1995, and Gordon et al. 1999; in the LMC and SMC, Mills 1983 and Mathewson et al. 1983), in intense starburst galaxies (e.g., in M82, Kronberg, Bierman, & Schwab 1985; in NGC 253, Ulvestad & Antonucci 1997), in M51 (van der Hulst et al. 1988), in M81 (Kaufman et al. 1987), and in NGC 6946 (Lacey, Duric, & Goss 1997, Hyman et al. 2000). As part of a larger study of the continuum emission from nearby galaxies, we consider in this paper the case of NGC 4258.
NGC 4258 (M106) is a large (; NASA/IPAC Extragalactic Database, NED), nearby (7.3 Mpc; Herrnstein et al. 1997) spiral galaxy with high inclination (, Sandage & Tammann 1981), at high galactic latitude (), with correspondingly low foreground extinction (; NED). The galaxy is also notable for its LINER/Seyfert nuclear properties, for the detection of a very bright radio continuum nuclear source (Turner & Ho 1994), for the discovery of H20 masers and for the possibility of a supermassive black hole at the center (Miyoshi et al. 1995; Greenhill et al. 1995). H imaging by Courtes et al. (1993) and Dutil & Roy (1999) show a number of very bright H II regions along the inner spiral arms of the galaxy.
NGC 4258 has been previously studied at numerous radio wavelengths. van der Kruit, Oort, & Mathewson (1972) observed the galaxy at 20 cm with the Westerbork Synthesis Radio Telescope (WSRT) at 24 32 resolution, revealing very bright and extensive “anomalous” radio arms in the east-west direction. de Bruyn (1977), with the WSRT at 6 and 49 cm with resolution 7 9 and 56 76, respectively, found a nonthermal spectral index for the anomalous arms. van Albada & van der Hulst (1982), with the WSRT ( beam) and the Very Large Array (VLA111The Very Large Array (VLA) is a telescope of the National Radio Astronomy Observatory (NRAO) which is operated by Associated Universities, Inc., under a cooperative agreement with the National Science Foundation.; beam), both at 20 cm, found that the anomalous arms are multiply branched. Krause, Beck, & Klein (1984), with the Effelsberg 100-m telescope at 6.3 and 2.8 cm (1 resolution), detected no significant spectral index variations along the anomalous arms. Hummel, Krause, & Lesch (1989) conclude, based on their analysis of the polarized emission using the VLA at 6 and 20 cm (14 resolution) and Effelsberg at 1.2 cm (40 resolution), that the anomalous arms lie in the plane of NGC 4258.
Although the anomalous arms coincide with faint H emission (Courtes & Cruvellier 1961; Courtes et al. 1993; Dutil & Roy 1999), they were originally thought to be out of the plane of the optical galaxy (Courtes & Cruvellier 1961; van der Kruit et al. 1972), due to the absence of H II regions along them and other considerations. The radio arms have been modeled as arising from the expulsion of gas from the nucleus either in a single event (van der Kruit et al. 1972) or by continuous ejection in a jet (Martin et al. 1989; Ford et al. 1986; Cecil, Wilson, & Tully 1992; Pietsch et al. 1994). However, the CO(1–0) observations by Krause et al. (1990) revealed a large quantity of molecular gas along the radio arms which would have required an unreasonably large energy output in the single event model. Recently, Cecil et al. (2000), with VLA 20 cm observations at resolution and high-resolution optical data, conclude that the arms arise from changing jet activity at the nucleus. Cox & Downes (1996), from CO(2–1) observations of the inner parts of the anomalous arms, offer an alternative explanation, concluding that the arms arise from gas flows and shocks due to a galactic bar potential within the disk of NGC 4258.
The previous radio studies of NGC 4258 focused mostly on the analysis of the anomalous arms and not on the discrete sources in the galaxy, other than the nucleus. We present here our high resolution () and high sensitivity (25 Jy beam-1) observations, which result in a detailed analysis of the H II regions and SNRs. Although our study does not concentrate on the nature of the anomalous arms, our radio maps show significantly smaller structures in the anomalous arms and smaller-scale spectral index variations within them. Optical-to-radio comparisons are used to estimate the visual extinctions toward the H II regions. Also, the bright end of the H II region luminosity function is produced, and the star formation properties of the brightest H II regions are also presented. The SNRs are shown to be very luminous in the radio, and the nucleus appears to exhibit variability over more than a decade.
2. Radio Observations
The Type II radio SN 1981K in NGC 4258 was monitored with radio continuum VLA observations at 6 and 20 cm from 1985 March through 1990 May in all four array configurations. Details of the data reduction for these observations and the results of the analysis for SN 1981K are described in Weiler et al. (1986) and Van Dyk et al. (1992). We have used the AIPS task DBCON to combine the observations at each frequency from 1985 March 30 through 1990 May 29, and from additional SN 1981K monitoring observations made on 1991 July 29, 1991 October 31, and 1994 May 03 in A and B configurations. The integrated times-on-source for the concatenated uv databases are 16.6 hr at 6 cm and 10.6 hr at 20 cm. The uv data were Fourier-transformed and beam-deconvolved using two different procedures in AIPS. First, the task IMAGR was used. Images with equal resolutions of at both wavelengths were generated by appropriately weighting the data with UVTAPER. These images were used to analyze most of the discrete sources in and background sources surrounding NGC 4258. However, the anomalous radio arms have a very speckled appearance in these images, due to cleaning of the very extended emission with a narrow beam. For that reason, the task VTESS, running the Maximum Entropy Method (MEM), was used. While the CLEAN algorithm in IMAGR is more reliable for imaging discrete sources, MEM is more suitable for imaging extended emission. Zero-spacing fluxes of 0.40 Jy (Krause et al. 1984) and 0.82 Jy (Hummel et al. 1989), corresponding to the integrated flux densities at 6 and 20 cm, respectively, were input to VTESS to correct for missing short spacings in the uv coverage. The MEM images of NGC 4258 are shown in Figures 1a and b. They have nearly the same resolution () and sensitivity (20 Jy beam-1 and 30 Jy beam-1 at 6 and 20 cm, respectively) as the images made with IMAGR (not shown). The labels in Figure 1a refer to discrete sources discussed in §4.1.1 and §4.1.2 below.
Corrections for primary beam attenuation have been applied to both the CLEAN and MEM images, since the anomalous arms extend 8 east-west and the prominent inner north-south spiral arms extend 6, well within the 30 FWHM primary beam at 20 cm, but less so, within the 9 (FWHM) primary beam at 6 cm. Since the field center of the observations is at the location of SN 1981K (, ; J2000), the 50 MHz bandwidth at both wavelengths did not result in significant bandwidth smearing for sources along the northern arm. However, smearing is significant at 20 cm for sources in the southern arm, where the reduction in the peak flux density of a point source is as much as a factor of two (Bridle & Schwab 1988). While the integrated flux density of a bandwidth-smeared bright source, such as the prominent source at the end of the southern spiral arm, should not be affected, fainter sources could be smeared into the surrounding arm emission and noise, and hence, be difficult to detect. The detection of faint radio sources in the southern arm is discussed further in the next section.
3. Source Detection and Measurement
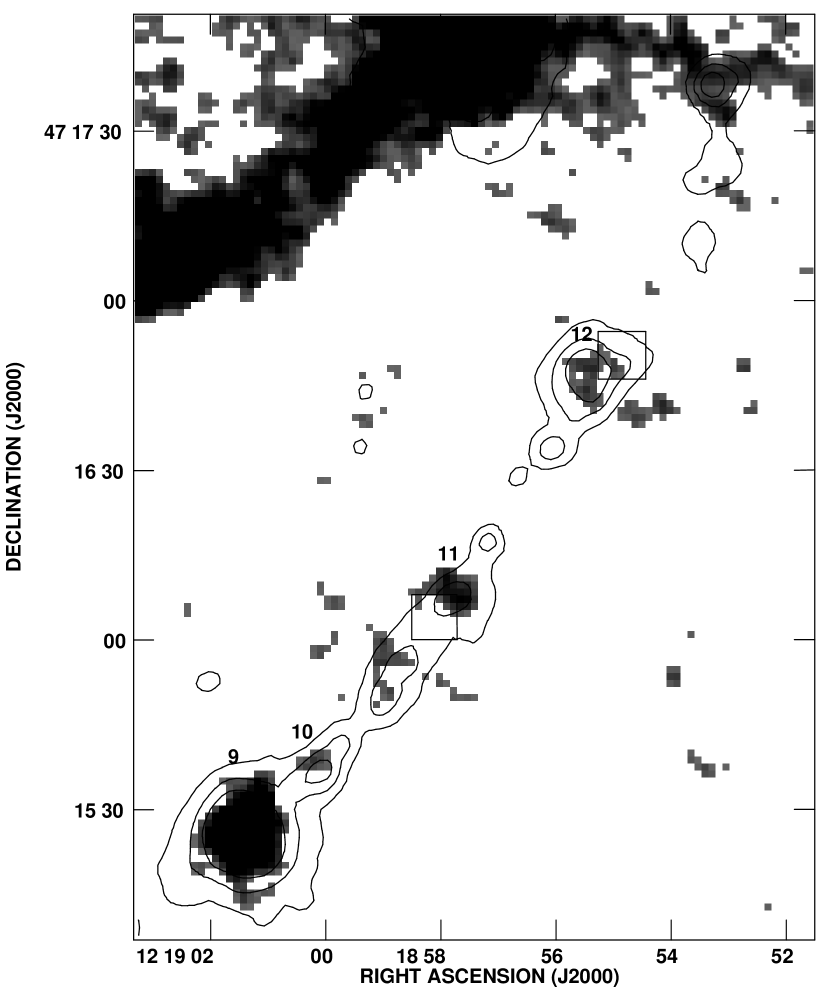
Because of the complexity of the radio emission from NGC 4258, it was often difficult to resolve discrete sources from background disk and anomalous arm emission. Therefore, only the brightest sources (nos. 1–9; Figure 1a), a few fainter sources in the southern arm (nos. 10-12; Figure 3), one background source at the tip of the southeastern radio arm, and nine background sources in located outside the field of Figures 1a and b were chosen for analysis. The CLEAN maps were used to measure the properties of sources 1–9, the nucleus, and the background sources. The MEM images were used to measure sources 10–12 and to generate a spectral index map of the anomalous radio arms (see §4.4.2). In addition to our radio data, Y. Dutil and J.-R. Roy kindly provided to us narrow-band, continuum-subtracted H imaging data for NGC 4258 (see Dutil & Roy 1999 for details). Briefly, the H images were acquired with the 1.6 m telescope at Mont Megantic Observatory, the two satellite [N II] lines were excluded using a 10 Å-wide filter, the seeing was 2-3, and the optical flux calibration uncertainty is 20. We registered the radio and H images, and show the H map overlaid on the 20 cm MEM greyscale image in Figure 2.
The positions of most of the brightest radio sources have optical counterparts with peak pixel positions that agree to within . The brightest portions of the anomalous arms also coincide with diffuse optical emission, although significantly more structure is apparent in the radio images (see §4.4.1). In contrast to the radio images in Figures 1a and b, the optical-radio comparison in Figure 2 shows significant H emission and many discrete sources in the southern arm, besides the very bright source 9. Because of the confusion of faint sources with background emission, we have used the MEM images to identify sources in the southern arm. An MEM-derived contour map of the 20 cm radio emission from the southern arm and surrounding regions is shown in Figure 3. The radio map shows faint emission coincident with several of the discrete H sources in the southern arm.
The flux densities of the radio sources were measured using the same technique as that used for NGC 6946 (Lacey et al. 1997; Hyman et al. 2000). First, the total flux was measured within an aperture including the source and an annulus outside the aperture measuring the background. The average background was computed and subtracted from the flux within the source aperture to obtain the source flux density. Note that source 4 appears to have two components in the 20 cm image (Figure 1a). However, since the corresponding source on the 6 cm and H images does not show any structure and covers the same area as the 20 cm source, we have simply measured the flux using one inclusive aperture. Fluxes were measured for each of the optical counterparts to radio sources using the same method. Since the resolution of the radio maps is similar to the seeing of the optical observations, identical source apertures were used.
4. Discussion
4.1. Source Criteria
The thermal radio emission from H II regions is identifiable by its flat spectral index, (where ), with a nominal value . For nonthermal emission from, e.g., SNe, SNRs, and optically thin active galactic nuclei, is steeper, in the approximate range to . Unfortunately, a nonthermal plerionic SNR, which also has a flat spectrum (; Weiler & Panagia 1978), might be confused with an H II region by this criterion. However, extrapolating from the small number of plerions compared to the shell-type remnants (Srinivasan et al. 1984), it is likely that we would correctly identify the SNRs in NGC 4258 down to the surface brightness limit, with only one or two plerions possibly misidentified.
4.1.1 Discrete Sources in NGC 4258
In Table 1 we present the positions, flux densities, and spectral indices for 12 discrete radio sources, including the galactic nucleus. The position listed for each source corresponds to the centroid at 20 cm. SN 1981K is not included in the table. Although the uncertainties in the spectral indices are appreciable, we employ the criteria above to discriminate between thermal and nonthermal sources. Of the 13 sources, sources 1–6 and 9 are considered thermal, with between +0.05 and , and are, therefore, classified as H II region candidates. Two bright sources (7 and 8) and the faint southern arm sources (10, 11, and 12) have nonthermal between and , and are classified as SNR candidates.
We have identified and measured optical counterparts on the H image to the 13 radio sources in Table 1, except for two SNR candidates (sources 7 and 8) and source 6, which is blended with source 5 on the H map (see below). The optical fluxes, as well as estimates of visual extinction toward the H II regions, are listed in the table (see also §4.1.5). The nucleus, source 2, and the nonthermal sources 11 and 12 are coincident with, or are near, four X-ray sources (X18, X16, X19, and X14, respectively; Vogler & Pietsch 1999). The X-ray counterparts to sources 11 and 12 are indicated by boxes in Figure 3.
Note from Figure 1a that one optical source covers an area that includes both radio sources 5 and 6; therefore, a separate aperture including both sources was used to measure the optical flux and the flux density of the combined pair of radio sources (source “5+6” in Table 1). Also, while an optical source is located from the nonthermal source 7 (i.e., somewhat more than one synthesized half-power beam width), we have not included its flux in the table, since typically the radio and optical source positional uncertainties are less than .
4.1.2 Background Sources
Based on estimates of the background source counts with flux densities above 100 Jy at 21 cm (Oort 1987), we expect 4 background sources to occur in the field. It is therefore possible that extragalactic radio sources with nonthermal spectra could be confused with our SNR candidates, or that a flat spectrum galaxy nucleus could be confused with our H II region candidates. However, since all thermal sources and all three southern arm SNR candidates also have H counterparts, these sources are less likely to be background objects. Although the nonthermal source 7 does not have a clear optical counterpart, its location in the northern arm near the central region of the galaxy is supportive of an identification as a SNR. The nonthermal source 8 could possibly be a background object, since it is has no optical counterpart and is located in the interarm region.
One notable, very bright, nonthermal radio source within the field of Figures 1a and b (source 15), located east of the nucleus at the tip of the southeastern radio arm, was rejected as a SNR candidate because of its possible “head-tail” structure. The 20 cm position of the source’s bright (bandwidth smeared) “head” component is , (J2000). The bifurcated radio “tail” extends northward. At 6 cm, only the northeastern part of the tail is clearly visible above the noise. The head has a 20 cm flux density of mJy and a nonthermal spectral index . Hummel et al. (1989) and van Albada & van der Hulst (1982) also detected this source in their lower-resolution maps and suggested that, given its extreme brightness, nonthermal spectral index, and possible complex structure, it is a background radio galaxy rather than a source associated with NGC 4258. From its morphology evident in our higher-resolution maps, we agree with that conclusion.
In Table 2 we list source 15, described above, two clusters of sources (16 and 17), and two additional sources (13 and 14), all lying within the 20% attenuation level of the primary beam at 6 cm, but, with the exception of source 15, outside the field shown in Figures 1a and b. These sources have no optical counterparts. Nine of the ten sources listed in the table have nonthermal spectral indices ranging from to . The cluster of sources 16a–d corresponds to source 6 in Hummel et al. (1989), which they list as a “triple,” and the cluster of sources 17a–c corresponds to their source 2, listed as a “double.” Hummel et al. (1989) and van Albada & van der Hulst (1982) suggest that the clusters constitute two radio galaxies. Indeed, the source cluster 16a–d may consist of a flat spectrum () nuclear source (16b) with nonthermal radio lobes to the north (16a) and south (16c, d). Similarly, the sources 17a and 17c may be the lobes of a radio galaxy, with the nucleus located at the position of source 17b. While additional sources are visible within the larger field-of-view at 20 cm, they are extremely bandwidth smeared; hence, no measurements were attempted for these sources, especially since no information is available for them at 6 cm.
4.1.3 H II Region Star Formation Properties
The seven radio H II regions are among the brightest optically in NGC 4258, with erg s-1 (Courtes et al. 1993). We have calculated the star formation rate, SFR, for massive stars from their thermal radio spectral luminosity, , using Eq. 23 of Condon (1992):
| (1) |
where is in W Hz-1, is in GHz, and SFR is in M☉ yr-1. Condon (1992) derives this relation in the context of the global star formation properties for normal galaxies using the “extended” Miller & Scalo (1979) initial mass function , for stellar masses above 5 M☉ and below 100 M☉. The relatively dust-free was determined at 6 cm assuming a distance of 7.3 Mpc to NGC 4258 (Herrnstein et al. 1997). For H II region candidates with (sources 3, 4, 5, and 9), the uncertainties in are significant and, therefore, we cannot rule out a nonthermal component. A correction was first applied for residual nonthermal contamination which was, presumably, not fully removed in the background-subtraction procedure discussed in Section 3. A nonthermal spectral index of was assumed for the contamination. This correction is at the 1 level, except for source 9, for which the flux density is reduced by 2 and 3.5 at 6 and 20 cm, respectively. We present in Table 3 for each H II region the corrected thermal flux densities (S), , the SFR, the production rate of Lyman continuum photons (, in s-1), and the radio supernova rate (, in yr-1). and were calculated using Eqs. 24 and 20 from Condon (1992):
| (2) |
| (3) |
where the latter equation assumes that dust absorption of Lyman continuum photons is negligible.
4.1.4 H II Region Luminosity Functions
H II region luminosity functions, i.e., the number distribution of source luminosities, can reflect the mass distribution of the parent molecular clouds and the efficiencies for conversion of molecular gas during star formation. Considerable foreground extinction impedes H studies of H II regions in the Galaxy. Extragalactic luminosity functions are important, since the lack of known distances, sample incompleteness, and selection biases in the Galactic sample prevent accurate luminosity functions from being calculated. Previous radio observations of extragalactic H II regions, while not affected by extinction and relative distance ambiguities, usually suffer from limited resolution and sensitivity and the related difficulties in nonthermal background subtraction. Thus far, radio luminosity functions of H II regions are available for non-Local Group galaxies for only M81 (Kaufman et al. 1987), M51 (van der Hulst et al. 1988), NGC 6946 (Hyman et al. 2000), and certain starburst galaxies.
Since we have detected only seven bright radio H II regions in NGC 4258, we can only plot the brightest end of the luminosity function. The cumulative radio luminosity functions, i.e., (where is the number of sources with radio flux densities ) versus , for the seven H II region candidates in Table 1 are shown in Figure 4 for both 6 cm (diamonds) and 20 cm (circles) wavelengths. The luminosity functions have nearly identical shapes and power-law indices (), with at both wavelengths.
The values we obtain for are similar to those found in earlier studies. Recently, we reported values of at 6 cm and at 20 cm for the bright end of the luminosity function formed from 43 radio H II region candidates detected in NGC 6946 (Hyman et al. 2000; Lacey et al. 1997). Viallefond & Goss (1986) found for the H II region 20 cm luminosity function of M33. Kaufman et al. (1987) and van der Hulst et al. (1988) have fit their 20 cm luminosity functions for H II regions in M81 and M51 and obtained and , respectively, for the brightest sources. Israel (1980) obtained values ranging from to for the high end of the radio luminosity functions for 14 late-type galaxies, with a steeper value of for NGC 4258. The difference in values probably arises from resolution differences and significant background contamination. We conclude that the index determined from our high end luminosity function is likely more reliable. We can clearly distinguish the H II regions in the northern arm from each other and can remove background contamination more accurately.
Courtes et al. (1993) have derived the H luminosity function from measurements of 137 H II regions in NGC 4258. However, they could not fit a single power law to the bright end because of a break in the slope seen at 1038.7 ergs s-1 (this break in a number of galaxies may be due to an unknown mechanism that inhibits the formation of supergiant H II regions [Kennicutt, Edgar, & Hodge 1989)], to a transition from ionization- to density-bounded regions [Rozas, Beckman, & Knapen 1996], or to a variable, rather than constant, star formation evolution [Feinstein 1997]). From Fig. 4 of Courtes et al. (1993) for erg s-1, we estimate that the slope , somewhat shallower than the radio-determined slope.
4.1.5 H II Region Extinction
From our radio and optical measurements we have estimated the extinction at H, , toward the H II regions listed in Table 1, using Eq. 2 of Kaufman et al. (1987):
| (4) |
where the electron temperature is assumed to be 104 K, and erg cm-2 s-1 mJy-1 at =1.465 GHz and erg cm-2 s-1 mJy-1 at =4.885 GHz (Gebel 1968).
We obtain mean values of at 6 cm and at 20 cm for the visual extinctions, , after applying a standard galactic reddening law, = 1.28 (Miller & Mathews 1972). Due to NGC 4258’s high galactic latitude, the Galactic foreground extinction is negligible ( = 0.00; NED). We find no correlation between and radio flux density, which implies that the optical and radio H II region luminosity functions should have similar shapes. Such a correlation was also not found for H II regions in NGC 6946 (Hyman et al. 2000), M81 (Kaufman et al. 1987), and M51 (van der Hulst et al. 1988).
The highest extinction is found for the combination of sources 5 and 6, which are located close to the center of NGC 4258, where more dust might be expected. We also have obtained an estimate of 5.5 mag for the extinction toward the flat spectrum nucleus which is comparable to that for sources 5 and 6, and significantly greater than for those with lower extinctions located further from the center. Recently, Chary et al. (2000) from high-resolution infrared observations estimate a visual extinction of 18 mag for the toward the compact (size pc) source at the center of NGC 4258.
The model by Sarazin (1976) predicts that internal dust in H II regions would give rise to an extinction gradient with galactocentric radius, related to metal abundance gradients. While a shallow metal abundance gradient (Dutil & Roy 1999) and a moderate extinction gradient (Dutil 1998) are found from optical data alone for NGC 4258, our sample of extinction measurements is too limited to show a clear trend. However, an extinction gradient was also not found for NGC 6946 (Belley & Roy 1992; Hyman et al. 2000), M81 (Kaufman et al. 1987), and M51 (van der Hulst et al. 1988).
Our mean values are about 1 mag higher than the mean value of 1.3 mag obtained for 122 H II regions in NGC 4258 using Balmer decrements (Dutil & Roy 1999; Dutil 1998). Their extinction values, (Bal), for sources corresponding to our H II region candidates are listed in Table 1. The largest differences (from 0.5 to 2 mag) are for sources 1, 9, and the combination of 5 and 6, and the smallest differences (0.2 mag) are for sources 2, 3, and 4. In other galaxies, such as NGC 6946 (Hyman et al. 2000), M33 (Viallefond & Goss 1986), M51 (van der Hulst et al. 1988), and M81 (Kaufman et al. 1987), the radio-determined extinction is also higher than the Balmer decrement extinction. This discrepancy has been attributed to patchy dust internal and external to H II regions, to aperture differences between the radio and optical measurements, or to the variation of line ratios over the spatial extent of the source.
A comparison of extinction estimates using the radio-to-optical method for other galaxies shows that our mean value of 2.5 1.0 for NGC 4258 is similar to that of for M51 (van der Hulst et al. 1988), but is greater than for NGC 6946 (Hyman et al. 2000) and for M81 (Kaufman et al. 1987).
4.2. Supernova Remnants
The SNR candidates, sources 7, 8, and 10–12, for a distance of 7.3 Mpc, have spectral luminosities at 6 cm of 1.6, 1.4, 1.2, 1.7, and erg s-1 Hz-1, respectively. These luminosities are all 2–3 times the 6 cm luminosity of Cas A, and are comparable to the extraordinary and very luminous SNR in NGC 6946 (Van Dyk et al. 1994). Samples of extragalactic SNRs, not subject to the extinction and source confusion problems of Galactic SNRs, although growing, are still quite small, and these very bright examples are particularly intringuing, since they may the remnants of very massive single stars (Dunne, Gruendl, & Chu 2000) or may be multiple interacting SNRs (Blair, Fesen, & Schlegel 2001). These bright sources are deserving of further observational attention. No fainter likely radio SNRs are detected in NGC 4258.
Cecil et al. (2000) claim that what is our source 7 is a putative northern radio “hot spot” created by the nuclear jet impacting the ambient medium. Although we clearly agree that the source is nonthermal, Cecil et al. (2000) measure a size of 14″ at resolution at 20 cm; at the same frequency we measure at 4″ resolution a size of at most 5″ (FWHM). We find the size difference hard to reconcile and speculate on how much background emission was included in their measurement. We therefore call into question its identification as a hot spot of the jet outflow. Similarly, Cecil et al. (2000) isolate a corresponding southern hot spot; this source is even more embedded in the background, and Figure 1a shows it to be complex in morphology. Therefore, we have not included it in our detected source list. This source is most certainly nonthermal as well, with between and , but, again, the diffuse background is too bright to make an accurate estimate.
4.3. Nucleus
In our concatenated dataset, the nucleus of NGC 4258 has a relatively flat spectrum, , between 6 and 20 cm. Turner & Ho (1994) found from observations in 1982 and 1983 an inverted spectrum, , between 2 and 6 cm, characteristic of an opaque synchrotron source. We undertook mapping the individual observations at each frequency made only in the A-configuration (to image the nucleus at the highest resolution and to minimize background contamination), to look for possible variability in the radio emission from the nucleus. We measured the integrated flux density of the source using the tasks IMFIT and IMEAN. (Uncertainties in the measurements are derived in a similar fashion to those for SN 1981K by Van Dyk et al. [1992].) The sampling in time is not very frequent, but Figure 5 indicates that during the monitoring of SN 1981K, the flux density varied by as much as 47% at both 6 and 20 cm, possibly undergoing outburst activity. The spectral index varied from to during this interval. To our knowledge, this is the first representation of the variability of the nucleus of NGC 4258. Variability of this kind is also exhibited by the LINER nucleus of M81 (Ho et al. 1999), albeit in much greater detail. Such behavior is consistent with the picture of a supermassive black hole being responsible for the activity in the radio from the nuclei of both galaxies.
4.4. The Anomalous Radio Arms
4.4.1 Description
Our high resolution images of NGC 4258 at 6 and 20 cm (see Figures 1a and b) show greater detail in the anomalous radio arms not visible in the previous lower resolution, lower sensitivity maps presented elsewhere (e.g., Hummel et al. 1989; van Albada & van der Hulst 1982), in particular, a large number of knots and filaments along both arms. As noted by previous studies, the general appearance of the northwestern and southeastern arms is quite different. Many of the individual sources listed by Turner & Ho (1994) along the arms are actually just the peak emission in the arms of the various knots.
The brightness of the northwestern anomalous arm decreases first to the north of the central region of NGC 4258 and then brightens again by 2.5 times at both wavelengths, to a maximum of 0.54 mJy beam-1 and 1.2 mJy beam-1 at 6 and 20 cm, respectively. The half-power width of this northwestern arm at the position of maximum flux density before bifurcation is after correcting for the beamsize broadening. The brightening and the subsequent bifurcation of the northwestern anomalous arm about 1 from the nucleus is apparent on even very low resolution maps. The northern and southern subsections of this arm after bifurcation also dim and then brighten considerably after bifurcation. While the northern section widens and further fragments into several bright filamentary structures, the southern section remains narrow and brightens into only one main filament.
In contrast to the northwestern anomalous radio arm, the southeastern anomalous arm has only one relatively bright region along its length. This region is located 3 times further along the arm from the center of NGC 4258 than the bright region in the northwestern arm before bifurcation. The flux density of the intervening length of the southeastern arm dims significantly from the central region to a minimum of 0.05 mJy beam-1 at 6 cm and 0.15 mJy beam-1 at 20 cm, and then increases to a maximum of 0.42 mJy beam-1 and 0.86 mJy beam-1 at 6 and 20 cm, respectively. The beam-corrected, half-power width of the southeastern arm at the position of maximum flux density is .
Emission (at the level) is detected from the 20 cm radio “plateaus” (see Figure 6a) south of the northwestern arm and north of the southeastern arm. We detect both broad, diffuse emission and a few large structures ( level) in the western plateau, while very little diffuse emission is evident from the eastern plateau. The eastern plateau does show several structures ( level) extending into it from the southeastern arm. Since the radio emission is largely nonthermal (see §4.4.2 below), the plateaus and any substructuring are much fainter at 6 cm (see Figure 6b).
While much of the plateau emission is faint in these high resolution maps, comparison of our lower resolution maps (not shown) with those of others (Hummel et al. 1989; van Albada & van der Hulst 1982) reveals more distinct diffuse emission and extensions from the arms into the plateaus at both wavelengths. Also, the absolute flux level of the plateaus is underrepresented at 6 cm, and less so at 20 cm, due to missing very short spacings in the UV coverage. While D configuration observations and zero-spacing fluxes were included in the imaging process, a shallow (1–2), negative “bowl” is still present in the 6 cm image, and a shallower one in the 20 cm image, further hindering the detection of fainter emission in the radio plateaus.
4.4.2 Spectral Index Map
Hummel et al. (1989) determined the spectral index distribution of the radio arms at 14 resolution, and de Bruyn (1977) and Krause et al. (1984) at even poorer resolution. No large-scale spectral index variations were observed, although Hummel et al. (1989) detected a possible flattening of the spectrum from to 0.5 along the northern ridge of the northwestern arm. We have generated a spectral index map of the radio arms from our MEM images to search for variations that may be more evident at higher resolution and sensitivity.
In order to make the spectral index map, we first adjusted the absolute flux density level of the images as corrections for the negative “bowls” discussed above in §4.4.1. The background level was sampled along the relatively emission-free regions below the southeastern arm and above the northwestern arm and determined to be 20 10Jy beam-1 at 6 cm and 15 10 Jy beam-1 at 20 cm. These mean values were subtracted from the corresponding images. Then, the AIPS task COMB was used to create the spectral index map from the bowl-corrected images. We applied a clipping level of 90Jy beam-1 (4.5 at 6 cm, 3 at 20 cm) in order to blank out regions of low signal-to-noise ratio which tend to give unrealistic spectral index values. The resulting spectral index map is shown in Figure 7.
The nucleus and H II region candidates are obvious flat spectrum sources with between +0.05 and 0.25 (see Table 1), while the radio arms have a generally steep spectrum with . No large-scale spectral index variations are apparent along either arm, in agreement with Krause et al. (1984). In addition to the spectral index map, in Figure 8 we present mean values of measured using rectangular apertures typically in size at a number of positions along the anomalous radio arms, in order to further investigate possible variations not apparent in Figure 7. The uncertainties reflect both the standard deviation in the spectral index measurements within each aperture and uncertainty in the bowl correction. The points plotted in Figure 8 are derived from the highest radio surface brightness regions of the anomalous arms measured from the nucleus outward. The spectral indices for the northwestern and southeastern arms are quite similar; however, the spectrum of the northern and southern subsections of the northwestern arm appears to flatten after bifurcation from to . No such trend is seen for the southeastern arm.
Note that we are not able to study the spectral index distribution of the radio plateaus, due to poor signal-to-noise in those regions. Using 1 resolution images at 0.6 and 1.4 GHz, de Bruyn (1977) determined to be 0.7, consistent with the arms. For the integrated radio emission, Krause et al. (1984) and Hummel et al. (1989) report a spectral index of for frequencies below 5 GHz, in agreement with our value for the arms, and at higher frequencies.
We do not see in either Figure 7 or 8 any significant variation of spectral index across the anomalous arms, as claimed to be the case by Hummel et al. (1989). Such a variation is used by Cox & Downes (1996) as an argument that the anomalous arms are shocked gas flow due to a bar potential. Any variations are on a small spatial scale without any systematic trends. We see nothing in our maps to contradict the contention that the arms are associated with changing jet activity from the nucleus (Cecil et al. 2000) and are in the galactic plane. Cecil et al. (2000) claim that the jet has recently moved out of the plane, but above we have already called into question the identity of their putative radio jet hot spots.
5. Conclusions
We have mapped the radio structure of the galaxy NGC 4258 at 6 and 20 cm with higher resolution than previously available to identify H II region and SNR candidates and to determine the structure of its peculiar anomalous radio arms. Seven thermal and five nonthermal radio sources are detected on our resolution radio maps that we identify as H II region and SNR candidates, respectively. We have identified optical counterparts to all of the H II region candidates and to three of the SNR candidates on the H image by Dutil & Roy (1999). Two of the SNR candidates also coincide with X-ray sources (Vogler & Pietsch 1999).
By comparing the radio and optical measurements of the H II region candidates for the first time, we obtain an average value of = 2.5 1.0 for the visual extinction toward the H II regions in NGC 4258. This extinction in NGC 4258 is similar to that found for M51 and 1 mag higher than that found for M81 and NGC 6946. We obtain for NGC 4258 higher values of extinction from our radio-to-H method than those obtained using the Balmer decrement (Dutil 1998), which may be due to a patchy dust environment within or near the H II regions.
We find the bright end of the H II region radio luminosity function to be fit well by a power law with an index of at both 6 and 20 cm. This value is within the range of indices derived for other nearby spiral galaxies.
The SNRs are found to be very luminous, comparable to the extraordinary SNR in NGC 6946 (Van Dyk et al. 1994). Additionally, the LINER nucleus is found to be variable in the radio, consistent with the behavior of M81’s nucleus (Ho et al. 1999).
The anomalous radio arms are found to have no large scale variation in spectral index, in agreement with Krause et al. (1984), although a possible flattening of the spectral index along the northwestern anomalous sections may be seen. We obtain a mean value of for the arms, consistent with that found in lower resolution studies.
References
- Belley & Roy (1992) Belley, J., & Roy, J.-R. 1992, ApJS, 78, 61.
- Blair, W. P.; Fesen, R. A.; Schlegel (2001) Blair, W.P., Fesen, R.A., & Schlegel, E.M. 2001, AJ, in press.
- Braun & Walterbos (1993) Braun, R., & Walterbos, R. 1993, A&AS, 98, 327.
- Bridle & Schwab (1988) Bridle, A.H. & Schwab, F.R. 1988, in ASP Conf. Ser. 6, Synthesis Imaging in Radio Astronomy, ed. R.A. Perley, F.R. Schwab, & A.H. Bridle (San Francisco: ASP), 247.
- Cecil et al. (1992) Cecil, G., Wilson, A.S., & Tully, R.B. 1992, ApJ, 390, 365.
- Cecil et al. (2000) Cecil, G., Greenhill, L.J., DePree, C.G., Nagar, N., Wilson, A.S., Dopita, M.A., Perez-Fournon, I., Argon, A.L., & Moran, J.M. 2000, ApJ, 536, 675.
- Chary et al. (2000) Chary, R., Becklin, E.E., Evans, A.S., Neugebauer, G., Scoville, N.Z., Matthews, K., & Ressler, M.E. 2000, ApJ, 531, 756.
- Condon (1992) Condon, J.J. 1992, ARA&A, 30, 575.
- Courtes & Cruvellier (1961) Courtes, G., & Cruvellier, P. 1961, CR Acad. Sci. Paris, 253, 218.
- Courtes et al. (1993) Courtes, G., Petit, H., Hua, C.T., Martin, P., Blecha, A., Huguenin, D., & Golay, M. 1993, A&A, 268, 419.
- Cox & Downes (1996) Cox, P., & Downes, D. 1996, ApJ, 473, 219.
- de Bruyn (1977) de Bruyn, A.G. 1977, A&A, 58, 221.
- Dunne, Gruendl, & Chu (2000) Dunne, B.C., Gruendl, R.A., Chu, Y.-H. 2000, AJ, 119, 1172.
- Duric et al. (1993) Duric, N., Viallefond, F., Goss, W.M., & van der Hulst, J.M. 1993, A&AS, 99, 217.
- Duric et al. (1995) Duric, N., Gordon, S.M., Goss, W.M., Viallefond, F., & Lacey, C. 1995, ApJ, 445, 173.
- Dutil (1998) Dutil, Y. 1998, PhD Thesis.
- Dutil & Roy (1999) Dutil, Y., & Roy, J.-R. 1999, ApJ, 516, 62.
- Feinstein (1997) Feinstein, C. 1997, ApJS, 112, 29.
- Ford et al. (1986) Ford, H.C., Dahari, O., Jacoby, G.H., Crane, P.C., & Ciardullo, R. 1986, ApJ, 311, L7.
- Gebel (1968) Gebel, W.L. 1968, ApJ, 153, 743.
- Gordon et al. (1999) Gordon, S.M., Duric, N., Kirshner, R.P., Goss, W.M., & Viallefond, F. 1999, ApJS, 120, 247.
- Greenhill et al. (1995) Greenhill, L.J., Jiang, D.R., Moran, J.M., Reid, M.J., Lo, K.Y., & Claussen, M.J. 1995, ApJ, 440, 619.
- Herrnstein et al. (1997) Herrnstein, J.R., Moran, J.M., Greenhill, L.J. Inoue, M, Nakai, N., Miyoshi, M., & Diamond, P.J. 1997, BAAS, 191, 25.07.
- Ho et al. (1999) Ho, L.C., Van Dyk, S.D., Pooley, G.G., Sramek, R.A., & Weiler, K.W. 1999, AJ, 118, 843.
- Hummel et al. (1989) Hummel, E., Krause, M., & Lesch, H. 1989, A&A, 211, 266.
- Hyman et al. (2000) Hyman, S.D., Lacey, C.K., Weiler, K.W., & Van Dyk, S.D. 2000, AJ, 119, 1711.
- Israel (1980) Israel, F.P. 1980, A&A, 90, 246.
- Kaufman et al. (1987) Kaufman, M., Bash, F.N., Kennicutt, R.C., & Hodge, P.W. 1987, ApJ, 319, 61.
- Kennicutt, Edgar, & Hodge (1989) Kennicutt, R.C., Edgar, B.K, & Hodge, P.W. 1989, ApJ, 337, 761.
- Krause et al. (1984) Krause, M., Beck, R., & Klein, U. 1984, A&A, 138,385.
- Krause et al. (1990) Krause, M., Cox, P., Garcia-Barreto, J. A., & Downes, D. 1990, A&A, 233, L1.
- Kronberg, Bierman, & Schwab (1985) Kronberg, P.P., Bierman, P., & Schwab, F.R. 1985, ApJ, 291, 693.
- Lacey, Duric, & Goss (1997) Lacey, C., Duric, N., & Goss, W.M. 1997, ApJS, 109, 417.
- Martin et al. (1989) Martin, P., Roy, J.-R., Noreau, L., & Lo, K.Y. 1989, ApJ, 345, 707.
- Mathewson et al. (1983) Mathewson, D.S., Ford, V.L., Dopita, M.A., Tuohy, I.R., Long, K.S., & Helfand, D.J. 1983, ApJS, 51, 345.
- Miller & Mathews (1972) Miller, J.S. & Mathews, W.G. 1972, ApJ, 172, 593.
- Miller & Scalo (1979) Miller, G.E., & Scalo, J.M. 1979, ApJS, 41, 513.
- Mills (1983) Mills, B.Y. 1983, in Supernova Remnants And Their X-Ray Emission, ed. J. Danziger, & P. Gorenstein, P. 551.
- Miyoshi et al. (1995) Miyoshi, M., Moran, J., Herrnstein, J., Greenhill, L., Nakai, N., Diamond, P., & Inoue, M. 1995, Nature, 373, 127.
- Oort (1987) Oort, M.J.A. 1987, A&AS, 71, 221.
- Pietsch et al. (1995) Pietsch, W., Vogler, A., Kahabka, P., Jain, A., & Klein, U. 1994, A&A, 294, 386.
- Rozas, Beckman, & Knapen (1996) Rozas, M., Beckman, J.E., & Knapen, J.H. 1996, A&A, 307, 735.
- Sandage & Tammann (1981) Sandage & Tammann 1981, A Revised Shapley-Ames Catalog of Bright Galaxies (Washington: Carnegie Inst. Washington)
- Sarazin (1976) Sarazin, C.L. 1976, ApJ, 208, 323.
- Srinivasan et al. (1984) Srinivasan, G., Dwarakanath, K. S., & Bhattacharya, D. 1984, JApA, 5, 403.
- (46) Turner, J.L., & Ho, P.T.P. 1994, ApJ, 421, 122.
- (47) Ulvestad, J. S. & Antonucci, R.R.J. 1997, ApJ, 488, 621.
- van Albada & van der Hulst (1982) van Albada, G.D., & van der Hulst, J.M. 1982, A&A, 115, 263.
- van der Hulst et al. (1988) van der Hulst, J.M., Kennicutt, R.C., Crane, P.C., & Rots, A.H. 1988, A&A, 195, 38.
- van der Kruit et al. (1972) van der Kruit, P.C., Oort, J.H., & Mathewson, D.S. 1972, A&A, 21, 169.
- Van Dyk et al. (1992) Van Dyk, S.D., Weiler, K.W., Sramek, R.A., & Panagia, N. 1992, ApJ, 396, 1995.
- Van Dyk et al. (1994) Van Dyk, S.D., Sramek, R.A., Weiler, K.W., Hyman, S.D., & Virden, R.E. 1994, ApJ, 425, L77.
- Viallefond & Goss (1986) Viallefond, F. & Goss, W.M. 1986, A&A, 154, 357.
- Vogler & Pietsch (1999) Vogler, A., & Pietsch, W. 1999, A&A, 352, 64.
- Weiler & Panagia (1978) Weiler, K.W. & Panagia, N. 1978, A&A, 70, 419.
- Weiler et al. (1986) Weiler, K.W., Sramek, R.A., Panagia, N., van der Hulst, J.M., & Salvati, M. 1986, ApJ, 301, 790.
| Source | R.A.(J2000) | Dec.(J2000) | (H)bbIn units of ergs cm-2 s-1. | (6) | (20) | (Bal)ccExtinctions determined from Balmer decrements are from Dutil (1998). For apparently single radio sources corresponding to two optical sources, two extinction values are listed. | |||
|---|---|---|---|---|---|---|---|---|---|
| (h m s) | ( ) | (mJy) | (mJy) | (mag) | (mag) | (mag) | |||
| 1 | 12 18 55.2 | 47 20 35.5 | 1.32 0.08 | 1.24 0.15 | +0.05 0.11 | 2.42 0.01 | 2.2 0.1 | 2.0 0.2 | 1.81, 1.48 |
| 2 | 12 18 55.8 | 47 20 24.3 | 0.88 0.08 | 1.00 0.15 | 0.11 0.15 | 2.14 0.01 | 1.8 0.1 | 1.8 0.2 | 1.65 |
| 3 | 12 18 56.5 | 47 20 14.4 | 0.64 0.11 | 0.81 0.13 | 0.20 0.20 | 1.36 0.01 | 2.0 0.2 | 2.2 0.2 | 1.98 |
| 4 | 12 18 57.4 | 47 20 04.6 | 0.50 0.08 | 0.66 0.11 | 0.22 0.19 | 1.69 0.01 | 1.4 0.2 | 1.6 0.2 | 1.33, 1.33 |
| 5 | 12 18 58.2 | 47 19 03.9 | 0.56 0.12 | 0.66 0.18 | 0.13 0.28 | ||||
| 6 | 12 18 58.2 | 47 19 10.1 | 0.33 0.09 | 0.33 0.18 | +0.02 0.51 | ||||
| 5+6ddThe H flux of a single optical source overlapping sources 5 and 6 was measured. See text in §4.1.1 | 1.18 0.12 | 1.65 0.28 | 0.26 0.13 | 0.52 0.01 | 4.2 0.1 | 4.5 0.2 | 2.26 | ||
| 7 | 12 18 57.0 | 47 19 03.9 | 0.26 0.08 | 0.71 0.14 | 0.82 0.30 | ||||
| 8 | 12 18 47.9 | 47 18 03.3 | 0.23 0.06 | 0.43 0.12 | 0.50 0.32 | ||||
| 9 | 12 19 01.3 | 47 15 25.0 | 1.89 0.15 | 2.56 0.22 | 0.25 0.10 | 2.58 0.02 | 2.6 0.1 | 2.9 0.1 | 1.42 |
| 10 | 12 18 55.3 | 47 16 47.9 | 0.20 0.10 | 0.31 0.07 | 0.37 0.46 | 0.29 0.01 | |||
| 11 | 12 18 57.6 | 47 16 07.0 | 0.27 0.09 | 0.53 0.08 | 0.56 0.31 | 0.15 0.01 | |||
| 12 | 12 18 56.3 | 47 16 50.3 | 0.31 0.09 | 0.64 0.12 | 0.58 0.29 | 0.55 0.01 | |||
| nucleus | 12 18 57.5 | 47 18 14.5 | 2.36 0.16 | 3.14 0.29 | 0.24 0.10 | 0.46 0.01 |
| Source | R.A.(J2000) | Dec.(J2000) | |||
|---|---|---|---|---|---|
| (h m s) | ( ) | (mJy) | (mJy) | ||
| 13 | 12 18 56.5 | 47 23 53.4 | 0.67 0.10 | 1.81 0.09 | 0.82 0.13 |
| 14 | 12 18 46.1 | 47 23 12.4 | 0.36 0.10 | 0.83 0.12 | 0.70 0.25 |
| 15 | 12 19 19.0 | 47 19 07.6 | 0.92 0.12 | 2.09 0.23 | 0.69 0.14 |
| 16a | 12 19 32.6 | 47 18 20.5 | 2.43 0.20 | 7.76 0.40 | 0.97 0.08 |
| 16b | 12 19 32.0 | 47 17 55.8 | 1.75 0.14 | 2.09 0.23 | 0.15 0.11 |
| 16c | 12 19 31.5 | 47 17 48.4 | 0.66 0.20 | 2.48 0.11 | 1.09 0.26 |
| 16d | 12 19 31.0 | 47 17 38.5 | aaSource 16d is not detected at 6 cm, probably due to primary beam attenuation. | 3.16 0.16 | |
| 17a | 12 18 46.6 | 47 14 44.0 | 1.42 0.15 | 5.17 0.35 | 1.07 0.10 |
| 17b | 12 18 46.4 | 47 14 27.9 | 0.67 0.17 | bbSource 17b cannot be separated from 17c at 20 cm, due to bandwidth smearing. The combined flux at each wavelength was used to calculate an average spectral index given below for source “17b+c”. | |
| 17c | 12 18 46.2 | 47 14 19.3 | 3.06 0.22 | bbSource 17b cannot be separated from 17c at 20 cm, due to bandwidth smearing. The combined flux at each wavelength was used to calculate an average spectral index given below for source “17b+c”. | |
| 17b+c | 3.73 0.28 | 11.68 0.34 | 0.95 0.07 |
| Source | ||||||
|---|---|---|---|---|---|---|
| (mJy) | (mJy) | (W Hz) | ( yr-1) | (s) | (yr) | |
| 1 | 1.32 | 1.24 | 8.44 | 0.018 | 6.29 | 7.37 |
| 2 | 0.88 | 1.00 | 5.61 | 0.012 | 4.18 | 4.90 |
| 3 | 0.58 | 0.65 | 3.70 | 0.008 | 2.76 | 3.23 |
| 4 | 0.45 | 0.50 | 2.84 | 0.006 | 2.12 | 2.45 |
| 5 | 0.55 | 0.62 | 3.49 | 0.007 | 2.61 | 3.05 |
| 6 | 0.33 | 0.33 | 2.14 | 0.005 | 1.59 | 1.87 |
| 9 | 1.60 | 1.80 | 10.2 | 0.022 | 7.61 | 8.91 |