Evolution of Iron Kα Line Emission in the Black Hole Candidate GX 3394
Abstract
GX 339-4 was regularly monitored with RXTE during a period (in 1999) when its X-ray flux decreased significantly (from 4.2 erg cm to 7.6 erg cm-2s-1 in the 3–20 keV band), as the source settled into the “off state”. Our spectral analysis revealed the presence of a prominent iron Kα line in the observed spectrum of the source for all observations. The line shows an interesting evolution: it is centered at 6.4 keV when the measured flux is above 5 erg cm, but is shifted to 6.7 keV at lower fluxes. The equivalent width of the line appears to increase significantly toward lower fluxes, although it is likely to be sensitive to calibration uncertainties. While the fluorescent emission of neutral or mildly ionized iron atoms in the accretion disk can perhaps account for the 6.4 keV line, as is often invoked for black hole candidates, it seems difficult to understand the 6.7 keV line with this mechanism, because the disk should be less ionized at lower fluxes (unless its density changes drastically). On the other hand, the 6.7 keV line might be due to recombination cascade of hydrogen or helium like iron ions in an optically thin, highly ionized plasma. We discuss the results in the context of proposed accretion models.
1 Introduction
GX 3394 was discovered in the MIT OSO-7 sky survey (Markert et al. 1973). We now know that for all practical purposes GX 339-4 is a persistent X-ray source. It is considered as a black hole candidate (BHC), because its spectral and temporal X-ray properties are similar to those of dynamically determined BHCs, such as Cyg X-1 (see review by Tanaka & Lewin 1995). For instance, GX 3394 shows a variety of spectral states, often designated as “off”, “low”, “intermediate”, “high”, and “very high”. It is worth noting, however, that the “off state” is thought to be simply a weak “low state” (e.g., Motch et al. 1985; Kong et al. 2000). Recently, it is shown that GX 339-4 also bears resemblance to GRO J165540 and GRS 1915105, two well-known “micro-quasars”, in terms of the observed radio properties (Zhang et al. 1997). The radio emission of GX 339-4 is also thought to be due to synchrotron emission of electrons in jet-like outflows (Fender et al. 1999). Interestingly, the radio emission, as well as the optical emission, is found to be strongly correlated with the hard X-ray emission but anti-correlated with the soft X-ray emission (Fender et al. 1997, 1999; Corbel et al. 2000; Steiman-Cameron et al. 1990; Imamura et al. 1990; Ilovaisky et al. 1986); similar correlations were first noted for Cyg X-1 (Zhang et al. 1997).
The observed X-ray spectrum of GX 339-4 can often be described by a two-component model: a blackbody-like component at low energies and a power law at high energies, which is typical of BHCs (Tanaka & Lewin 1995). The soft component is usually attributed to emission from the hot, inner region of an optically thick and geometrically thin disk, and the hard component to the Comptonization of soft photons by energetic electrons (thermally or non-thermally distributed) in the region. Iron Kα line emission has been detected in GX 339-4 at around 6.4 keV (Ueda et al. 1994; Wilms et al. 1999; Smith et al. 1999). The line probably originates in the fluorescent emission of cold iron atoms in the accretion disk, which is illuminated by the hard X-ray source. It can, therefore, be used as a valuable tool to study the physical conditions of accretion flows, such as their ionization states.
In this paper, we report results from a detailed study of iron Kα line emission in GX 339-4. The source was observed by the instruments aboard the Rossi X-ray Timing Explorer (RXTE) over a period when its flux dropped by almost two orders of magnitude (down to the detection limit of RXTE). We show that not only was the line always present in the observed X-ray spectrum but it evolved significantly at low fluxes (i.e., in the “low” or “off” states). We discuss the significance of the line detection, in light of possible uncertainties in the calibration of the instruments. We also discuss the potential impact of the results on the proposed accretion models for BHCs.
2 Data and Data Reduction
We observed GX 3394 regularly with the Proportional Counter Array (PCA) and the High-Energy X-ray Time Experiment aboard RXTE between Apr. 27, 1999 and Sept. 4, 1999, as a part of our Target-of-Opportunity campaign to follow the source from the “low state” to the “off state”. For this investigation, we also included public data from other observations of GX 339-4 that were made during this time period. A total of 17 observations were used to cover the very tail of the decaying phase of an X-ray outburst (which started in 1998). Fig. 1 shows the ASM light curve of the source for this period and the times of the RXTE observations. Since we were mostly interested in iron Kα line emission between 6–7 keV, we used data only from the PCA, which covers a nominal energy range of 2–60 keV. Table 1 summarizes some of the key parameters of the observations.
The PCA is consisted of five Proportional Counter Units (PCUs). The operation of the detector requires that some of the PCUs be turned off at times, therefore, the number of PCUs in use varies from observation to observation (as indicated in Table 1). To minimize instrumental effects, we chose to use data from the first (of the three) xenon layer of each PCU, which is most accurately calibrated. Such data also provides the best signal-to-noise ratio, because photons from real astronomical sources are mostly stopped in the first layer. This is clearly very important for studying iron Kα lines in BHCs, which are usually weak. The trade-off of such a choice is that we lost sensitivity at energies above 20 keV. This loss is not critical to this investigation, because the main objective here is, again, to study line emission at 6–7 keV and the energy band is broad enough that we can adequately constrain the underlying continuum.
We used ftools v5.0 to reduce and analyze the data, along with the most updated calibration files and background models that accompanied the release of the software package. Because the source became very faint as it approached the “off state”, to obtain adequate statistics we sometimes combined data from multiple observations (in which the X-ray spectrum of the source did not vary significantly) to form one data group for further analyses. As a first step, we eliminated time intervals when the data is affected by earth occultation, SAA passages, and soft electron events. We then extracted a sum spectrum for each PCU from the Standard 2 data of individual or a group of observations, and constructed a corresponding background spectrum using the background models that are appropriate for the data set. For cases where the average source rate is greater than 40 ct/sec/PCU, a set of background models for bright sources (pca-bkgd-skyvle-e4v20000131.mdl and pca-bkgd-allskyactiv-e4v20000131.mdl) were used; otherwise, those for faint sources (pca-bkgd-faintl7-e4v19991214.mdl and pca-bkgdfaint240-e4v19991214.mdl) were used. Finally, we read both the sum and background spectra into XSPEC for visual inspections. As a sanity check, we verified that the background spectrum was in total agreement with the sum spectrum at the highest energies where no photons from the source are expected.
For spectral analysis, we constructed a response matrix for the first xenon layer of each PCU (with pcarsp v2.43, which comes with ftools v5.0). To be conservative, we limited the analysis to an energy range of 3–20 keV, in which the systematic uncertainty associated with the response matrices appears to be small and understood. Following the conventional approach, we added 1% systematic error to the data to account for any remaining uncertainty in the calibration.
3 Modeling and Results
To model the observed spectrum of GX 339-4, we first experimented with a simple power law (with absorption). For each data set, we performed a joint fit in XSPEC to the spectra from all PCUs that were turned on during the observation(s). Note that in the cases of multiple observations combined the effective exposure time can be different for different PCUs, because some were turned off during a subset of observations (see Table 1). During the fit, we fixed the column density to (Wilms et al. 1999; Kong et al. 2000), because it is poorly constrained by the data here. The model seems to adequately describe the spectrum in all cases, but we found significant residuals in the range of 6–7 keV (very similar to those shown in Fig. 2), indicating the presence of an iron Kα line. Adding a Gaussian function to the model indeed improves the fit significantly, for example, (with 3 added degrees of freedom) for the average spectrum of observations 6-17. However, the composite model (power law plus Gaussian) is still not satisfactory for early observations (when the source was relatively bright).
Next, we added a soft component, “diskbb” in XSPEC, to the “powerlaw+Gaussian” model. This so-called “multi-color disk” model is commonly used to describe the low-energy “excess” of the observed X-ray continuum of BHCs. With the new model, we obtained a significantly improved fit to the data for early observations. However, the improvement is minimal ( = 2–4 with 2 added degrees of freedom) for later observations. The results are summarized in Table 2. The uncertainties were derived by varying the parameter of interest until and thus represent 90 confidence regions (Lampton, Margon & Bowyer 1976).
The observed X-ray continuum of GX 339-4 is dominated by the power law component, which is typical of the “low state” of BHCs. It is worth pointing out that small inferred normalization for “diskbb” must not be interpreted literally as small radius of the inner edge of the accretion disk, as is frequently done in the literature. In the context of Comptonization models, a weak disk component may simply mean that the X-ray emitting portion of the disk is covered up by the Comptonizing corona and thus little disk emission leaks through. The fact that the Comptonized emission (i.e., the power-law component) is dominant is consistent with this scenario, if seed photons come mostly from the disk.
GX 339-4 shows a clear spectral evolution as it approaches the “off state”. This is manifested in the gradual disappearance of the soft component and the shift of the emission line. When the measured flux (between 3 and 20 keV) is greater than 5 erg cm, the best-fit line energy is around 6.4 keV, which is in general agreement with the results of Wilms et al. (1999) based on earlier RXTE observations of GX 339-4 in a similar spectral state. It should be noted, however, that a direct comparison between our results and those of Wilms et al. is difficult because of different continuum models adopted. For these observations, we also fitted the data with one of the models that Wilms et al. used (broken power law plus Gaussian) and the results are indeed similar to theirs. In addition, we made an attempt to search for a possible absorption edge that may accompany the observed emission line, but we failed to detect it with any meaningful significance. In fact, the of the fit hardly changes with the addition of such an edge, regardless whether we fixed the energy of the edge or not. This may simply mean that the statistics of the data are not good enough to allow a detection of the edge. In general, we found that the energy of the line is not sensitive to the continuum models that we have tried, although both the width and flux of the line are.
When the source becomes fainter, however, the energy of the line moves up to around 6.7 keV, which has not been seen before. To quantify the significance of the line shift, we combined data from observations 6 to 17 (see Table 2) to obtain an average spectrum of the “off state”. We then carried out the same spectral analysis and the results are also shown in Table 2. We conducted the following F-test. We fixed the energy of the line to 6.4 keV in the model (with all other parameters floating) and fitted the data again. We found that increased by 15. The F-value is then , which corresponds to a null probability of . In other words, at a confidence level of 99.998% the shift in the line energy is real as the source entered the “off state”. For comparison, we also combined data from observations 1 to 5 to obtain an average spectrum of the “low state” and showed the results of spectral analysis in Table 2. The table also lists the equivalent width of the line for each data set. Again, our results roughly agree with those of Wilms et al. (1999) for cases in which the source is relatively bright. The line seems to strengthen toward the “off state”, although the uncertainties are still large in these cases.
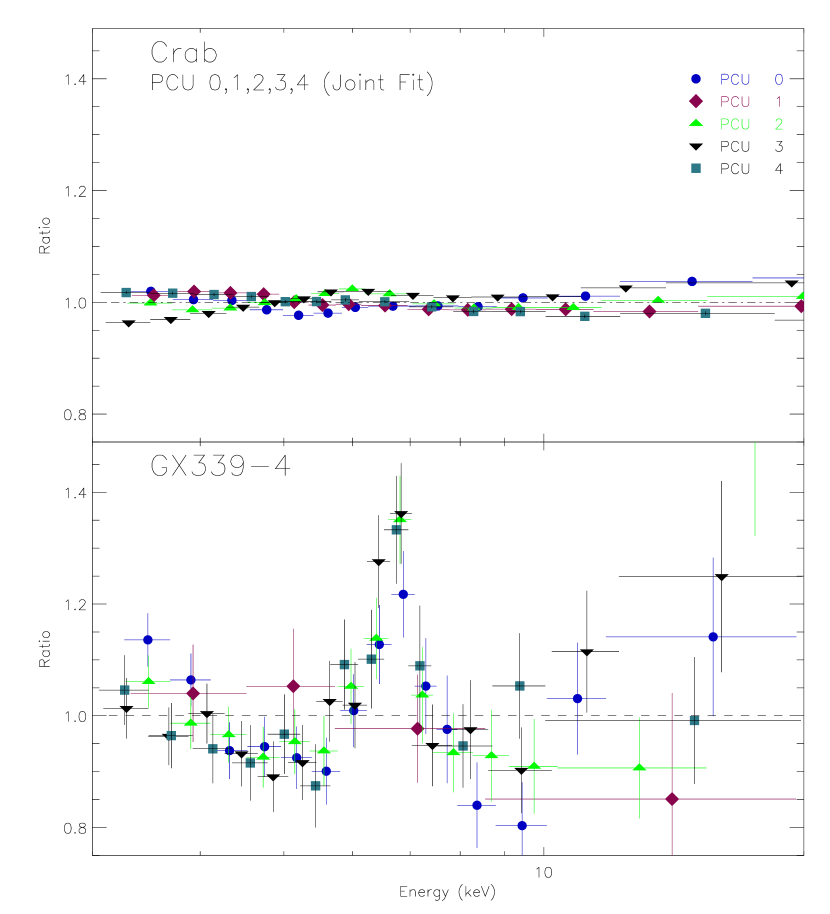
To exclude the possibility that the observed line is a calibration artifact, we analyzed data from an observation of the Crab Nebula, which was made roughly during the same period (Observation ID 40093-01-03-00, on Apr. 5, 1999). The data were screened, reduced, and analyzed by following exactly the same procedure as in the case of GX 339-4. We fitted the Crab spectrum with a simple power law (with absorption) and the best-fit parameters are: NH=3.0 cm-2, photon index 2.174, and normalization 12.14 s-1, all of which appear normal for the source (e.g., Toor Seward 1974). Fig. 2 (upper panel) shows the residuals of the fit. Over the entire energy range of interest, the residuals are never greater than 4%. For comparison, we also plotted in Fig. 2 (lower panel) the residuals of a fit to the “off state” spectrum of GX 339-4 (see Table 2) without the Gaussian component. The peak of the line feature at 6.7 keV is about 40% above the best-fit continuum model! Therefore, we conclude that the line is unlikely to be an artifact due to calibration uncertainties.
Next, we investigated whether the evolution of the emission line could be caused by a systematic shift in the gain of the detector. We analyzed data from two observations of Cas A: one was conducted during epoch 3 (Observation ID 30804-01-01-00, on Apr. 14, 1998) and the other (Observation ID 40806-01-04-00, on Sept. 15, 1999) was contemporary with the GX 339-4 observations. Again, we followed the same procedure for data reduction and analysis. We found an excellent agreement in the derived line energy between the two cases (and the results agree with those in the literature for Cas A; e.g., Holt et al. 1994). We conclude that the observed evolution of the line energy is real.
Finally, we demonstrated that the detected line emission could not be due to contamination by diffuse X-ray emission in the “Galactic Ridge” (Koyama et al. 1986). Integrated over the PCA’s field of view, the flux of the iron Kα line from the Galactic Ridge emission (at 6.7 keV) is about 1.7 – 3.5 erg cm -2s-1 in the direction of GX 3394 (Kaneda et al.1997; Valinia Marshall 1998). This is more than an order of magnitude smaller than that detected line flux of GX 339-4 (5.0 erg cm -2s-1) in the ‘off’ state. In other words, the contamination can be no more than 10%.
4 Discussion
We have detected iron Kα line emission both in the “low state” and the “off state” of GX 339-4. The line is centered at 6.4 keV when the source is relatively bright (in the “low state”) but is shifted to 6.7 keV at lower fluxes (in the “off state”). GX 339-4 was also observed by BeppoSAX in the “off state” (Kong et al. 2000; see Fig. 1 for the time of their observation), but no detection of any emission lines was reported (with an upper limit on the equivalent width of an iron Kα line about 600 eV). It should be noted, however, that compared to the PCA on RXTE (even with just the first xenon layer) the detectors on BeppoSAX (MECS in this case) have much smaller effective areas. Consequently, they (as well as the SIS or GIS on ASCA) are not well suited for studying relatively broad emission lines, which may be the case here.
For BHCs, iron Kα lines are usually attributed to the fluorescent emission of iron species in the accretion disk which is illuminated by a hard X-ray source. Therefore, the detection of such a line at 6.4 keV indicates that the accretion disk in GX 339-4 is neutral or only mildly ionized in the “low state”. As the source approaches the “off state”, the X-ray flux decreases and thus the disk should be even less ionized (unless its density decreases drastically). Clearly, this line production mechanism would have difficulty in explaining the line detected at 6.7 keV in the “off state”. Therefore, we speculate that the accretion flows in GX 339-4 must have undergone a significant change when the source went from the “low state” to the “off state”.
One possible scenario is that in the “off state”, when the mass accretion rate is presumably very low, the accretion may take place in the form of advection dominated accretion flows (ADAFs; e.g., Narayan & Yi 1994). In an ADAF region, viscously dissipated energy during the accretion process is mostly stored as internal energy of protons; very little is transfered to electrons, via inefficient Coloumb collisions, and is radiated away. Consequently, the temperature of the plasma can be very high ( K) near the black hole but lower farther away. Even in the outer region, gas is likely to be almost fully ionized. In this case, a recombination line can be produced at 6.7 keV and 6.97 keV from He-like (Fe XXV) and H-like (Fe XXVI) iron ions, respectively, due to collisions (Masai 1984; Arnaud & Rothenflug 1985). Calculations show that emission lines from ADAFs are expected, although they should be very weak (Narayan & Raymond 1999). The line emission is enhanced in cases where an outflow or wind is formed (known as advection-dominated inflow and outflow systems, or ADIOS; Blandford & Begelman 1999). It is interesting to note that for GX 339-4 the observed strong correlation between the radio emission (and optical emission) and the hard X-ray emission has been suggested to be evidence for the presence of outflows in the “low” or “off” state (Fender et al. 1999).
In our case, the measured equivalent width of the line, taken at face value, seems to be larger than expected (see Narayan & Raymond 1999), even for an ADIOS scenario. However, we emphasize, again, that the error bars are still very large and the values are sensitive to instrumental effects. We think that the very presence of the 6.7 keV line in the “off state” is interesting and seems to point to a physical origin like ADAF or ADIOS. If this can be proven, we would also have a physical distinction between the “low state” and the “off state”: the transition between the two occurs when accretion flows switch from an optically thick, geometrically thin pattern to an optically thin, geometrically thick one (with possible outflows) and vice versa. In fact, the difference between the two states might have already manifested itself observationally in the radio properties of GX 339-4: we noticed that the radio spectrum seems to be significantly steeper in the “off state” than in the “low state” (see Table 1 of Corbel et al. 2000).
References
- (1) Arnaud, M., & Rothenflug, R., 1985, A&AS, 60, 425
- (2) Blandford, R.D., & Begelman, M.C., MNRAS, 1999, 303, L1
- (3) Corbel, S., Fender, R.P., Tzioumis, A.K., Nowak, M., McIntyre, V., Durouchoux, & P., Sood, R. 2000, AA, 359, 251
- (4) Fender, R.P., Spencer, R. E., Newell, S. J., Tzioumis, A.K. 1997, MNRAS, 287, L29
- (5) Fender, R.P., Corbel, S., Tzioumis, A.K., McIntyre, V., Campbell-Wilson, D., Nowak, M., Sood, R., Hinstead, R., Harmon, B.A., Durouchoux, P., Heindl, W. 1999, ApJ, 519, L165
- (6) Holt, S. S., Gotthelf, E. V., Tsunemi, H., & Negoro, H. 1994, PASJ, 46, L151
- (7) Ilovaisky, S. A., Chevalier, C., Motch, C., & Chiappetti, L. 1986, A&A, 164, 671
- (8) Imamura, J.N., Kristian, J., Middleditch, J., Steiman-Cameron, T.Y. 1990, ApJ, 365, 312
- (9) Kaneda, H., Makishima, K., Yamauchi, S., Koyama, K., Matsuzaki, K., & Yamasaki, N. Y. 1997, ApJ, 491, 638
- (10) Kong, A.K., Kuulkers, E., & Charles, P.A., Homer, L. 2000, MNRAS, 312, L49
- (11) Koyama, K., Makishima, K., Tanaka, Y., & Tsunemi, H. 1986, PASJ, 38, 121
- (12) Lampton, M., Margon, B., & Bowyer, S. 1976, ApJ, 208, 177
- (13) Markert, T.H,, Canizares, C.R., Clark, G.W., Lewin, W.H.G., Schnopper, H.W., & Sprott, G.F. 1973, ApJL, 184, L67
- (14) Motch, C., Ilovaisky, S. A., Chevalier, C., & Angebault, P. 1985, Space Sci. Rev., 40, 219
- (15) Masai, K. 1984, APSS, 98, 367
- (16) Narayan, R., & Yi, I. 1994, ApJ, 428, L13
- (17) Narayan, R., & Raymond, J. 1999, ApJ 515, L69
- (18) Smith, I. A., Liang, E. P., Lin, D., Moss, M., Crider, A., Fender, R. P.; Durouchoux, Ph., Corbel, S., & Sood, R. 1999, ApJ, 519, 762
- (19) Steiman-Cameron, T., Imamura, J., Middleditch, J., Kristian, J. 1990, ApJ, 359, 197
- (20) Tanaka, Y., & Lewin, W. H. G. 1995, in X-Ray Binaries, ed. W. H. G. Lewin, J. van Paradijs, E. P. J. van den Heuvel, (Cambridge: Cambridge Univ. Press), Chapt. 3, 126
- (21) Toor, A., & Seward, F.D. 1974, AJ, 79, 995
- (22) Ueda, Y., Ebisawa, K., Done, C. 1994, PASJ, 46, 107
- (23) Valinia, A. Marshall, F.E. 1998, ApJ, 505, 134
- (24) Wilms, J., Nowak, M. A., Dove, J. B., Fender, R. P., & di Matteo, T. 1999, ApJ, 522, 460
- (25) Zhang, S.N, Mirabel, I. F., Harmon, B. A., Kroeger, R. A., Rodriguez, L. F., Hjellming,R. M., & Rupen, M.P. 1997, Proc. the 4th Compton Symposium, AIP. 410, Eds. Dermer, Strickman and Kurfess, Part 1, pp. 141 (astro-ph/9707321)
| No. | Obs. Id. | Observation Date | PCUs | Exposure (s)††Total amount of on-source time after data filtering and screening |
|---|---|---|---|---|
| 1 | 40104–01–01–00 | 04/27/99 | 0,2,3 | 7680 |
| 2 | 40104–01–02–00 | 05/04/99 | 0,1,2,3,4 | 5792 |
| 3 | 40108–02–03–00 | 05/14/99 | 0,1,2,3,4 | 9856 |
| 4 | 40104–01–03–00 | 05/25/99 | 0,1,2,3 | 5152 |
| 5 | 40104–01–04–00 | 06/03/99 | 0,1,2,3,4 | 6128 |
| 6 | 40108–02–04–00 | 06/22/99 | 0,2,3,4 | 14608 |
| 7 | 40108–03–01–00 | 07/07/99 | 0,2,3 | 12896 |
| 8 | 40104–01–05–01 | 07/11/99 | 0,2,3,4 | 2256 |
| 9 | 40104–01–05–00 | 07/11/99 | 0,2,3,4 | 2704 |
| 10 | 40104–01–05–02 | 07/11/99 | 0,2,3,4 | 2432 |
| 11 | 40104–01–06–00 | 07/16/99 | 0,2,4 | 2752 |
| 12 | 40104–01–07–00 | 08/06/99 | 0,2 | 3072 |
| 13 | 40104–01–06–01 | 08/06/99 | 0,2,3 | 3040 |
| 14 | 40104–01–08–00 | 08/28/99 | 0,2,3 | 1056 |
| 15 | 40104–01–08–01 | 08/28/99 | 0,2,3 | 1984 |
| 16 | 40104–01–08–02 | 08/28/99 | 0,2,3 | 1456 |
| 17 | 40104–01–09–00 | 09/04/99 | 0,1,2,4 | 9024 |
| Gaussian | Multi-Color Disk | Power Law | ||||||
|---|---|---|---|---|---|---|---|---|
| No. | Tin | Nd | Flux | |||||
| keV | keV | eV | keV | |||||
| 1 | 131/116 | 4.25 | ||||||
| 2 | 164/186 | 2.93 | ||||||
| 3 | 140/186 | 1.52 | ||||||
| 4-5 | 133/186 | 0.46 | ||||||
| 6-7 | 111/147 | 0.15 | ||||||
| 8-13 | … | … | 86/149 | 0.07 | ||||
| 14-17 | … | … | 106/188 | 0.11 | ||||
| 1-5 | 196/186 | 1.91 | ||||||
| 6-17 | 142/186 | 0.13 | ||||||
Note. — The multi-color disk component is characterized by the temperature at the inner edge of the disk () and the overall normalization (, in units of ph cm-2 s-1). The energy, width, and equivalent width of the emission line are denoted by , , and , respectively, and the power-law photon index by . Also shown is the integrated 3–20 keV flux in units of 10-10 ergs cm-2s-1. The error bars represent 90 confidence intervals.