Detection of the optical afterglow of GRB 000630: Implications for dark bursts ††thanks: Based on observations made with the Nordic Optical Telescope, operated on the island of La Palma jointly by Denmark, Finland, Iceland, Norway, and Sweden, in the Spanish Observatorio del Roque de los Muchachos of the Instituto de Astrofisica de Canaria, and with the German-Spanish Astronomical Centre, Calar Alto, operated by the MPI für Astronomie, Heidelberg, jointly with the Spanish National Commission for Astronomy, and with the TNG, operated on the island of La Palma by the Centro Galileo Galilei of the CNAA at the Spanish Observatorio del Roque de los Muchachos of the Instituto de Astrofisica de Canarias.
Abstract
We present the discovery of the optical transient of the long–duration gamma-ray burst GRB 000630. The optical transient was detected with the Nordic Optical Telescope 21.1 hours after the burst. At the time of discovery the magnitude of the transient was R = 23.040.08. The transient displayed a power-law decline characterized by a decay slope of = 1.0350.097. A deep image obtained 25 days after the burst shows no indication of a contribution from a supernova or a host galaxy at the position of the transient. The closest detected galaxy is a R=24.680.15 galaxy 2.0 arcsec north of the transient. The magnitudes of the optical afterglows of GRB 980329, GRB 980613 and GRB 000630 were all R23 less than 24 hours from the burst epoch. We discuss the implications of this for our understanding of GRBs without detected optical transients. We conclude that i) based on the gamma-ray properties of the current sample we cannot conclude that GRBs with no detected OTs belong to another class of GRBs than GRBs with detected OTs and ii) the majority ( 75%) of GRBs for which searches for optical afterglow have been unsuccessful are consistent with no detection if they were similar to bursts like GRB 000630 at optical wavelengths.
Key Words.:
cosmology: observations – gamma rays: bursts1 Introduction
The discoveries of the first -ray afterglow (Costa et al. 1997) and Optical Transient (OT) (van Paradijs et al. 1997) of a gamma-ray burst (GRB) have led to a major breakthrough in GRB research. The determination of a redshift of 0.835 for GRB~970508 (Metzger et al. 1997), and the subsequent determination of redshifts of more than a dozen bursts with a median redshift of 1.0, have firmly established their cosmological origin (e.g. Kulkarni et al. 2000 and references therein).
In several cases supernovae (SNe) have been connected to GRBs. Attention to this connection was, from the observational side, first drawn in the remarkable case of GRB~980425 that was associated with SN1998bw (Galama et al. 1998). Furthermore, the light–curves of GRB 970228 and GRB 980326 (Reichart 1999, Galama et al. 2000; Castro-Tirado and Gorosabel 1999; Bloom et al. 1999) have bumps that are consistent with a contribution from an underlying SN. In no cases the presence of an underlying SN contribution to the light–curve has been firmly excluded. The exclusion of a SN contribution from the light–curve of GRB 990712 (Hjorth et al. 2000) was based on a wrong identification of the OT in the HST image. A revised analysis indeed shows an underlying SN contribution to the light–curve (Björnsson et al. 2001).
Moreover, for less than half ( 30%) of all GRBs with well-determined coordinates have searches for optical counterparts been successful. In some cases the lack of detection can be easily explained by too bright detection limits (e.g. due to light from the moon, nearby bright stars or twilight), too slow reaction time or high foreground extinction in the Galaxy. However, GRB 981226 (Frail et al. 1999) and GRB 990506 (Taylor et al. 2000) displayed no optical afterglow down to R–band limits of R=23 and R=23.5 less than half a day after the bursts (Jensen et al. 1999; Pedersen et al. 1999), and both had a detectable radio afterglow. GRB 970828 (Groot et al. 1998a) had a weak X-ray counterpart, but no OT was detected down to an R-band limit of 23.8 only 3 hours after the burst. It is still not known whether these ‘dark’ bursts constitute the faint end of a (continuous) OT luminosity function or whether they represent a special class of GRBs that are truly dark in the optical (in other words a dichotomy similar to the radio-loud vs. radio quiet dichotomy for QSOs).
In this paper we present the detection of the OT of GRB 000630. GRB 000630 was observed by Ulysses, Konus-Wind, NEAR, and the BeppoSAX GRBM June 30.02 UT (Hurley et al. 2000). GRB 000630 had a duration of 20 s, and a 25–100 keV fluence of 210-6 erg cm-2. These gamma-ray properties are consistent with the long–duration class of bursts (Hurley 1992; Kouveliotou et al. 1993). In Sect. 2 and in Sect. 3 we present our optical observations and the results we have obtained. We also discuss the implications of our results on our understanding of the 70% of GRBs with no detected optical counterparts. Finally we summarize our results in Sect. 4.
2 Observations
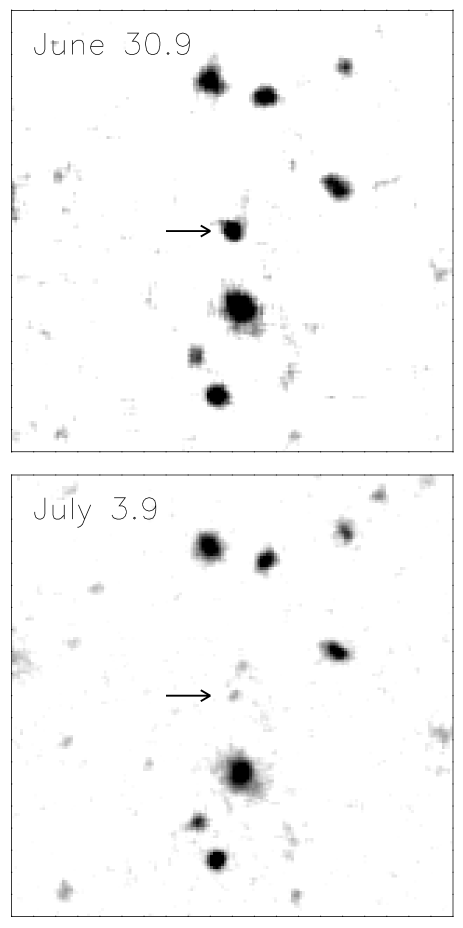
The IPN error-box of GRB~000630 (Hurley et al. 2000) was observed in the R–band with the 2.56-m Nordic Optical Telescope (NOT) on 2000 June 30.90 UT (0.88 days after the burst) using the Andalucía Faint Object Spectrograph (ALFOSC). Comparing with red and blue Palomar Optical Sky Survey II exposures no OT was found (Jensen et al. 2000a). Further R–band imaging of the field was carried out on July 1.9 UT. One object was found to have faded about one magnitude from June 30.90 to July 1.9. Subsequent deep R–band imaging obtained on July 3.9 UT confirmed the transient nature of the object and hence established this object as the likely optical afterglow of GRB 000630 (Jensen et al. 2000b). Further deep R–band imaging of the OT was obtained at the NOT on July 10.9 UT and on July 25.9 UT. We have also obtained R–band imaging with the U.S. Naval Observatory Flagstaff Station (USNOFS) 1.0-m telescope and the Calar Alto (CA) 2.2-m telescope (Greiner et al. 2000), and B and V images with the 3.5-m Telescopio Nazionale Galileo (TNG). The journal of observations is reported in Table LABEL:obslog.
| UT | Telescope | Band | Magnitude | Seeing | Exp. time |
|---|---|---|---|---|---|
| (arcsec) | (sec) | ||||
| June 30.87 | CA | R | 23.000.30 | 1.4 | 2600 |
| June 30.90 | NOT | R | 23.040.08 | 0.9 | 3300 |
| July 1.24 | USNO | R | 23.130.25 | 2.1 | 18600 |
| July 1.88 | NOT | R | 24.050.16 | 1.2 | 3600 |
| July 1.89 | CA | R | 23.850.22 | 1.3 | 2900 |
| July 3.91 | NOT | R | 24.670.14 | 0.8 | 5600 |
| July 4.06 | TNG | B | 26.0 | 1.0 | 1800 |
| July 4.10 | TNG | V | 25.440.23 | 1.3 | 1800 |
| July 10.9 | NOT | R | 25.3 | 1.1 | 6600 |
| July 25.9 | NOT | R | 26.1 | 0.8 | 11600 |
3 Results
3.1 Astrometry
By measuring the position of the OT relative to 29 stars in the USNO-A2.0 catalog we found the celestial coordinates of the OT to be RA(J2000) = 14:47:13.485, Dec(J2000) = +41:13:53.25. The rms deviations around a fit to the positions of the 29 stars is 0.3 arcsec. A region of the NOT images centred on the OT is shown in Fig. 1.
3.2 Photometry
3.2.1 The R–band light–curve
As the OT was faint at the time of discovery and as it is situated in a region with several nearby galaxies we have performed Point Spread Function (PSF) photometry with DAOPHOT II (Stetson S1987 (1987), S1997 (1997)) to measure the magnitude of the OT. We first performed relative PSF-photometry between the OT and stars in the field. Standard magnitudes for these stars were then obtained from Henden (2000) and the offset from the PSF-photometry to the standard system was derived. The magnitudes of the OT derived in this way are given in Table LABEL:obslog. The OT was not detected in the two latest epochs (July 10.9 and 25.9). For these epochs we have provided the 2 upper limits to the OT R–band magnitude.
To derive the light–curve parameters we fit a linear relation of the form to the NOT and Yost et al. (2000) data points. The per degree of freedom is 0.56 and the derived value of the power-law decay slope is = 1.0350.097.
3.2.2 B and V band photometry
We performed the B and V–band photometry in the same way as for the R–band. The results are shown in Table LABEL:obslog. The OT was only detected in the V–band, hence for the B filter we can only derive a 2 upper limit. The VR colour of the OT is 0.770.27, redder than most OTs observed so far and similar to the red afterglow of GRB 000418 (Klose et al. 2000). The foreground extinction towards the field of GRB 000630 is E(BV)=0.0130.02 (Schlegel et al. 1998), which is negligible.
3.3 Limit on the magnitude of the host galaxy
There are no indications of a host galaxy right underneath the point source emission from the OT. The closest galaxy is located 2.0 arcsec north of the OT. In order to put a stringent limit on the magnitude of any galaxy coincident with the OT we combined all the images obtained on July 10.9 and July 25.9 (a total of 2.8 hours of imaging) using the code described in Møller and Warren (1993). The final combined image reaches a 5 limiting magnitude of 25.2 in a 1.0 arcsec radius circular aperture. The FWHM of point sources in the combined image is 0.93 arcsec.
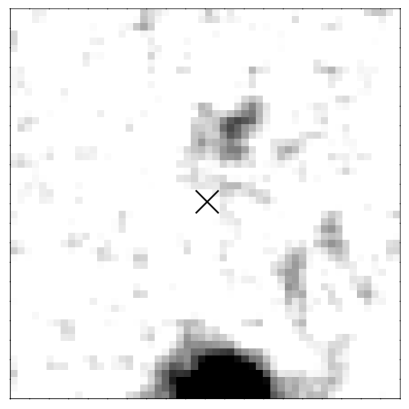
Fig. 2 shows a 1010 arcsec2 region centered on the position of the OT. No emission is detected at that position. The magnitude of the nearest galaxy, 2.0 arcsec north of the OT, is 24.680.15 measured in a 1.0 arcsec radius circular aperture. The galaxy has an extension in the direction of the OT, but we cannot with any certainty establish whether this galaxy is the host galaxy of GRB 000630. The galaxy is also detected in the B and V band images of TNG. The colours of the galaxy are BV=0.10.3 and VR=0.20.2, which is blue compared e.g. to the galaxies in the NTT deep field (Arnouts et al. 1999, their Fig. 2).
3.4 Constraint on the presence of an underlying SN
The OT was not detected in the deep R–band image obtained 25.9 days after the event, which constrains the possible contribution to the light–curve from a supernova similar to SN1998bw. Even if the decay slope has steepened to = 2.5 four days after the high energy event we can exclude (by 2 and 0.5 magnitudes for redshifts of z=0.5 and 1.3 respectively) a contribution from a supernova like SN1998bw if the redshift of the GRB is below 1.3. Any extinction in the host galaxy of the OT emission will of course loosen this constraint.
3.5 Implications for dark bursts
The OTs of GRB 980329, GRB 980613 and GRB 000630 are the faintest optical transients detected within 24 hours from the high energy events. The OT of GRB 980329 was detected with the New Technology Telescope at R=23.60.2 0.83 days after the GRB (Palazzi et al. 1998) at the position of a previously found radio afterglow (Taylor et al. 1998). The OT of GRB 980613 was detected with the NOT 0.69 days after the GRB with a magnitude of R=22.90.2 (Hjorth et al. 1998, 1999; Hjorth et al. in prep.). GRB 000630 is interesting because for this faint burst the afterglow properties (decay and spectral slope) are fairly well constrained. The faintness of the OT of GRB 000630 cannot be explained by a steep decay slope as in the case of GRB 980326 (Groot et al. 1998b). Hence, the OT must be faint either due to reddening in the host galaxy as in the case of GRB 000418 (Klose et al. 2000), a very high redshift as in the case of GRB 000131 (Andersen et al. 2000) or a low-density circumburst environment (Mészáros and Rees 1997; Taylor et al. 2000). The VR colour of the OT implies a spectral slope of 0.97 (Fν ), which, though uncertain, may indicate either significant reddening in the host galaxy or a high redshift. Spectral slopes of GRBs are typically between 0.6 and 1.0.
| Burst | R-limit | Reference | |
|---|---|---|---|
| (mag) | (days) | ||
| GRB~970111 | 23.0 | 0.79 | (1) |
| GRB~970402 | 23.0 | 1.05 | (2) |
| GRB~970616 | 20.0 | 2.64 | IAUC 6687 |
| GRB~970815 | 23.0 | 0.70 | IAUC 6721 |
| GRB~970828 | 23.8 | 0.14 | (3) |
| GRB~971227 | 20.5 | 0.56 | IAUC 6800 |
| GRB~981220 | 19.5 | 2.13 | GCN 159, 165 |
| GRB~981226 | 23.0 | 0.4 | GCN 190 |
| GRB~990217 | 22.5 | 0.28 | GCN 258, 262 |
| 23.5 | 0.83 | GCN 262 | |
| GRB~990316 | 19.5 | 0.33 | GCN 276, 277 |
| 24.3 | 1.78 | GCN 280 | |
| GRB~990506 | 23.5 | 0.49 | GCN 291, 352 |
| GRB~990527 | 22.0 | 1.8 | GCN 347, 349 |
| GRB~990627 | 21.0 | 0.94 | GCN 356, 358 |
| GRB~990704 | 18.0 | 0.14 | GCN 360, 362 |
| 22.5 | 0.19 | GCN 371 | |
| GRB~990806 | 23.5 | 0.52 | GCN 392, 396 |
| GRB~990907 | 23.0 | 1.64 | GCN 405, 413 |
| GRB~990908 | 20.0 | 0.47 | GCN 406, 408 |
| GRB~990915 | 20.5 | 1.25 | GCN 410, 416 |
| GRB~991014 | 23.1 | 0.47 | GCN 417, 423 |
| GRB~991105 | 23.5 | 0.65 | GCN 433, 449 |
| GRB~991106 | 22.0 | 0.42 | GCN 435, 440 |
| GRB~000115 | 22.0 | 1.52 | GCN 519, 524 |
| GRB~000126 | 19.0 | 2.5 | GCN 525, 527 |
| GRB~000301A | 21.5 | 1.11 | (4) |
| GRB~000307 | 22.0 | 2.11 | GCN 601, 617 |
| GRB~000315 | 19.0 | 1.29 | (4) |
| GRB~000323 | 21.5 | 2.04 | GCN 616, 621 |
| GRB~000326 | 21.5 | 3.19 | GCN 618, 625 |
| GRB~000408 | 21.5 | 1.0 | GCN 626, 633 |
| GRB~000424 | 20.7 | 1.36 | GCN 644, 648 |
| 22.8 | 2.44 | GCN 660 | |
| GRB~000429 | 19.0 | 0.73 | GCN 657, 659 |
| GRB~000508B | 22.5 | 1.4 | GCN 665, 670 |
| GRB~000519 | 21.0 | 0.82 | GCN 672, 679 |
| GRB~000528 | 22.3 | 0.53 | GCN 675, 674 |
| 23.3 | 0.73 | GCN 691 | |
| GRB~000529 | 19.8 | 1.10 | GCN 676, 682 |
| GRB~000604 | 22.0 | 2.24 | GCN 687, 692 |
| 23.0 | 1.90 | (4) | |
| GRB~000608 | 20.5 | 0.59 | (4) |
| GRB~000615 | 21.5 | 0.18 | GCN 703, 709 |
| GRB~000616 | 18.0 | 1.6 | GCN 711, 714 |
| GRB~000620 | 19.8 | 0.24 | GCN 722, 734 |
| 21.7 | 0.67 | GCN 734 | |
| GRB~000623 | 20.0 | 1.21 | GCN 730, 735 |

It is still not understood why OTs have only been detected for about 30% of well localized GRBs. Possible explanations are i) there is a optically bright vs. optically dark dichotomy for GRBs similar to the radio quiet vs. radio loud dichotomy for QSOs (i.e. a bimodal OT luminosity function), ii) a large fraction of GRBs occur at redshifts 7 and are hence invisible in the optical due to Ly- blanketing and absorption by intervening Lyman-limit systems, iii) a large fraction of GRBs occur in highly obscured galaxies similar to the SCUBA-selected galaxies (e.g. Ivison et al. 2000) so that the optical emission never escapes the host galaxies, or iv) the shape of the OT luminosity function is such that with the search strategies applied in the period 1997–2000 we would not expect to detect OTs for more than 30% of the well localized GRBs.
In order to shed some light on this problem we have compiled in Table LABEL:darkdata, mainly using the GCN Circular archive111http://gcn.gsfc.nasa.gov/gcn/gcn3_archive.html, the most stringent R–band upper limits to magnitudes and their observation epochs relative to the GRB epoch () for 43 GRBs with no detected OT. The left panel in Fig. 3 shows the upper limits plotted against for the 43 GRBs. Also plotted is the light–curve of the OT of GRB 000630 (full-drawn line) and its extrapolation to earlier times than the first observing epoch (dashed line). As seen, except for GRB 990316, all upper limits are above the observed ( 1 day after GRB event) light–curve of GRB 000630. However, the strong upper limit on the magnitude of GRB 990316 is only valid for a 22 arcmin2 region around a candidate LOTIS transient that may be unrelated to the GRB. The upper limits for GRB 970815, GRB 970828, GRB 981226, GRB 990217, GRB 990506, GRB 990704, GRB 990806, GRB 991014, GRB 991105, and GRB 000615 are below the extrapolation of the light–curve to earlier times. Two of these, GRB 991014 and GRB 991105, occurred in fields with relatively high foreground extinction (with E(BV) values 0.268 and 0.598 respectively). Note here, that not all OT light–curves peak at t1 day (Guarnieri et al. 1997, but see also Galama et al. 2000; Pedersen et al. 1998). In the right panel of Fig. 3 we show the histogram of R–band magnitudes at t=1 day (in 0.5 mag bins) of the 13 OTs (prior to and including GRB 000630) that were detected earlier than 24 hr after the burst. It is much more difficult to detect an OT at R=23 than at R=19.5, and an OT having R=24 at t=1 day would almost certainly not be detected with current search strategies. Therefore the observed distribution is not the real distribution of apparent OT magnitudes. The real distribution must have a larger fraction of bursts in the fainter bins. From the two plots in Fig. 3 we conclude that the majority ( 75%) of GRBs without detected OTs are consistent with no detection if they were similar to dim bursts like GRB 980329, GRB 980613, and GRB 000630 at optical wavelengths.

In Fig. 4a–c we compare the properties of BATSE-detected GRBs with and without detected OTs. In Fig. 4a we show the spectral hardness vs. duration plot for 1959 BATSE bursts (shown as contours following Jensen et al. (2001)). Superimposed as filled circles and crosses are the positions of GRBs with and without detected OTs. As seen, the two groups populate the same region in the long-duration part of the diagram. In Fig. 4b we show the channel 3 fluence histogram in 0.1 dex bins for all BATSE bursts. The GRBs with and without detected OTs again show similar distributions. Finally, in Fig. 4c the R–band magnitude of the OT at = 1 day in 0.5 mag bins for GRBs with detected OTs or the upper limit for GRBs without detected OTs are plotted against the logarithm of the channel 3 fluence. We have shifted the upper limits to = 1 day assuming a decay slope of . Intuitively one might expect a correlation between the energy released at gamma-ray wavelengths and in the optical at some level, although different redshifts and different amounts of dust obscuration will increase the scatter. However, Fig. 4c does not indicate any correlation. Moreover, the upper limits for the majority of GRBs with no detected OTs do not place them in regions of the diagram that are not already populated by GRBs with detected OTs. This means that based on the gamma-ray properties of the current sample we cannot conclude that GRBs with no detected OTs belong to another class of GRBs than GRBs with detected OTs.
4 Summary
The OT of GRB 000630 was detected with the NOT 21.1 hours after the high energy event with an R–band magnitude of 23.040.08. The OT subsequently followed a power-law decay characterized by a slope of = 1.0350.097. From the deep R–band image obtained 25.9 days after the event we find that there is no evidence for an underlying SN. Furthermore, there is no indication of a host galaxy down to a 5 limit of R=25.2 right underneath the point source emission from the OT. The closest galaxy is a blue galaxy located 2.0 arcsec north of the OT.
For the problem of dark bursts we find that the majority ( 75%) of GRBs for which searches for optical afterglow have been unsuccessful are consistent with no detection if they were similar to bursts like GRB 000630 at optical wavelengths. We at present cannot exclude nor confirm any of the explanations i – iv listed above (see Sect 3.5) for why some bursts are darker than others. In order to establish the reasons why most GRBs searches for OTs up till now have been unsuccessful, and thereby obtain a more complete understanding of optical afterglows to GRBs and the relation between optical and high energy properties of GRBs, it is therefore essential to conduct deep (R 24 at 1.0 day) follow-up imaging at optical wavelengths and also deep infra-red follow-up of a sample of well localized and homogeneously selected GRBs. This is feasible with the next generation of GRB satellites and 8–m class telescopes.
Acknowledgments
We thank our anonymous referee for comments that helped us improve the discussion of dark bursts significantly. Some of the data presented here have been taken using ALFOSC, which is owned by the Instituto de Astrofisica de Andalucia (IAA) and operated at the Nordic Optical Telescope under agreement between IAA and the NBIfAFG of the Astronomical Observatory of Copenhagen. Support for this programme by the director of the Nordic Optical Telescope, professor Piirola, is much appreciated. We acknowledge M. Feroci for his assistance with IPN operations and F. Frontera for his assistance with BeppoSAX operations. KH is grateful for Ulysses support under JPL Contract 958056, for NEAR support under NASA grant NAG5-9503, and for BeppoSAX support under NASA grant NAG5-9126. We thank F. Hoyo for help in the observations at Calar Alto. JG acknowledges the receipt of a Marie Curie Research Grant from the European Commission. This work was supported by the Danish Natural Science Research Council (SNF).
References
- (1) Andersen M.I., Hjorth J., Pedersen H., et al., 2000, A&A 364, L54
- (2) Arnouts S., D’Odorico S., Cristiani S., et al., 1999, A&A 343, 19.
- (3) Björnson G., Hjorth J., Jakobsson P., Christensen L., Holland S., ApJL submitted
- (4) Bloom J.S., Kulkarni S.R., Djorgovski S.G., et al., 1999, Nature 401, 453
- (5) Castro-Tirado, A. J., & Gorosabel, J., 1999, A&AS, 138, 449
- (6) Costa E., Frontera F., Heise J., et al., 1997, Nature 387, 783
- (7) Frail D.A., Kulkarni S.R., Bloom J.S., et al., 1999, ApJ 525, L81
- (8) Galama T.S., Vreeswijk P.M., Paradijs J. van, et al. 1998, Nature 395, 670
- (9) Galama T.S., Tanvir N., Vreeswijk P.M., et al. 2000, ApJ 536, 185
- (10) Gorosabel J., 1999, Ph D. Thesis, Univ. of Valencia.
- (11) Gorosabel J., Castro-Tirado A.J., Wolf C., et al., 1998, A&A 339, 719
- (12) Gorosabel J., 2000, Priv. Comm.
- (13) Greiner J., Henden A., Merlino S, et al., 2000, GCN 743
- (14) Groot P.J., Galama T.J., van Paradijs J., et al., 1998a, ApJ 493, L27
- (15) Groot P.J., Galama T.J., Vreeswijk P.M., et al., 1998b, ApJ 502, L123
- (16) Guarnieri A., Bartolini C., Masetti N., et al., 1997, A&A 328, L13
- (17) Henden A., 2000, GCN 742
- (18) Hjorth J., Andersen M.I., Pedersen H., et al., 1998, GCN 109
- (19) Hjorth J., Pedersen H., Jaunsen A.O., Andersen M.I., 1999, A&AS 138, 461
- (20) Hjorth J., Holland S., Courbin F., 2000, ApJL 534, 147
- (21) Hurley K., 1992, AIP Conf. Proc. 265, “Gamma-Ray Bursts”, Eds. W. Paciesas and G. Fishman, AIP (New York)
- (22) Hurley K., Cline T., Mazets E., et al., 2000, GCN 736
- (23) Ivison R.J., Smail I., Barger A.J., et al., 2000, MNRAS 315, 209
- (24) Jensen B.L., Hjorth J., Pedersen H., et al., 1999, GCN 190
- (25) Jensen B.L., Pedersen H., Hjorth J., et al., 2000a, GCN 739
- (26) Jensen B.L., Fynbo J.P.U., Pedersen H., al., 2000b, GCN 747
- (27) Jensen B.L., Fynbo J.P.U., Gorosabel J., al., 2001, submitted to A&A
- (28) Klose S., Stecklum B., Masetti N., et al., 2000, ApJ in press
- (29) Kouveliotou C., Meegan C.A., Fishman G.J., et al., 1993, ApJ 413, L101
- (30) Kulkarni S.R., Berger E., Bloom J.S., et al., 2000a, To appear in Proc. of the 5th Huntsville GRB Symposium (astro-ph/0002168)
- (31) Mészáros P., Rees M.J., 1997, ApJ 476, 232
- (32) Metzger M.R., Djorgovski S.G., Kulkarni S.R., et al., 1997, Nature 387, 878
- (33) Møller P., Warren S.J., 1993, A&A 270, 43
- (34) Palazzi R., Pian E., Masetti N., 1998, A&AL 336, 95
- (35) van Paradijs J., Groot P.J., Galama T., et al., 1997, Nature 386, 686
- (36) Pedersen H., Jaunsen A.O., Grav T., et al., 1998, ApJ 496, 311
- (37) Pedersen H., Hjorth J., Jensen B.L., Jaunsen A.O., Holland S., 1999, GCN 352
- (38) Reichart D.,E., 1999, ApJ 521, L111
- (39) Schlegel D.J., Finkbeiner D.P., Davis M., 1998, ApJ 500, 525
- (40) Stetson P., 1987, PASP 99, 191S
- (41) Stetson P., 1997, “User’s Manual for DAOPHOT II”
- (42) Taylor G.B., Frail D.A., Kulkarni S.R., et al., 1998, ApJL 502, 115
- (43) Taylor G.B., Bloom J.S., Frail D.A., et al., 2000, ApJ 537, L17
- (44) Yost S., Harrison F., Diercks A., 2000, GCN 748