The X-ray view of the quasar MR 2251178 and its host cluster:
variability, absorption, and intracluster gas emission
Abstract
MR 2251-178 was the first quasar initially discovered in X-rays, and the first one found to host a warm absorber. The quasar turned out to be an outstanding object in many respects. It has a high ratio of X-ray/optical luminosity, is surrounded by the largest quasar emission-line nebula known, and is located in the outskirts of a cluster of galaxies. Here, we present results from an analysis of the X-ray spectral, temporal, and spatial properties of this source and its environment based on deep ROSAT observations.
Remarkably, we do not detect any excess X-ray cold absorption expected to originate from the giant gas nebula surrounding MR2251-178. This excludes the presence of a huge HI envelope around the quasar. The X-ray spectrum of MR2251-178 is best fit by a warm-absorbed powerlaw with an ionization parameter and a column density which, however, cannot be the same material as the giant optical emission line nebula. The mean (0.1–2.4)keV X-ray luminosity amounts to erg/s.
A spatial analysis shows that the bulk of the X-ray emission from the quasar is consistent with a point source, as expected in view of the powerlaw-shaped X-ray spectrum and the rapid X-ray variability we detect. In addition, extended emission appears at weak emission levels, including a bridge between the quasar and the cD galaxy of the cluster.
The X-ray emission from the intra-cluster medium is weak or absent. We derive an upper limit on the X-ray luminosity of erg/s, weaker than other clusters of comparable richness. None of the other member galaxies of the cluster to which MR 2251-178 belongs, are detected in X-rays. However, east of the quasar there is a significant excess of X-ray sources, several of them without optical counterparts on the UK Schmidt plates.
Key Words.:
Galaxies: active – individual: MR 2251-178 – quasars – clusters – X-rays: galaxies1 Introduction
The quasar MR 2251-178, at a redshift of =0.064, is located in the outskirts of an irregular cluster of galaxies (Phillips et al. 1980). It was the first quasar initially identified from X-ray observations (Cooke et al. 1978, Ricker et al. 1978). MR 2251-178 shows remarkable multi-wavelength properties.
In the optical spectral region, much attention has focussed on the very extended [OIII] emission line region of MR 2251-178 found by Bergeron et al. (1983), and the source of its ionization and its origin (e.g., di Serego Alighieri et al. 1984, Hansen et al. 1984, Macchetto et al. 1990). The quasar is a weak radio emitter of Fanaroff-Riley type I (Kembhavi et al. 1986, Macchetto et al. 1990).
MR 2251-178 was detected as a bright X-ray source in the course of the Ariel V all-sky survey (Cooke et al. 1978) and identified with the quasar by Ricker et al. (1978) from observations with the SAS-3 X-ray observatory. The X-ray spectrum of MR 2251-178 was first studied by Halpern (1984) who deduced the presence of a warm absorber based on the observed variability pattern of the Einstein data. Based on EXOSAT and Ginga observations Pan et al. (1990) and Mineo & Stewart (1993), again, interpreted and modeled the data in terms of the presence of a warm absorber. In particular, Mineo & Stewart found the ionization state of the absorber to follow changes in the intrinsic continuum luminosity. An independent analysis of the EXOSAT data was performed by Walter & Courvoisier (1992), who concluded that the previously reported variability could be completely traced back to variability in the powerlaw index (and constant cold absorption) rendering the presence of a warm absorber unnecessary. Reynolds (1997; see also Reeves et al. 1997), in the course of a large sample study of ASCA observations of AGN, reported the detection of OVII and OVIII absorption edges in the X-ray spectrum of MR 2251-178.
Warm absorbers are an important diagnostic of the physical conditions within the central regions of active galaxies. They have been observed in 50% of the well-studied Seyfert galaxies (see Komossa 1999 for a review). Their presence was recently confirmed with Chandra observations of NGC 5548 which reveal a rich absorption line spectrum (Kaastra et al. 2000). The study of the ionized material provides a wealth of information about the nature of the warm absorber itself, its relation to other components of the active nucleus, and the intrinsic AGN X-ray spectral shape, and leads to a better understanding of AGN in general. Thorough modeling of the few quasars that show warm absorbers, like MR 2251-178, is also important for investigating the relation between warm absorbers in Seyferts and quasars and the cause for their different abundances.
Here, we present results from an analysis of a deep archival ROSAT PSPC (Trümper 1983) observation of MR 2251-178. In addition, ROSAT all-sky survey observations of this source are analyzed in order to study the long-term variability. Besides an investigation of the properties of MR 2251-178 itself, the following issues are of importance: the potential contribution of nearby sources to the X-ray spectrum of MR 2251-178, the search for X-ray emission from other member galaxies of the cluster to which MR 2251-178 belongs, and the search for emission from the intra-cluster medium. The high spatial resolution of the ROSAT observation allows for the first time to separate these components.
The results presented here were obtained in the course of a systematic study of bright ROSAT AGNs that show X-ray spectral complexity, including NGC 4051 (Komossa & Fink 1997a), NGC 3227 (Komossa & Fink 1997b), IRAS 17020+4544 (Komossa & Bade 1998), IRAS 13349+2438 (Komossa & Breitschwerdt 2000, Siebert et al. 1999), and the spectrally highly variable Narrow-line Seyfert 1 galaxy RXJ 0134-4258 (Komossa & Meerschweinchen 2000).
The paper is organized as follows: In Sect. 2 we present the observations. The analysis of the data with respect to their spatial, temporal, and spectral properties is given in Sects. 3, 4, and 5, respectively. Sect. 6 presents the discussion, and a summary and the conclusions are provided in Section 7. A distance of 410 Mpc was adopted for MR 2251-178. If not stated otherwise, cgs units are used throughout the paper.
2 Data reduction
2.1 Pointed observation
The on-axis observation of MR 2251-178 was performed with the ROSAT PSPC on Nov. 15–16, 1993. The exposure time was 18.3 ksec. In total, 36 X-ray sources were detected with a likelihood 15 within the PSPC field of view. The target-source photons were extracted within a circle centered around the X-ray position of MR 2251-178. The background was determined from the inner 19′ of the field of view, after the removal of all detected sources. Vignetting and dead-time corrections were applied to the data using the EXSAS software package (Zimmermann et al. 1994). The mean source count rate is 3.10 cts/s. For the spectral analysis source photons in the amplitude channels 11-240 were binned according to a signal/noise ratio of 35.
2.2 ROSAT all-sky survey data
The sky field around MR 2251-178 was observed during the ROSAT all-sky survey (RASS) in November 1990. We determined the background from a source-free region along the scanning direction of the telescope and corrected the data for vignetting. Emission from MR 2251-178 is clearly detected. We derive a count rate of 1.0 cts/s, about a factor of 3 weaker than during the pointed observation.
Results presented below refer to the pointed observation if not noted otherwise. The RASS data are mainly used to determine the long-term variability.
3 Spatial analysis
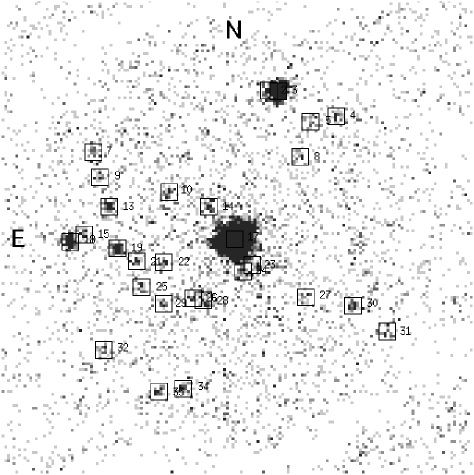
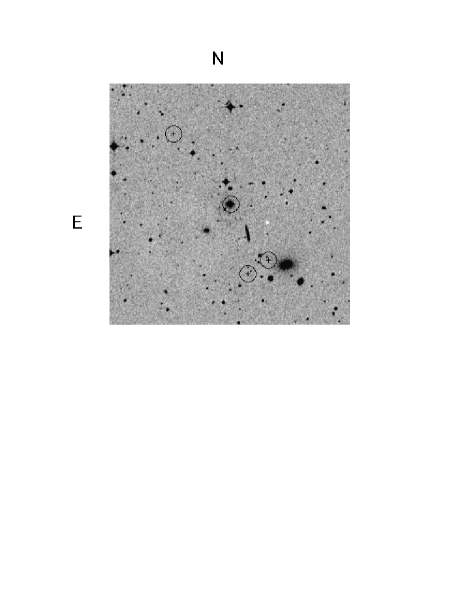
36 X-ray sources were detected with a likelihood 15 within the PSPC field of view (Fig. 1). The positions of those in the vicinity of MR 2251-178 are shown in Fig. 3, overlaid on an optical image from the UK Schmidt plates. The nearby sources are weak (see Tab. 1 for count rates); none is expected to have significantly confused previous X-ray observations of MR 2251-178. Count rates of all sources detected in the inner PSPC field of view (shown in Fig. 1) are listed in Tab. 1. They are of interest for later variability studies if MR2251-178 is re-observed by Chandra or XMM.
| source | X3 | X4 | X5 | X7 | X8 | X9 | X10 | X13 | X14 | X15 | MR 2251 | X18 | X19 | X21 |
|---|---|---|---|---|---|---|---|---|---|---|---|---|---|---|
| count rate [10-3cts/s] | 57 | 3.5 | 3.4 | 2.9 | 1.9 | 2.7 | 3.9 | 7.1 | 3.7 | 3.0 | 3100 | 13.9 | 7.6 | 2.7 |
| source | X22 | X23 | X24 | X25 | X26 | X27 | X28 | X29 | X30 | X31 | X32 | X34 | X35 | |
| count rate [10-3cts/s] | 2.3 | 9.4 | 3.5 | 2.3 | 2.2 | 1.7 | 5.5 | 2.1 | 4.3 | 2.5 | 3.1 | 3.9 | 3.4 |
We note in passing that two of the three X-ray sources shown in Fig. 3 are aligned with MR 2251-178 and with the bright elliptical galaxy. While the present case could be just coincidence, we refer the reader to Arp (1997, and references therein) for a thorough analysis of alignments of X-ray sources around nearby galaxies.
None of the other member galaxies (e.g., Fig. 2 of Phillips 1980) of the cluster to which MR 2251-178 belongs, are detected in X-rays. However, there is an excess of X-ray sources east of the quasar (Fig. 1). Several of these sources do not have optical counterparts on the UK Schmidt plates. A correlation of the X-ray positions of all 36 detected sources with the SIMBAD database results in only one identification, MR 2251-178.
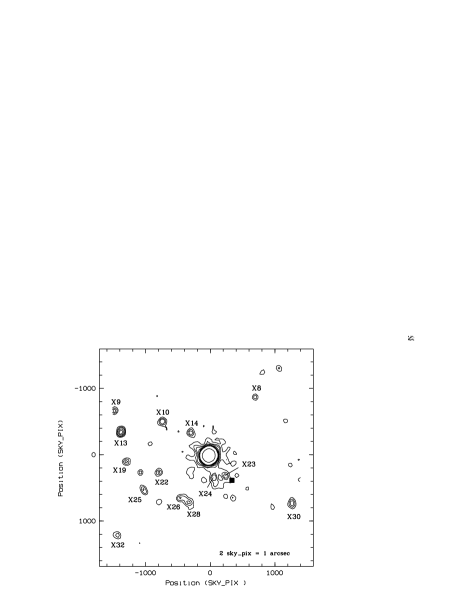
A spatial analysis of the X-ray emission from MR2251-178 shows that the bulk of the X-ray emission is consistent with emission from a point source. We find a systematic broadening of the radial source profile of order 1-3′′ in comparison with the core of the theoretical point spread function of the instrument. Such deviations have been observed previously in other sources, and can be traced back to instrumental effects (e.g., Morse 1994). Figure 2 provides a contour plot of the X-ray emission in the field around MR2251-178. At weak emission levels, extended emission appears. In particular, there is a bridge-like feature extending from the quasar in the direction of the cD galaxy of the cluster (the feature does not point in the direction of the wobble motion of the satellite).
Finally, we searched for extended X-ray emission from the intra-cluster medium. Phillips et al. (1980) locate the center of the cluster of galaxies close to the bright elliptical galaxy which can be seen in Fig. 3. We first removed all sources detected with a likelihood in the PSPC field of view. In the next step, eight source-free background regions symmetrically distributed around the target region, but in the outer parts of the field of view, were selected and the mean background count rate was determined. We then derived the background-corrected number of photons in a circular region of 150′′ radius, with its position close to the optical center of the cluster of galaxies. A number of 89 excess photons is detected. These could either originate from unresolved point sources, or represent emission from the intracluster gas. We conservatively assume that all excess photons originate from the intracluster medium (ICM) in order to derive an upper limit on its X-ray emission. To convert the countrate to X-ray luminosity, we used a Raymond-Smith emission model and assumed an ICM temperature of (i) = 5 keV (typical for clusters of galaxies) and (ii) 1.5 keV (more typical for groups of galaxies). This yields X-ray luminosities of erg/s and erg/s, respectively.
4 Temporal analysis
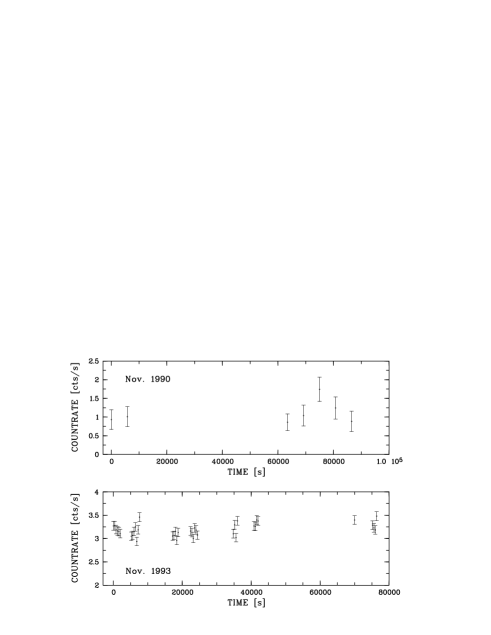
The mean source count rate during the pointed observation was 3.1 cts/s, a factor of 3 higher than during the ROSAT all-sky survey (RASS) observation performed 3 years earlier. The X-ray lightcurves are displayed in Fig. 4. We find evidence for a remarkable flaring event with a rise time of 10 000 sec and an amplitude of a factor 2 in count rate which ocurred during the RASS (Fig. 4, upper panel). It is interesting to mention here the luminous quasar PDS 456, where a similar flaring event (factor 2 rise in countrate within 17 ksec) was seen (Reeves et al. 2000).
In order to study variability during the pointed observation, in a first step a time binning of 400 s was adopted to account for the wobble motion of the satellite (Fig. 4, lower panel). In a second step, we chose time bins of 20s. On average, this still gives 60 source counts per bin. The wobble-induced source variability is expected to be less than 30%. We find repeated short-term variability by up to a factor 2 in count rate (not visible in the lower panel of Fig. 4 where time bins were 400s each), unexpected for such a luminous quasar.
5 Spectral analysis
5.1 MR 2251-178
5.1.1 Standard spectral models
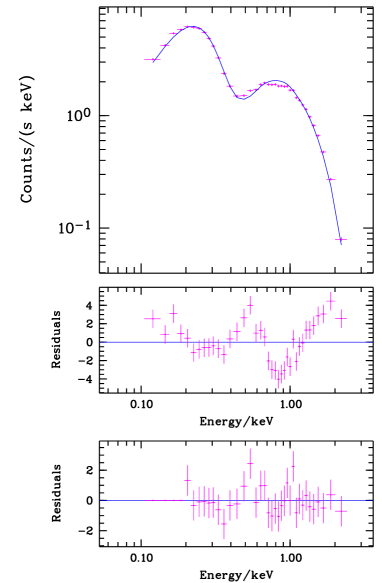
First, we fit a single powerlaw to the X-ray spectrum. The column density of cold absorbing material was fixed to the Galactic value towards MR 2251-178, cm-2 (Lockman & Savage 1995), since it is underpredicted otherwise (Fig. 5). This gives and clearly is a very poor description of the data (; Fig. 6).
A Raymond-Smith emission model does not fit the spectrum at all, even if temperature, metal abundances and the amount of cold absorption are all treated as free parameters. We then tried two-component spectral fits involving a powerlaw plus soft excess parametrized by different models. The quality of the fit remains unacceptable, though (Table 2).111In particular, we checked whether the combination of excess X-ray absorption and a very soft black body component – compensating each other to mimic an unabsorbed spectrum – is a possibility (see below for the motivation to search carefully for excess X-ray cold absorption). If both, the black body temperature and the absorption are treated as free parameters, we find 1021 cm-2; less than the Galactic value, but consistent within the errors. In a second step, we enforced excess absorption but were unable to obtain any successful spectral fit. Finally we note that we repeated the fits of all models listed in Table 2 with as free parameter; it is never found to exceed the Galactic value. This still holds if we ignore in the fitting procedure the first three spectral bins which always show a positive deviation from the best fit model. We have also experimented with a powerlaw plus two gaussian emission lines to account for the positive residuals around 0.55 and 1.8 keV of the single powerlaw fit (Fig. 6, middle panel). However, to match the rather similar widths of the residuals despite the different instrumental broadening at these two energies, two very different lines are required; the first one at 0.55 keV extremely narrow, the second one at 1.8 keV very broad with a width of 500 eV. We therefore do not discuss this model further.
| No. | model | wa parameters | ||||
| [1021 cm-2] | keV | |||||
| (1) | pl, RASS | 0.277(1) | - | –1.9 | - | 1.4 |
| (2) | pl | 0.277(1) | - | –2.32 | - | 5.4 |
| (3) | pl | 0.24 | - | –2.18 | - | 4.2 |
| (4) | RS(4) | 0.124 | - | - | 1.4 | 13.4 |
| (5) | pl + bb | 0.277(1) | - | –2.20 | 0.4 | 4.5 |
| (6a) | pl + 2 edges | 0.277(1) | =0.26, =0.20 | –2.23 | - | 1.6 |
| (6b) | pl + 2 edges(3) | 0.277(1) | =0.22, =0.24 | –2.21 | - | 0.9 |
| (7) | wa(3) | 0.277(1) | , | -1.9(2) | - | 1.0 |
(1) fixed to the Galactic value, (2) fixed, (3) first three bins excluded from fit, (4) abundances fixed to 0.01 solar; fit gets worse for higher abundances
5.1.2 Warm absorber models
The presence of a warm absorber markedly improves the fit. Performing a two-edges fit with edge energies fixed at the theoretical values of OVII and OVIII we obtain , , and . The not yet totally satisfactory quality of the fit, , can be traced back to a deviation of the low energy part of the spectrum (between 0.1–0.18 keV) which might be caused by residual calibration uncertainties, or a new spectral component of which we just see the tail. If this part of the spectrum is excluded from the spectral fitting, we obtain , , , and .
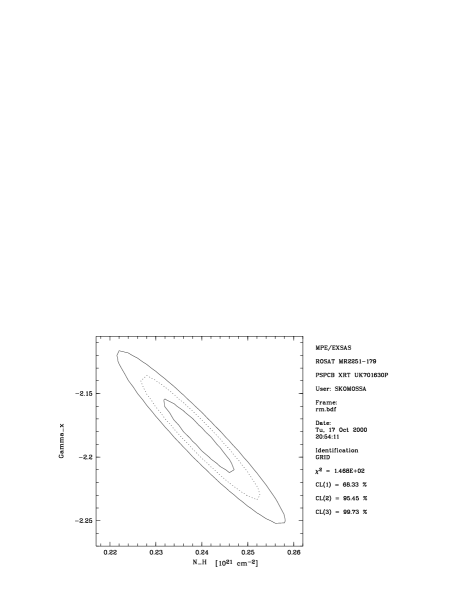
Next, a warm absorber model based on photoionization calculations (Komossa & Fink 1997a) with the code Cloudy (Ferland 1993) was applied. The ionized material was assumed to be photoionized by the continuum emission of the nucleus, to be one-component and of constant density. Solar abundances (Grevesse & Anders 1989) were adopted. Outside the soft X-ray band, the spectral energy distribution incident on the warm material was chosen to be a mean Seyfert continuum taken from Komossa & Schulz (1997)222The SED consists of an UV-EUV powerlaw of energy index =–1.4 extending up to 0.1 keV, a mean optical to radio continuum after Padovani & Rafanelli (1988), a break at 10m and an index = –2.5 -longwards. For comments on the usually weak influence of non - X-ray spectral parts on the warm absorption structure see Komossa & Fink (1997a). The soft X-ray continuum was directly determined from spectral fits ( = –1.9) and extrapolated to higher energies, with a break at 100 keV.. The two properties characterizing the warm absorber that can be directly extracted from X-ray spectral fitting are the hydrogen column density of the ionized material and the ionization parameter . The latter is defined as , where is the number rate of incident photons above the Lyman limit, is the distance between nucleus and warm absorber, is the hydrogen number density and the speed of light.
A fit of the X-ray spectrum of MR 2251-178 gives an ionization parameter of the warm absorber and a column density . We then split the total data set in three subsets according to flux-state of the source, and fit these data separately. The best-fit parameters remain the same within the error bars; no changes in the warm absorber are detected. This also holds for the RASS observation performed 3 yrs earlier; the best-fit column density is a factor 3 lower, but consistent with being constant within the errors.
The best-fit warm absorber model still leaves some residuals at the low energy-part of the spectrum, suggesting the presence of a second, lower ionized absorber which could possibly be dusty (see Komossa 1999 for a review on dusty warm absorbers). These properties make MR 2251-178 an excellent candidate for observations with the LETG spectrometer aboard Chandra.
Integration over the best-fit X-ray spectrum (we used model 6a of Table 2) after correction for cold and warm absorption gives a mean rest-frame luminosity of erg/s. MR 2251-178 is thus one of the most luminous soft X-ray emitters in the local (0.1) universe.
5.2 X18
In order to get first clues on the identity of the other X-ray sources, we have analyzed the source X18 which is the brightest of the eastern-excess sources. was fixed to the same value used for MR2251-178. We repeated all fits for and zero redshift.
A powerlaw spectral fit to X18 gives (), a Raymond-Smith fit yields , a single black body model is similarly unsuccessful (). If X18 is located at the distance of MR2251-178 its luminosity is erg/s, based on the powerlaw fit.
6 Discussion
6.1 Warm and cold absorption, and relation to the giant gas nebula surrounding MR2251-178
MR2251-178 is one of the few quasars that host warm absorbers. Our simple one-component warm absorber fit gives a high column density of the ionized material, similar to that seen in NGC 4051 (e.g., Komossa & Fink 1997a). We have checked that none of the observed optical-UV emission lines of MR2251-178 are overpredicted by our best-fit warm absorber model. For instance, we derive a warm-absorber intrinsic intensity ratio in the emission lines [FeXIV]5303/H of 0.02.
It is interesting to note that the optical emission-line gas which surrounds MR2251-178 is of huge hydrogen column density. Essentially, two components have been distinguished: a circumnuclear component with an extent of 20 kpc, and a giant envelope which extends up to 200 kpc. Bergeron et al. (1983) provided crude estimates of the mean ionized gas densities of cm-3 and cm-3 for the circumnuclear component and the envelope, respectively, with uncertainties larger than a factor 10. This translates into column densities of 9 1021 cm-2 and 3 1021 cm-2. If this gas were neutral, the quasar would be heavily absorbed at soft X-ray energies. We note in passing that this material is not expected to act as X-ray warm absorber, since its degree of ionization is too low. In our best-fit warm absorber model, the oxygen ion species of lowest ionization with significant abundance is O5+.
Several scenarios have been proposed to explain the origin of the ionized gas envelope around MR2251-178, including a merger remnant as result of a merger event between MR2251-178 and a small, gas-rich spiral galaxy; tidally stripped gas from the neighbour galaxy; the ionized part of a large HI envelope, possibly left over from the formation epoch of the quasar; or material expelled from the QSO (e.g., Bergeron et al. 1983, Norgaard-Nielsen et al. 1986, Macchetto et al. 1990). Based on the extent, symmetry, and rotation pattern of the envelope, Shopbell et al. (1999) conclude that the interaction model is unlikely and that the envelope most probably did not originate within the host galaxy of the quasar. They favor a model in which the extended HII envelope resides within a large complex of HI gas centered about the quasar. Is has repeatedly been suggested to search for such an HI halo using the 21cm line (e.g., Bergeron et al. 1983, Macchetto et al. 1990, Shopbell et al. 1999).
Alternative to radio observations, soft X-rays are an excellent probe of excess absorption from cold material along the line of sight. Such absorption is expected, firstly, from the HII gas component itself (more likely from the envelope than the circumnuclear component) if more than 1% of H is neutral, and, secondly, from the HI envelope. We have carefully searched for such absorption, and do not find any evidence for it.333If we increase the amount of absorbing material by cm-2 and re-fit the X-ray spectrum, the fit is drastically worse, with a change = 187. We therefore consider cm-2 as an upper limit to the excess absorption along the line of sight. We conclude that the ionized gas nebula does not posses a significant neutral gas component, and that there cannot be an extended giant HI envelope along the line of sight.
It is tempting to speculate that the quasar’s X-ray emission is completely absorbed in the ROSAT band and we only see an extended X-ray emission component in the foreground, maybe from a giant X-ray halo. However, the X-ray variability of the quasar detected during the present and earlier observations (e.g., Pan et al. 1990) excludes this possibility.
6.2 High / and presence of a cooling flow ?
Given the high ratio of / of MR 2251-178 (Ricker et al. 1978), is it possible that a cooling flow contributes to its X-ray emission ? In this context, it is also interesting to note that recently, evidence has been reported for the presence of highly ionized Oxygen absorption in cluster cooling flows (e.g., Buote 2000).
We consider the contribution of a cooling flow very unlikely, though, because (i) MR 2251-178 is known to be highly variable, (ii) the quasar appears to be located far from the center of the cluster, in its outskirts, and (iii) Macchetto et al. (1990) and Shopbell et al. (1999) present evidence that the extended [OIII] envelope is not linked to a cooling flow.
6.3 X-ray filament between MR2251-178 and the cD galaxy
Whereas the bulk of the X-ray emission from MR2251-178 is consistent with a point-source origin, there is some extended emission at weak emission levels. The most interesting feature is a ‘bridge’ between the quasar and the cD galaxy of the cluster.
Presently, it is unclear, whether this emission region is indeed a filament of extended emission that connects the cD galaxy and MR2251-178, or whether it corresponds to several unresolved point sources, or whether the two sources X23 and X24 (Fig. 1, 2) are extended. If real, a giant outflow cone, or the remnant of a past interaction with the cD galaxy are possible explanations of the filament. Given the present uncertainties, we do not speculate further about its origin. The feature is potentially very interesting, though, and should be searched for with XMM and Chandra observations.
6.4 Eastern source excess
An excess of X-ray sources is detected east of MR2251-178. We find 19 sources in a region of 20′20′ above a flux level of 2 10-14 erg cm-2 s, whereas only 4.7 sources are expected according to the the distribution of Hasinger et al. (1994). This corresponds to a source overdensity of a factor 4. An X-ray source excess, albeit more symmetrically distributed, was previously noted in, e.g., the NGC 507 and NGC 383 group of galaxies (Kim & Fabbiano 1995; Komossa & Böhringer 1999, Arp 2001), and two distant galaxy clusters observed by Chandra (Elvis et al. 2000, Cappi et al. 2000). Kim & Fabbiano speculated that these sources represent cooling clumps in the halo of NGC 507. This explanation is unlikely here, because the sources are located far in the outskirts of the cluster, and the individual clumps would be exceptionally luminous (X18: erg/s). Optical follow-up observations are required for identification of the X-ray sources and would then give clues to their origin.
6.5 Weakness of intra-cluster gas emission
Phillips et al. (1980) found MR 2251-178 to be located in the outskirts of a cluster of galaxies. They counted 50 member galaxies and provided spectroscopy of the four brightest. The cluster center is located close to the brightest elliptical (see Fig. 3) which is occasionally referred to as cD galaxy.
In X-rays, there is a striking absence of bright intracluster gas emission in contrast to what is usually seen in nearby clusters like this one (e.g., Böhringer et al. 2000). We detect only few excess photons in the direction of the optical cluster center. If all these photons are attributed to ICM emission (instead of currently unresolved point sources), we derive an X-ray luminosity of erg/s.
The weakness of the ICM X-ray emission suggests, that what appears as one single cluster may just be a chance projection of several smaller clusters or groups. In fact, Bergeron et al. (1983) find evidence for a second cluster at redshift , based on spectroscopy of one galaxy in the field of the MR2251-178 cluster.
The present X-ray results underscore the importance to use X-rays to distinguish between real clusters and chance projections (e.g., Böhringer et al. 2000), as long as redshifts for a large number of galaxies in the field are not available.
7 Summary and conclusions
We have presented an analysis of the soft X-ray properties of MR 2251-178 and its host cluster, using ROSAT PSPC observations. The derived mean (0.1–2.4) keV X-ray luminosity of 1045 erg/s places the quasar among the most X-ray-luminous AGN in the local universe. Remarkable for such a luminous source, we find evidence for an X-ray flaring event with a rise time of 10 ksec and an amplitude of a factor 2. The combination of earlier optical observations with the present X-ray data gives the following results:
An HI extension of the giant HII gas nebula around MR 2251-178 leads to the expectation of excess cold absorption in the soft X-ray band which is, however, not detected ( cm-2). On the other hand, an ionized absorber of high column density is present which, however, is too highly ionized to account for the optical extended [OIII] emission. The shape of the observed X-ray spectrum and the X-ray variability of the quasar ensure us that we indeed see X-ray emission from the quasar itself, and not from a giant extended X-ray halo that may be located outside the X-ray cold absorber. At weak emission levels, a filament extends between MR2251-178 and the cD galaxy of its host cluster.
East to the quasar there is a significant (factor 4) excess of X-ray sources above the expected number of background sources. The X-ray emission expected from the cluster to which MR2251-178 belongs is found to be weak or absent.
Deep high-resolution Chandra observations have the potential to solve the enigmas this exceptional source presents to us.
Acknowledgements.
We thank Gary Ferland for providing Cloudy, Wolfgang Brinkmann and Yasushi Ikebe for a critical reading of the manuscript, and the referee, James Reeves, for useful comments. The ROSAT project was supported by the German Bundesministerium für Bildung, Wissenschaft, Forschung und Technologie (BMBF/DLR) and the Max-Planck-Society. The optical image shown is based on photographic data obtained using the UK Schmidt Telescope. The UK Schmidt Telescope was operated by the Royal Observatory Edinburgh, with funding from the UK Science and Engineering Research Council, until 1988 June, and thereafter by the Anglo-Australian Observatory. Preprints of this and related papers can be retrieved athttp://www.xray.mpe.mpg.de/skomossa/
References
- (1) Arp H., 1997, A&A 319, 33
- (2) Arp H., 2001, ApJ, in press (astro-ph/0006422)
- (3) Bergeron J., Boksenberg A., Dennefeld M., Tarenghi M., 1983, MNRAS 202, 125
- (4) Böhringer H., Voges W., Huchra J.P., et al., 2000, ApJS 129, 435
- (5) Buote D.A., 2000, ApJ 544, 242
- (6) Cappi M., Mazzotta P., Elvis M., et al., ApJ, in press
- (7) Cooke B.A., Ricketts M.J., Maccacaro T., et al., 1978, MNRAS 182, 489
- (8) di Serego Alighieri S., Perryman M.A.C., Macchetto F., 1984, ApJ 285, 567
- (9) Elvis M., et al., 2000, in Proc: X-ray astronomy 2000, G. Giacconi et al. (eds), ASP Conf. Series, in press
- (10) Ferland G.J., 1993, University of Kentucky, Physics Department, Internal Report
- (11) Grevesse N., Anders E., 1989, in Proc: Cosmic Abundances of Matter, AIP 183, p. 1, C.J. Waddington (ed.), New York: American Institute of Physics
- (12) Halpern J., 1984, ApJ 281, 90
- (13) Hasinger G., Burg R., Giacconi R., et al., 1994, A&A 275, 1
- (14) Hansen L., Norgaard-Nielsen H.U., Jorgensen H.E., 1984, A&A 136, L11
- (15) Kaastra J., Mewe R., Liedahl D.A., Komossa S., Brinkman A.C., 2000, A&A 354, L83
- (16) Kembhavi A., Feigelson E.D., Singh K.P., 1986, MNRAS 220, 51
- (17) Kim D.-W., Fabbiano G., 1995, ApJ 441, 182
- (18) Komossa S., 1999, in Proc: ASCA/ROSAT Workshop on AGN and the X-ray Background, T. Takahashi, H. Inoue (eds), ISAS Report, p. 149; available at astro-ph/0001263
- (19) Komossa S., Bade N., 1998, A&A 331, L49
- (20) Komossa S., Böhringer H., 1999, A&A 344, 755
- (21) Komossa S., Breitschwerdt D., 2000, in Proc: Astrophysical Dynamics, D. Berry et al. (eds), Ap&SS 272, 299
- (22) Komossa S., Fink H., 1997a, A&A 322, 719
- (23) Komossa S., Fink H., 1997b, A&A 327, 483
- (24) Komossa S., Meerschweinchen J., 2000, A&A 354, 411
- (25) Komossa S., Schulz H., 1997, A&A 323, 31
- (26) Lockman F.J., Savage B.D., 1995, ApJS 97, 1
- (27) Macchetto F., Colina L., Golombek D., Perryman M.A.C., di Serego Alighieri S., 1990, ApJ 356, 389
- (28) Mineo T., Stewart G.C., 1993, MNRAS 262, 817
- (29) Morse J., 1994, PASP 106, 675
- (30) Norgaard-Nielsen H.U., Hansen L., Jorgensen H.E., Christensen P.R., 1986, A&A 169, 49
- (31) Padovani P., Rafanelli P., 1988, A&A 205, 53
- (32) Pan H.C., Stewart G.C., Pounds K.A., 1990, MNRAS 242, 177
- (33) Phillips M.M., 1980, ApJ 236, L45
- (34) Reeves J.N., Turner M.J.L., Ohashi T., Kii T., 1997, MNRAS 292, 468
- (35) Reeves J.N., O’Brien P.T., Vaughan S., et al., 2000, MNRAS 312, L17
- (36) Reynolds C., 1997, MNRAS 268, 513
- (37) Ricker G.R., Clarke G.W., Doxsey R.E., et al., 1978, Nat. 271, 35
- (38) Shopbell P.L., Veilleux S., Bland-Hawthorn J., 1999, ApJ 524, L83
- (39) Siebert J., Komossa S., Brinkmann W., 1999, A&A 351, 893
- (40) Trümper J., 1983, Adv. Space Res. 2, 241
- (41) Walter R., Courvoisier T.J.-L., 1992, A&A 266, 57
- (42) Zimmermann H.U., Becker W., Belloni T., et al., 1994, MPE Report 257