A Search for Hi in E+A Galaxies
Abstract
We present the results of Hi line and radio continuum observations of five nearby E+A galaxies. These galaxies have spectra that are dominated by a young stellar component but lack the emission lines characteristic of significant, on-going star formation. They are selected from a unique sample of 21 E+A’s identified by Zabludoff et al. (1996) in their spectroscopic search for E+A galaxies using the Las Campanas Redshift Survey, where over 11,000 nearby galaxies were examined. The five E+A galaxies span a range of environments: three are in the field and two are in clusters. Only one system was detected in Hi emission, the field E+A galaxy EA1, with a total flux of 0.30 0.02 Jy km and an Hi mass of M⊙. The Hi morphology and kinematics of EA 1 suggest a galaxy-galaxy interaction, with a dynamical age of 6 yr inferred from the Hi tail lengths and velocities. This age estimate is consistent with the interpretation drawn from optical spectroscopy that starbursts in E+A galaxies began (and subsequently ended) within the last 109 yr. Our Hi detection limits are such that if the other E+A’s in our sample had the Hi properties of EA 1, we would have detected (or marginally detected) them. We conclude that E+A galaxies have a range of Hi properties. None of the galaxies were detected in radio continuum emission, with upper limits to the radio power of W Hz-1. Our limits exclude the possibility that these E+A’s are dust-enshrouded massive starburst galaxies, but are insufficient to exclude modest star formation rates of less than a few M⊙ yr-1.
1 INTRODUCTION
In their seminal photometric study of rich clusters of galaxies at redshifts 0.5, Butcher and Oemler found a significant excess of blue, starforming galaxies in distant clusters relative to nearby clusters (Butcher & Oemler, 1978, 1984) and provided one of the clearest pieces of evidence for galaxy evolution. Although the cause for the relatively recent decrease in the mean star formation rates of cluster galaxies over the past few billion years is still not well understood, spectroscopic studies of these galaxies reveal a further puzzle. Sixty percent of these blue, supposedly starforming galaxies have strong Balmer absorption lines with little or no evidence for ongoing star formation from optical emission lines (Couch & Sharples, 1987). Because their spectra are a superposition of a young stellar population characterized by A stars and an older population characterized by K stars, typical of elliptical galaxies, these galaxies were termed E+A galaxies111We use the term E+A for historical reasons. Because the first detections of these galaxies were in distant clusters (Dressler & Gunn, 1983), “E” was used to represent the assumed morphology and “A” the dominant stellar lines of the spectrum. A better, purely spectroscopic designation would be K+A (c.f. Franx, 1993)..
E+A galaxies are believed to be post-starburst galaxies, in which star formation has been almost entirely quenched. Why star formation has ceased is unknown, although most speculate that the gas reservoir has been depleted either through highly efficient consumption or by external forces that removed the gas, such as ram pressure stripping. The purpose of this study is to detect and measure the gaseous content and morphology of E+A galaxies in an attempt to help us understand why star formation has ceased so suddenly in galaxies that were vigorously forming stars only 1 Gyr ago.
The population of E+A galaxies shows a dramatic change as a function of redshift. Dressler and Gunn (1990) found in seven clusters at 0.35 0.45 that E+A galaxies constitute a significant fraction of the detected cluster members (23/172), while Belloni et al. (1995) found in the distant cluster Cl 0939+472 (z ) that 35 of the 169 member objects ( %) are E+A galaxies. These results have been strengthened by more recent surveys probing larger numbers of intermediate redshift clusters (e.g. Poggianti et al., 1999). On the other hand, at low redshift the fraction of E+A galaxies in clusters is close to zero. Fabricant et al. (1991) find that E+A galaxies form less than 1 of the population in nearby clusters.
So far, the E+A phenomenon has mostly been studied in cluster environments. The galaxy statistics of intermediate-redshift field surveys are much poorer than for clusters. The first environmentally unbiased search for E+A galaxies in the local universe was done by Zabludoff et al. (1996, hereafter Z96). From 11,113 galaxies at 0.05 0.13 in the Las Campanas Redshift Survey (LCRS; Shectman et al., 1996), Z96 identified 21 well-defined nearby E+A galaxies, which have the strongest Balmer absorption lines (the average of the equivalent widths of 5.5 Å ) and weakest [O ii] emission-line equivalent widths ( 2.5 Å ) of all the galaxies in the survey. The fraction of nearby E+A galaxies in the LCRS sample of Z96 is less than . However, the comparison to the higher redshift results is not straightforward because although the general spectral characteristics — strong Balmer absorption and no [O ii] emission — are similar for distant E+A’s and the Z96 sample, the latter sample had more stringent selection criteria. Interestingly 75 of the E+A’s in the Z96 sample lie in the field, well outside of clusters and rich groups of galaxies.
Although most scenarios explaining the E+A phenomenon have concentrated on star formation triggers specific to the cluster environment, the finding by Z96 that 75 of the local E+A sample are in the field indicates that either there are different triggers for cluster and field E+A’s or the trigger does not depend on global environment. Z96 argue that if only one mechanism is responsible for the E+A formation, then galaxy-galaxy interactions and mergers are that mechanism: optical images of at least five of the 21 galaxies in their sample show tidal features.
Finally, work by Smail et al. (1999) has cast some doubt on the post-starburst interpretation of E+A galaxies. From their radio continuum detections of E+A galaxies in a cluster at , they suggest that these galaxies are not post-starburst galaxies, but actually host highly obscured starbursts.
Hi imaging can address a number of questions pertaining to the E+A phenomenon. If E+A galaxies are post-starburst galaxies, what happened to their gas — did the burst consume it all? A comparison of the gas content and surface density distribution between E+A’s and normal star forming galaxies might provide clues as to why E+A’s are now quiescent. If galaxy interactions are indeed responsible for triggering the original bursts, the Hi morphology and kinematics might present a tidal signature even in systems with undisturbed optical morphologies (e.g., the M81/M82/NGC3077 system; Yun, 1992). Could there be significant star formation in E+A’s that is obscured by dust (c.f. Smail et al., 1999)? Radio continuum measurements, obtained as a byproduct of the Hi observations, can set useful limits on such a scenario. Could the local environment of E+A’s play a secondary role, as a source for gas for subsequent star formation? As another byproduct of the observations, we obtain an estimate of the Hi content of neighboring galaxies and can place a limit on the total local gas reservoir for star formation.
In this paper, we present the results of a search for neutral hydrogen gas from a spectroscopically well-defined sample of nearby E+A galaxies. Five E+A galaxies, EA 1, EA 2, EA 3, EA 4, and EA 11, are drawn from the 21 E+A galaxies defined in the survey of Z96. Four of these galaxies (EA 1-4) are selected because 1) they have been observed already with the Hubble Space Telescope Wide Field/Planetary Camera 2 (Zabludoff et al., in prep.) and 2) they are easily accessible with the VLA. The fifth galaxy, EA 11, is included in our sample because, like EA 4, it lies in a known cluster environment (Z96) and thereby provides a comparison with the three field E+A’s. The numerical suffix in the galaxy name ranks the strength of the 4000 Å break, , in the galaxy, which is a measure of the composition of the stellar population of a galaxy. Galaxies, such as EA 1, with smaller values are those most dominated by the A-stellar component and are thus bluer in color. The target galaxies lie at redshifts between 0.08 and 0.12. Our paper is organized as follows: Section 2 contains a summary of the observations and a brief description of the data reduction procedures. The Hi and the radio continuum properties of the galaxies are presented in Section 3. In Section 4, we discuss the implications of our results. We present our conclusions in Section 5. Throughout this paper we use km sec-1 Mpc-1 and .
2 OBSERVATIONS AND DATA REDUCTION
We observed the five E+A galaxies in our sample using NRAO’s Very Large Array (VLA) in January and March 1996 and June 1997. Table 1 lists the galaxy name, 1950 coordinates, heliocentric velocity (), B-band luminosity, luminosity distance, and the E+A environment. An E+A is identified as lying in a cluster if it is a member of a cluster in the LCRS group catalog (e.g., Tucker et al., 1998) or if there is a known cluster (from the NASA/IPAC Extragalactic Database (NED); Helou et al., 1991) at its position and redshift. Because the galaxies are at a relatively high redshift () for an Hi detection experiment we opted for a conservative instrumental set up, using the 3 km (C) array as a compromise between optimizing surface brightness sensitivity and resolution (15 arcsec). An extended north arm was used in the first and third session to obtain a rounder beam for the sources at low elevation. We chose to probe a large velocity range (1400 km s-1), but with a rather poor velocity resolution of typically 50 km s-1; this was achieved by using a 6.25 MHz total bandwidth with 31 spectral channels and online Hanning smoothing. The observational parameters are summarized in Table 2.
We calibrated the data using standard AIPS procedures. For each field we made a continuum image covering the full primary beam centered on the E+A galaxy. We subtracted the continuum from the spectral line data by making a linear fit to the visibilities over the line-free channels, which were not affected by the edge effects of the band. For a first pass we used channels 5 to 27 to make the fit; if Hi was detected, a new fit was made excluding the channels with line emission. The search for Hi was done in the UV data and in the image plane. In the UV plane, we first vector-averaged over all baselines and over time, which is equivalent to making a natural-weighted synthesized beam at the field center. We examined the resulting spectrum for Hi line emission. By varying the weighting of data, we also obtain different spatial resolutions and, for example, can directly search for extended emission at the field center. In the image plane, we examined cubes by eye before and after continuum subtraction. We also smoothed the cubes spatially and in velocity to search for emission that was either spatially extended or covered many channels. All the cubes were made by using natural weighting to optimize sensitivity. The rms noise in the full resolution cubes is typically 0.4 mJy beam-1, which is equivalent to a few 1019 cm-2 in column density sensitivity.
3 RESULTS
Of the five galaxies, only one was detected in emission — EA 1. No significant Hi emission was detected from any of the other galaxies, nor was radio continuum detected from any of the five galaxies. In the following sections, we present the Hi data for EA 1 along with the detection limits for the other systems without Hi detections. The general results are summarized in Table 3.
3.1 EA1
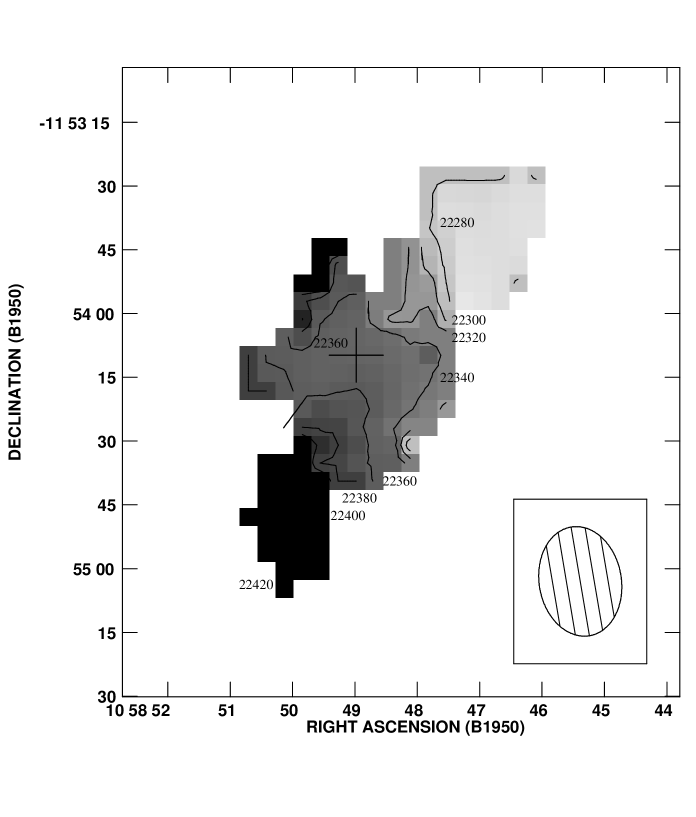
We detect a total Hi flux from EA 1 of 0.30 0.02 Jy km s-1. We calculate that the mean column density is 1.3 cm-2 and that the total Hi mass is 3.5 0.2 M⊙. In the channel maps, shown in Fig. 1, we see emission associated with the galaxy over approximately 150 km s-1, from 22284 to 22428 km s-1. There is a north-south velocity gradient in the system with the north side approaching. Near the central velocity the emission broadens, consistent with the emission from a moderately inclined, asymmetric disk. Considering the very disturbed optical morphology (discussed below) it is also possible that the Hi arises in two kinematically distinct components that overlap in the central regions. A profile of the central Hi emission, shown in Fig. 2, also shows a slight asymmetry. At the extreme velocities Hi appears northwest and southeast of the galaxy at projected distances of about 50 kpc. Although this emission is weak, it almost certainly is real — it joins smoothly into the main body of emission in velocity structure and, at very low levels, in spatial distribution as well. Morphologically and kinematically, the extended emission appears very similar to the gas-rich tidal tails observed in nearby mergers (e.g., Hibbard & van Gorkom, 1996).
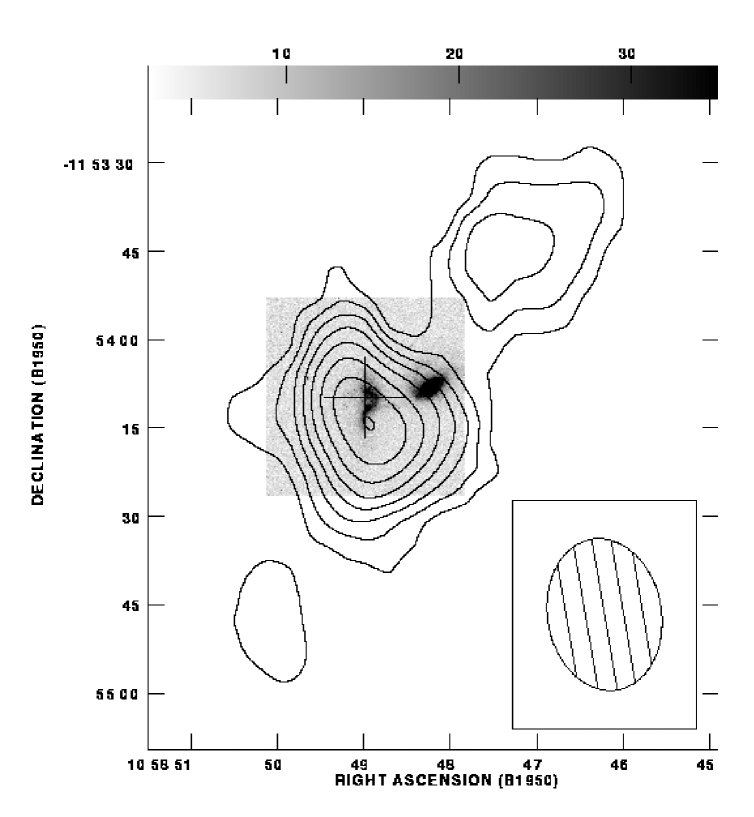
In Fig. 3, we show the Hi emission integrated over all velocities overlaid on an HST WFPC2 image (Zabludoff et al, in prep.). The overlay further supports the idea that the extended Hi is tidal debris, and the HST image shows that EA 1 looks very disturbed, much like an ongoing merger. The HST image also shows another somewhat disturbed galaxy at a small projected distance; unfortunately, we do not have a redshift for this galaxy. The only hint that it may be a true companion is that the Hi is extended in the direction toward the neighboring galaxy. In Fig. 4 we show a position-velocity profile along the kinematical major axis of the Hi, approximately the line connecting the tips of the tidal tails. The asymmetry in the central Hi distribution toward higher velocities is obvious. The extended Hi connects in velocity smoothly with the central gas, as would be expected from gas that has been tidally removed. Finally in Fig. 5 we show the intensity weighted velocity field of the Hi associated with EA 1.
EA1 had already been noted as having tidal features by Z96; however, it is the combination of the HST image and the VLA Hi results that show how truly strange this system is. The HST image suggests this is a very young, perhaps ongoing, merger. The two Hi tails suggests that two gas-rich disk galaxies are involved, yet the current star formation rate as derived from the [O ii] is remarkably low. From the HST image it is likely that the system is dusty, hence we may underestimate the amount of [O ii] emission due to extinction. However, a limit to the radio continuum emission, discussed in §4, confirms the very low upper limit on the current star formation rate. We can use the velocities of the Hi tails to give a rough estimate of the time elapsed since the interaction began (Schweizer, 1982). Taking , where is the projected radius from the center to the tip of the tail, is the relative LOS velocity of that tip, and is the angle between the radius vector and the line of sight. The formula assumes that the tail motions are mostly radial, and the factor 0.8 corrects for minor decelerations and the non-central tail origin. Taking , kpc, and km s-1, we get yrs. While it is unclear if the Hi tails are related to the event that caused the starburst, the derived time scale is consistent with the notion that an interaction in the last Gyr triggered the original starburst that gave rise to the E+A spectrum.
3.2 The Hi Detection Limits
The smallest Hi mass that can be detected anywhere in a datacube is a 5 signal per beam per channel. In Table 4 we list the corresponding Hi mass limits, using M M⊙, where is the luminosity distance in Mpc, is the integrated Hi emissivity in Jy km s-1, and is the redshift of the galaxy. These values are valid at the field center. At larger distances they have to be corrected for the primary beam response because, for example, at a distance of 15′ from the field center, these limits are a factor two larger. Our limits are for detections at random positions in the cubes.
A signal at the position and velocity of an E+A galaxy would be believable at the 3 level. Because our only detection, EA1, is the most nearby of the E+A galaxies, we have also calculated whether Hi emission with the spatial and spectral characteristics of the gas in EA1 would be detectable at the distances of the other E+A galaxies. In the last two columns of Table 4 we list the rms noise after smoothing to the velocity extent of EA 1 and the expected signal per beam at the location of the other galaxies. EA 1 would have been detectable at the 3 level even at the greater distances of the other E+A galaxies with the possible exception of EA 11, for which the signal would only be 2.5.
3.3 The Continuum Detection Limits
In Table 5 we list the rms noise in the continuum images and the 3 detections limits at 1.3 GHz at the location of the E+A galaxies. The power per synthesized beam is , where is the power of the source at 1.3 GHz in W Hz-1, is the flux in mJy, and is the luminosity distance in Mpc. None of the five E+A’s are detected in continuum emission.
4 DISCUSSION
4.1 Hi Properties
Of our five spectroscopically selected E+A galaxies, we have detected Hi in one system, with an Hi mass of 3.5 109 M⊙, while the other four non-detected systems have Hi upper limits of order 109 M⊙. What does this small sample tell us about E+A galaxies as a class? The first important lesson is that not all E+A galaxies are very gas deficient — it is possible to stop star formation without exhausting all the gas. Secondly, even within our rigorously defined set of E+A galaxies there is a large spread in Hi properties. Although our one detected galaxy, EA 1, is the bluest galaxy in the entire sample of Z96, it is not unique in any sense. EA 1’s only distinction is its extremely disturbed optical morphology — two components are visible — but two galaxies with Hi non-detections, EA 2 and EA 3, are just slightly redder and are also tidally disturbed. Z96 note that even with their strict selection criteria, the spectra of the 21 E+A galaxies span a range of spectral characteristics that suggest that these objects are at different evolutionary stages, have experienced different evolutionary histories, and/or had morphologically different progenitors. Can we shed more light on the evolutionary status of these objects from their Hi properties?
The Z96 sample of E+A galaxies is far more extreme than any other E+A sample in terms of its spectroscopic properties, simply because the large number of galaxies (11000) in the LCRS allows us to find extremely rare objects. Thus we can only compare the Hi properties of our sample with the little Hi data that exist for previously known, but less well-defined, E+A galaxies in the local universe, such as the merger remnants of Liu & Kennicutt (1995a, b) and the cluster galaxies of Caldwell and Rose (1997). The qualitative description of the E+A spectra, in general, is the strong Balmer absorption lines and the very weak emission from [O ii] and [O iii] forbidden lines. Merger remnants have strong Balmer absorption lines, but also significant emission from [O ii] lines (Liu & Kennicutt, 1995a, b; Schweizer, 1996; Kennicutt, 1992; Carter et al., 1988; Bica & Alloin, 1987). Several of these galaxies have been detected in Hi emission. For instance, two merger remnants, NGC 7252, which has clear tidal tails with a total Hi mass of 2 M⊙ (Hibbard et al., 1994), and NGC 520, with a total Hi mass of 3.9 M⊙, exhibit strong Balmer absorption lines but have 6 Å [Oii] emission line equivalent widths (Liu & Kennicutt, 1995a). These galaxies have been called E+A galaxies in the literature, but clearly their spectroscopic properties are different from those of our E+A sample: contrary to our E+As these galaxies have low level ongoing star formation. Moreover, optically EA1 looks like a much younger object than, for example, the merger remnant NGC 7252, and more similar to the Antennae or NGC 6240, both of which are vigorously forming stars. This begs the question, why is EA 1’s current star formation rate so low? Could it be that the gas in EA 1, although significant in Hi mass, is too rarefied to form stars? Unfortunately, the relatively low spatial resolution of our Hi data makes it impossible to resolve the inner Hi mass distribution in EA 1 and address these questions. Furthermore, the upper limits to the Hi mass in EA 2 and EA 3 are not low enough to coin these systems as Hi deficient for merging or interacting systems. That EA 1 is bluer and apparently more gas-rich than EA 2 and EA 3 could point to a difference in gas properties of the progenitors of these systems or a different evolutionary history. On the other hand, EA 1 could represent an early stage of the same evolutionary sequence, before the gas disperses to the point where it is undetectable in EA 2 and EA 3.
We have measured only upper Hi mass limits for the two E+A galaxies, EA 4 and EA 11, in a cluster environment. A recent Hi study of 11 of the 15 E+A galaxies identified in the Coma cluster by Caldwell et al. (1993) and Caldwell and Rose (1997) placed upper limits to the Hi mass of these galaxies of a few 107 M⊙ (Bravo-Alfaro et al., 2000). Because our Hi mass limits are larger and because the criteria for E+A galaxies differ between the samples, a direct comparison is not possible. Observations of larger, well defined, samples are necessary to determine whether cluster E+A galaxies have less Hi than their field counterparts.
The Hi upper limits also do not constrain the galaxy type. There is a large spread in Hi content for galaxies of all morphological types (Roberts & Haynes, 1994), and essentially no type can be ruled out based on our upper limits. Although the Hi content of individual galaxies varies enormously for a given Hubble type, the ratio of Hi mass and blue luminosity is more tightly constrained, log varies smoothly from to just under from early (SOa) to late (Sm, Im) types (Roberts & Haynes, 1994). In Table 4 we list this ratio for the five galaxies. The blue luminosities are calculated from HST PC2 images in the F439W filter (Zabludoff et al., in prep.). For each galaxy, we determine the total magnitude within a 100 pixel radius, correcting for Galactic extinction and applying a -correction based on the spectral energy distribution of an A star. The F439W band is approximately the Johnson B-band for an A stellar spectrum. EA 1 stands out with a rather high log value of ; interestingly, this value is similar to that for tidal tails in gas rich mergers (Hibbard et al., 1994). The upper limits for the other E+A galaxies fall within the range of values for disk galaxies.
We also search a volume of km s-1 around each of the galaxies. Taking into account the primary beam response, the total volume examined down to M⊙ is Mpc3. Using the Hi mass function derived by Zwaan et al. (1997) we expect to detect three galaxies with M⊙ of Hi in such a volume. We only detect one system. This result is somewhat lower than the expected three, but the difference is perhaps not statistically significant. However, we note that our fields are not randomly chosen, but are pointed at known galaxies, and galaxies tend to cluster. Early type galaxies detected in Hi are preferentially found in Hi rich groups (van Gorkom and Schiminovich, 1997), many late type (gas-rich) galaxies live in groups, and even cluster gas-rich galaxies tend to be subclustered (e.g., van Gorkom, 1996). The detection of only one large Hi mass in the entire volume suggests that the environment of the E+A galaxies is mildly Hi deficient.
4.2 The inferred star formation rate
The claim that the E+A galaxies have no ongoing star formation is based on the lack of significant optical emission lines. Our detection of Hi in EA 1 and our upper limits on Hi and radio continuum emission provide an independent way to constrain the on-going star formation rate. In this section we compare the rates estimated using the measured Hi column density, radio continuum emission, and [O ii] equivalent widths of the E+A galaxies. The results are listed in Table 6.
4.2.1 Hi Limits
Although stars form out of molecular gas, Hi appears to trace the star formation rate (SFR) remarkably well (Kennicutt, 1989). Is the detection of a few 109 M⊙ of Hi in EA 1 in contradiction with the claim that no on-going star formation occurs in E+A galaxies? We can make a crude estimate of the SFR in EA 1 using the Schmidt law, which relates the gas surface density to the star formation rate by a simple power law. According to Kennicutt (1998),
= (2.5 0.7) M⊙ yr-1 kpc-2,
where is the total (atomic + molecular) gas surface density averaged over the disks in M⊙ pc-2. The mean Hi surface density in the core of EA 1 is 2.2 cm-2, or 1.8 M⊙ pc-2. If we simply adopt the Schmidt law to estimate the SFR, taking the mean Hi surface density of the central region of EA 1 as the total gas surface density and estimating the size of this region to be 940 kpc2, we get a SFR of 0.5 M⊙ yr-1. The upper limits on the Hi mass in the other E+A galaxies provide upper limits on their SFR of the same order of magnitude (Table 6).
Skillman (1986) points out, however, that there is a surface density threshold below which no star formation occurs. He finds that the observed local Hi column density threshold for star formation is 1 cm-2, at a resolution of 500 pc. Although our resolution is of order 10 kpc, it is still interesting to note that the Hi column density of EA 1 and the column density upper limits for the other E+A galaxies are well below this threshold. If the gas is distributed smoothly over the beam area, then we might expect no on-going star formation in any of the E+A galaxies even though ample Hi exists.
4.2.2 Radio Continuum Limits
Radio continuum emission associated with star-forming galaxies is thought to be due to synchrotron radiation produced by relativistic electrons in supernovae remnants. Therefore, the radio continuum emission provides a probe of massive (M 8 M⊙) star formation in galaxies, independent of dust obscuration. Condon (1992) finds a relationship between 1.4 GHz luminosity and massive SFR of
SFR1.4(M 5 M⊙) = M⊙ .
assuming a Miller-Scalo IMF and using the Galactic radio luminosity and supernova rate. We list upper limits to the star formation rate using this formula in Table 6.
Smail et al. (1999) have cast some doubt on the post-starburst interpretation of the E+A phenomenon after detecting a significant fraction of cluster E+A galaxies at z=0.41 in radio continuum. Radio continuum emission can either be powered by active galactic nuclei (AGN) or by massive star formation. Observationally the two can easily be distinguished by morphology (jet/core morphology vs. extended disk emission). The radio power resulting from the two mechanisms is also quite different with a small range of overlap. The radio continuum luminosity from AGN is typically L W Hz-1 at 1.4 GHz, while that due to star formation is L W Hz-1 (Condon, 1989). The (unresolved) detections by Smail et al. (1999) in CL 0939+4713 at z have radio luminosities of L W Hz-1 and, based on their radio luminosity alone, could either be dust-enshrouded starbursts or AGN. However, these authors suggest that the fact that 4 out of 5 of those systems are disk galaxies favors the starburst interpretation. Our upper limits of a few W Hz-1 make it unlikely that our sample of E+A galaxies host radio loud AGN. Although we cannot rule out ongoing star formation at a low level (Table 6), our upper limits are an order of magnitude smaller than the detections by Smail et al. (1999). We do not find evidence for hidden starbursts in the most extreme local E+A’s.
4.2.3 O ii Limits
The [O ii] emission line strength is another indicator of on-going star formation. The derived star formation rates from [O ii] are less accurate than those derived from H, but are comparable in accuracy to rates derived from the optical continuum flux and colors (Kennicutt, 1992b). Barbaro & Poggianti (1997) find that if the number of ionizing stars of an H ii region is small ( 50), the [O ii] equivalent width itself is a good SFR indicator; however, the method fails if the number of ionizing stars is much larger than 50 (Stasinska & Leitherer, 1996). Because of their low current SFR’s, the E+A’s are probably in a low ionization regime and the [O ii] equivalent width should provide a rough estimate of the SFR in the E+A galaxies.
The relation between the [O ii] luminosity and equivalent width is given by (Kennicutt, 1992b)
L erg s-1,
where is the B band luminosity in , and EW stands for equivalent width. The values were derived from our HST data and are listed in Table 1. Using the relationship between SFR and L (Barbaro & Poggianti, 1997):
SFR(M⊙ yr-1) 6.3 L
we calculate the star formation rates (Table 6) for all E+A galaxies. A 2 upper limit was used for the line intensity in the E+A galaxies that were not detected in [O ii].
The different methods used to derive limits on the current SFR in E+A galaxies each have their own limitations. The estimates based on the [O ii] equivalent width could be affected by extinction. Although there is a tight relation between radio continuum and other indicators of SFR (specifically CO emission and FIR flux), the reason for this correlation is not well understood. The SFR associated with Hi must also depend on the volume density of the gas, which is not known. Nonetheless, it is reassuring that the low star formation rates indicated by the [O ii] equivalent widths are not that much lower than the other values. These E+A galaxies are forming stars at a very modest rate, if at all.
5 CONCLUSIONS
This first search for gas in a rigorously defined set of the most extreme local E+A galaxies finds M⊙ of Hi in one galaxy and obtains upper limits for four more. Thus not all E+A galaxies are gas deficient; E+A formation does not always exhaust the entire gas reservoir.
In the one system detected in Hi, the morphology of the gas supports the hypothesis that the original starburst was induced via a galaxy interaction. The time elapsed since the interaction started, derived from the Hi kinematics, is roughly consistent with the time since the starburst must have stopped. However, the fact that the system contains a substantial amount of Hi, and that the merger appears not yet complete, raises questions of why the starburst has ceased.
None of the E+A galaxies in our sample were detected in radio continuum. The corresponding upper limits on the star formation rate rule out that these galaxies are highly obscured, extremely vigorous star forming systems (i.e. 10 M⊙ yr-1). Using spectral synthesis models (Bruzual & Charlot, 1993, and later models), one can show that the starbursts that produce E+A galaxies formed of their stellar mass during a burst of duration yrs; therefore, the corresponding SFR during the burst must be 10 M⊙ yr-1. From a comparison of this SFR and our observational limits, we conclude that the SFR in these systems must have dropped by at least an order of magnitude within the past 1 Gyr.
Although we can exclude large SFR’s, none of the available star formation indicators exclude star formation rates at a level comparable to or below that of a weak spiral galaxy. The [O ii] emission or lack thereof implies even lower star formation rates than inferred from the Hi or radio continuum luminosities, but the [O ii] estimate could be affected by dust.
References
- Barbaro & Poggianti (1997) Barbaro, G., & Poggianti, B. M. 1997, A&A, 324, 490
- Belloni et al. (1995) Belloni, P., Bruzual, A. G., Thimm, G. J., & Roeser, H.-J. 1995, A&A, 297, 61
- Bica & Alloin (1987) Bica, E. & Alloin, D. 1987, A&AS, 70, 281
- Bravo-Alfaro et al. (2000) Bravo-Alfaro, H., Cayatte, V., van Gorkom, J. H., & Balkowski, C. 2000, AJ, 119, 580
- Bruzual & Charlot (1993) Bruzual A.G. & Charlot, S. 1993, ApJ, 405, 538
- Butcher & Oemler (1978) Butcher, H., & Oemler, A. 1978, ApJ, 219, 18
- Butcher & Oemler (1984) Butcher, H., & Oemler, A. 1984, Nature, 310, 31
- Caldwell et al. (1993) Caldwell, N., Rose, J. A., Sharples, R. M., Ellis, R. S., & Bower, R. G. 1993, AJ, 106, 473
- Caldwell and Rose (1997) Caldwell, N. & Rose, J. A. 1997, AJ, 113, 492
- Carter et al. (1988) Carter, D., Prieur, J. L., Wilkinson, A., Sparks, W. B., & Malin, D. F. 1988, MNRAS, 235, 813
- Condon (1989) Condon J. J. 1989 ApJ, 338, 13
- Condon (1992) Condon, J. J. 1992, ARA&A, 30, 575
- Couch & Sharples (1987) Couch, W. J. & Sharples, R. M. 1987, MNRAS, 229, 423
- Dressler & Gunn (1983) Dressler, A., & Gunn, J. E. 1983, ApJ, 270, 7
- Dressler and Gunn (1990) Dressler, A., & Gunn, J. E. 1990, in Evolution of the universe of galaxies, ed. R. G. Kron, A.S.P. Conference Series Vol. 10, 200
- Fabricant et al. (1991) Fabricant, D. G., McClintock, J. E., & Bautz, M. W. 1991, ApJ, 381, 33
- Franx (1993) Franx, M. 1993, ApJ, 407, L5
- Helou et al. (1991) Helou, G., Madore, G., Schmitz, M., Bicay, M., Wu, X. & Bennett, J. 1991, in “Databases and On-Line Data in Astronomy,” ed. D. Egret & M. Albrecht (Dordrecht: Kluwer), p. 89.
- Hibbard et al. (1994) Hibbard, J. E., Guhathakurta, P., van Gorkom, J. H., & Schweizer, F. 1994, AJ, 107, 67
- Hibbard & van Gorkom (1996) Hibbard, J. E., & van Gorkom, J. H. 1996, AJ, 111, 655
- Kennicutt (1989) Kennicutt, R. 1989, ApJ, 344, 685
- Kennicutt (1992) Kennicutt, R. 1992, ApJS, 79, 255
- Kennicutt (1992b) Kennicutt, R. 1992b, ApJ, 388, 310
- Kennicutt (1998) Kennicutt, R. 1998, ApJ, 498, 541
- Liu & Kennicutt (1995a) Liu, C. T., & Kennicutt, R. 1995a, ApJ, 450, 547
- Liu & Kennicutt (1995b) Liu, C. T., & Kennicutt, R. 1995b, ApJS, 100, 325
- Poggianti et al. (1999) Poggianti, B. M., Smail, I. Dressler, A., Couch, W. J., Barger, A. J., Butcher, H., Ellis, R. S., & Oemler, A. 1999, ApJ, 518, 576
- Roberts & Haynes (1994) Roberts, M. S., & Haynes, M. P. 1994, ARA&A, 32, 115
- Schweizer (1982) Schweizer, F. 1982, ApJ, 252, 455
- Schweizer (1996) Schweizer, F. 1996, AJ, 111, 109
- Shectman et al. (1996) Shectman, S. A., Landy, S. D., Oemler, A., Tucker, D. L., Lin, H., Kirshner, R. P. & Schechter, P. L. 1996, ApJ, 470, 172
- Skillman (1986) Skillman, E. D., 1986, in Star Formation in Galaxies, ed. Lonsdale, C. J., NASA Conference Publication 2466, 263
- Smail et al. (1999) Smail, I., Morrison, G, Gray, M. E., Owen, F. N., Ivison, R. J., Kneib, J.-P. & Ellis, R. 1999, ApJ, 525, 609
- Stasinska & Leitherer (1996) Stasinska, G., & Leitherer, C. 1996, ApJS, 107, 661
- Tucker et al. (1998) Tucker, D., Hashimoto, Y., Kirshner, R., Landy, S., Lin, H., Oemler, A., Schechter, P., & Shectman, S. 1998, in Large Scale Structure: Tracks and Traces, proceedings of the 12th Potsdam Cosmology Workshop (ed. V. Mueller, S. Gottloeber, J.P. Muecket, J. Wambsganss) 105-106 (World Scientific)
- van Gorkom (1996) van Gorkom, J. H. 1996 in the Minnesota Lectures on Extragalactic Neutral Hydrogen, ed. Skillman, E. D., A.S.P. Conference Series, Vol. 106, 293
- van Gorkom and Schiminovich (1997) van Gorkom, J. H. & Schiminovich, D. 1997, in The Nature of Elliptical Galaxies, ed. Arnaboldi, M., Da Costa, G. S., & Saha, P., A.S.P. Conference Series Vol. 116, 310
- Yun (1992) Yun, M. S., 1996, Study of Tidal Interactions in M81-M82-NGC3077 System, Ph.D. Thesis
- Zabludoff et al. (1996) Zabludoff, A. I., Zaritsky, D., Lin, H., Tucker, D., Hashimoto, Y., Shectman, S. A., Oemler, A., & Kirshner, R. P. 1996, ApJ, 466, 104 (Z96)
- Zwaan et al. (1997) Zwaan, M. A., Briggs, F. H., Sprayberry, D., & Sorar, E. 1997, ApJ, 490, 173


| Galaxy | Coordinate(B1950) | cz | LB | Cluster | ||
|---|---|---|---|---|---|---|
| (km ) | (109 L⊙) | ( Mpc) | ||||
| EA 1 | 4.9 | 228 | N | |||
| EA 2 | 9.4 | 303 | N | |||
| EA 3 | 16.7 | 248 | N | |||
| EA 4 | 15.9 | 311 | Y | |||
| EA 11 | 11.4 | 374 | Y | |||
| Galaxy | Observing | Field Center(1950) | Array | Velocity | ||
|---|---|---|---|---|---|---|
| Date | Time | km | ||||
| EA 1 | Mar 1996 | 11 hr | C | 22380 | ||
| EA 2 | Jun 1997 | 12 hr | CnB | 29600 | ||
| EA 3 | Mar 1996 | 2 hr | C | 24310 | ||
| EA 4 | Jan 1996 | 22 hr | CnB | 30350 | ||
| & Jun 1997 | ||||||
| EA 11 | Jun 1997 | 12 hr | CnB | 36480 | ||
| Galaxy | Synthesized Beam | Total Hi Flux | ||
|---|---|---|---|---|
| FWHM | ( kpc kpc) | Position angle | (Jy km ) | |
| EA 1 | 24.8 18.8 | 0.30 0.02 | ||
| EA 2 | - | |||
| EA 3 | - | |||
| EA 4 | - | |||
| EA 11 | - | |||
| Galaxy | r.m.s. noise | Channel Width | Observed 200 km r.m.s. | Intensity expected | |||
|---|---|---|---|---|---|---|---|
| (mJy Beam-1) | ( cm-2) | (km s-1) | ( ) | (mJy Beam-1) | (mJy Beam-1) | ||
| EA 1 | 0.2 | 2.4 | 47.6 | 3.5 0.2 | 0.1 | - | |
| EA 2 | 0.3 | 3.7 | 49.8 | 1.5 | 0.2 | 0.8 | |
| EA 3 | 0.6 | 5.7 | 48.2 | 1.9 | 0.3 | 1.2 | |
| EA 4 | 0.2 | 2.5 | 50.0 | 1.0 | 0.1 | 0.7 | |
| EA 11 | 0.3 | 4.4 | 51.9 | 2.3 | 0.2 | 0.5 | |
| Galaxy | r.m.s. noise | |
|---|---|---|
| (mJy Beam-1) | ( W ) | |
| EA 1 | 0.06 | 1.1 |
| EA 2 | 0.1 | 3.3 |
| EA 3 | 0.1 | 2.9 |
| EA 4 | 0.07 | 2.4 |
| EA 11 | 0.1 | 7.1 |
| Galaxy | Hi | Radio Continuum | [O ii] |
|---|---|---|---|
| EA 1 | 0.5 | 0.3 | 0.1 |
| EA 2 | 0.3 | 0.8 | 0.1 |
| EA 3 | 0.5 | 0.7 | 0.1 |
| EA 4 | 0.2 | 0.6 | 0.2 |
| EA 11 | 0.5 | 1.8 | 0.2 |