Globular cluster systems II: On the formation of old globular clusters and their sites of formation
Abstract
We studied the metal-poor globular cluster populations of a large variety of galaxies and compared their mean metallicity with the properties of the host galaxies. For this purpose, we constructed a comprehensive database of old, metal-poor globular cluster populations, hosted by 47 galaxies spanning about 10 magnitudes in absolute brightness. The mean metallicities of the systems are found to be very similar and to lie in the [Fe/H] range (74 % of the population). Using only globular cluster systems with more than 6 objects detected, we find that 85 % of the population are within [Fe/H]. The relation between the mean metallicity of the metal-poor globular cluster systems and the absolute V magnitude of their host galaxies presents a very low slope which includes zero. An analysis of the correlation of the mean metallicity of the populations with other galaxy properties (such as velocity dispersion, metallicity, environment density) also leads to the conclusion that no strong correlation exists. The lack of correlation with galaxy properties suggests a formation of all metal-poor globular clusters in very similar gas fragments. A weak correlation (to be confirmed) might exist between mean metallicity of the metal-poor clusters and host galaxy metallicity. This would imply that at least some fragments in which metal-poor globular clusters formed were already embedded in the larger dark matter halo of the final galaxy (as oppose to being independent satellites that were accreted later). Our result suggests a homogeneous formation of metal-poor globular clusters in all galaxies, in typical fragments of masses around - M⊙ with very similar metallicities, compatible with hierarchical formation scenarios for galaxies.
We further compare the mean metallicities of the metal-poor globular cluster populations with the typical metallicities of high redshift objects. If we add the constraint that globular clusters need a high column density of gas to form, Damped Lyman systems are the most likely sites among the known high redshift objects for the formation of metal-poor globular cluster populations.
1 Introduction
Globular clusters contain the oldest known stellar populations of the Milky Way and probably of the observed Universe. Consequently, they hold cosmologically significant information and are often used as fossil records of the formation of galaxies. At least two globular cluster sub-systems were found to coexist in our Galaxy (Kinman, 1959; Zinn, 1985; Armandroff & Zinn, 1988; Armandroff, 1989): i) a metal-poor, slowly rotating spherically distributed one in the halo and ii) a metal-rich, rapidly rotating population concentrated in the disk (or the bulge, e.g. Minniti, 1995). A similar situation was observed in M 31 (Ashman & Bird, 1993; Barmby et al., 2000). Subsequently, globular cluster sub-populations were also discovered in early-type galaxies (Zepf & Ashman, 1993). This motivated comparisons between the globular cluster sub-populations and the host galaxies. Such studies were pioneered by Ashman & Bird (1993) and revived by Forbes et al. (1997a). Our work is motivated by the recent increase in data identifying metal-poor globular cluster populations, especially in early-type galaxies, as well as by recent studies associating the metal-poor sub-population in early-type galaxies with a extended, halo-like(?) component, similar to the ones observed in late-type galaxies (Geisler et al., 1996; Kissler-Patig et al., 1997a; Lee et al., 1998). This encouraged us to look not only into common properties of these sub-systems and to investigate possible correlations between their properties and those of their host galaxies, but also to put them into a galaxy formation context and to identify their possible sites of formation.
2 The compilation of old globular cluster populations
2.1 Focusing on metal-poor globular clusters
We intend to select the oldest globular clusters around galaxies, with the minimum pollution from younger globular clusters. Even if absolute ages are not well defined, halo globular clusters in the Milky Way were shown to be very old systems and at least older than 10 Gyr (e.g. Chaboyer et al., 1998; Jimenez & Padoan, 1998). Globular clusters with [Fe/H] are essentially located in the halo but, more importantly, they are likely to be coeval within less than 1 Gyr (see Rosenberg et al., 1999). This also seems to be the case in other Local Group galaxies (Olszewski et al., 1996; Sarajedini et al., 1998). Furthermore, spectroscopic studies of giant ellipticals showed that the age of their metal-poor globular clusters appears indistinguishable within the errors (1 to a few Gyr) from that of the Milky Way halo clusters (Kissler-Patig et al., 1998a; Cohen et al., 1998). Assuming that these globular clusters are among the first stellar populations formed in the galaxies, we expect them to reflect the local pre- or proto-galactic conditions and especially the abundances more than 10 Gyr ago. This paper will focus on the metal-poor globular clusters, assumed to be the oldest ones.
It was proposed that, in some galaxies, the metal-poor and (at least part of) the metal-rich clusters were coeval within a few Gyr (e.g. Ortolani et al., 1995; Feltzing & Gilmore, 2000; Puzia et al., 1999). However, given the fact that this has not been generally demonstrated, and given that a number of scenarios predict the metal-rich clusters to be younger than the metal-poor ones, we will not discuss these in this paper.
2.2 On colors and metallicities and the detection of bimodality
Our goal is to identify properties that are commonly measured in all known metal-poor populations. The mean metallicity of the metal-poor sub-population in a galaxy (noted as [Fe/H]mp throughout the paper) is the only such property currently available for a majority of galaxies. The following analysis will focus on this property, and by mean metallicity we actually refer to the peak of the metallicity distribution of the metal-poor globular clusters sub-population in a galaxy.
The determination of the mean metallicity of metal-poor populations is complicated by two problems when derived from broad-band colors, as for the majority of our sample: i) a perfect separation of the metal-poor and metal-rich populations (and thus a determination of the mean color/metallicity for an unbiased sample of metal-poor clusters) is not possible from the broad-band color distributions, and ii) the transformation of the broad-band colors into metallicities suffers from systematic errors. The uncertainties associated with each point are discussed below.
In order to determine the mean metallicity of the metal-poor clusters from a color distribution of a whole system, the distribution is probed by a mixture modeling test (KMM, see Ashman et al., 1994) that, among others, returns the most likely color peaks of the sub-populations. Typical errors for the peak determination in (the most widely used color), induced by the KMM method alone, range from 0.01 to 0.05 magnitudes (sensitively dependent on the number of data points and the intrinsic width of the distributions) which translates into errors in the mean [Fe/H] values of up to 0.25 dex. These errors are typically added to the statistical errors present in the photometry, and to potential systematic errors in the sampling of the metal-poor population. A large fraction of our metallicities are obtained from colors derived from WFPC2/HST data. Median color values for the same system can vary from author to author by up to 0.06 in (see for instance NGC 4472 in Neilsen & Tsvetanov, 1999; Puzia et al., 1999). Moreover, in order to combine the studies in different bands, and to combine the results derived from colors and from spectroscopy, the broad-band colors need to be transformed into metallicities. The sensitivity of a color to metallicity transformation varies by almost a factor of two when going from over to , making a homogeneous compilation difficult. The different transformations for a given color into metallicity (often derived from the Milky Way clusters) can introduce errors of the order of [Fe/H] dex depending on the exact method used to derive the relation (e.g. the comparison in Kissler-Patig et al., 1998b).
In summary, taking the quoted mean metallicities directly from the literature could result in a artificial scatter of up to 0.4 dex in [Fe/H]mp in the extreme cases, given the different analyses of the various authors. Therefore, in addition to the [Fe/H]mp values, we will use the values of the blue peak in the globular cluster color distributions, available for a subset of our sample. The latter avoids the possibility of introducing any error related to a different method of deriving metallicities, or errors associated with the conversion of colors to metallicities.
2.3 The data compilation
The mean metallicity of the metal-poor clusters, as well as their mean color (when available) are given in Table Globular cluster systems II: On the formation of old globular clusters and their sites of formation for all galaxies which are known, to date, to host a distinct metal-poor cluster population. We included the data published by Kundu in his PhD thesis (Kundu, 1999) for 9 new galaxies (and additional data for 8 galaxies already in our list).
New values for 7 galaxies, derived from data presented in Paper I (Gebhardt & Kissler-Patig, 1999), are also added. The data and reduction are presented in the original paper. We selected all galaxies with clear bimodalities (see Paper I), and used the KMM code to derive the peak color of the blue globular clusters. These values, as well as the ones from Kundu (1999) were transformed into metallicities using the ([Fe/H], relation given in Kissler-Patig et al. (1998b): [Fe/H].
All other values in Table Globular cluster systems II: On the formation of old globular clusters and their sites of formation are taken from the original references. We also added to the above sample a number of dwarf galaxies which present a unimodal metallicity distribution function with an average metallicity below the threshold defined in Sect. 2.1. We have assigned global uncertainties to each color : , , (following Forbes et al., 1997a) unless different values are given in the original papers.
The compilation includes galaxies of all types. However spiral galaxies are under-represented and bright elliptical galaxies dominate the sample. This observational bias is essentially due to the fact that : i) globular clusters are more easily identified on the smooth background of elliptical galaxies than in dusty spirals, ii) bright ellipticals host a larger number of globular clusters than faint ellipticals or spirals.
The host galaxy properties to which we compare the globular cluster properties are compiled in Table 2. These are taken from the HYPERCAT database (Prugniel & Simien, 1996; Golev & Prugniel, 1998), except for the environment density taken from the Nearby Galaxy Catalog (Tully, 1988). We chose the Mg2 index as a metallicity indicator rather than, for example, the color of the galaxy, because it is widely available and does not require dereddening or transformation to reflect the metal content of the galaxy. We keep in mind that Mg2 is essentially measured in the very inner regions of the galaxy, and does not directly reflect the mean metallicity of the halo. Nevertheless, it appears to be a good indicator for the final global metallicity and correlates well with the velocity dispersion of the galaxy (e.g. Dressler et al., 1987).
The above mentioned velocity dispersion is used as a size indicator for the galaxies, rather than e.g. the estimated absolute magnitude, since the former is distance independent, while the latter is not and is therefore more difficult to bring onto a homogeneous scale. In order to get comparable values for all galaxies, we tried to select only seeing-limited ground-based determinations for the central velocity dispersion, e.g. HST/STIS values being systematically higher due to the higher spatial resolution.
The data described above is used in the next section to investigate possible correlations between the mean metallicity of the globular clusters and the host galaxy properties.
3 Globular cluster mean metallicities and galaxy properties
3.1 A “universal” mean metallicity for metal-poor globular clusters
Until the early 90s, the mean metallicities of the globular cluster systems was thought to correlate with the galaxy luminosity (vandenBergh, 1975; Brodie & Huchra, 1991). Ashman & Bird (1993) first investigated the correlation between the mean metallicity of the metal-poor globular clusters only and the galaxy luminosity. They based their analysis on data of 4 local dwarf galaxies as well as the LMC, the Milky Way and M31. They found that a mean value of [Fe/H] dex for all halo globular cluster systems appeared consistent with the data, and claimed that genuine halo globular cluster systems have comparable mean metallicities, irrespective of the parent galaxy luminosity. Further, adding the data of the 4 early-type galaxies known at that time to have bimodal globular cluster metallicity distributions, they speculated that the earlier relations (see above) were primarily a result of the high fraction of metal-rich globulars in bright elliptical galaxies.
Forbes et al. (1997a) later confirmed this result with a slightly larger sample of 11 galaxies, by looking at the correlation of mean metallicity with galaxy luminosity for the metal-poor and metal-rich clusters separately. For the metal-rich population, they found a positive correlation at the 3 level. For the metal-poor globular clusters, Forbes et al. (1997a) did not detect any correlation but a random scattering. Their dataset has a mean of [Fe/H]mp with a dispersion of (as determined by us using a maximum-likelihood estimator on their 11 values).
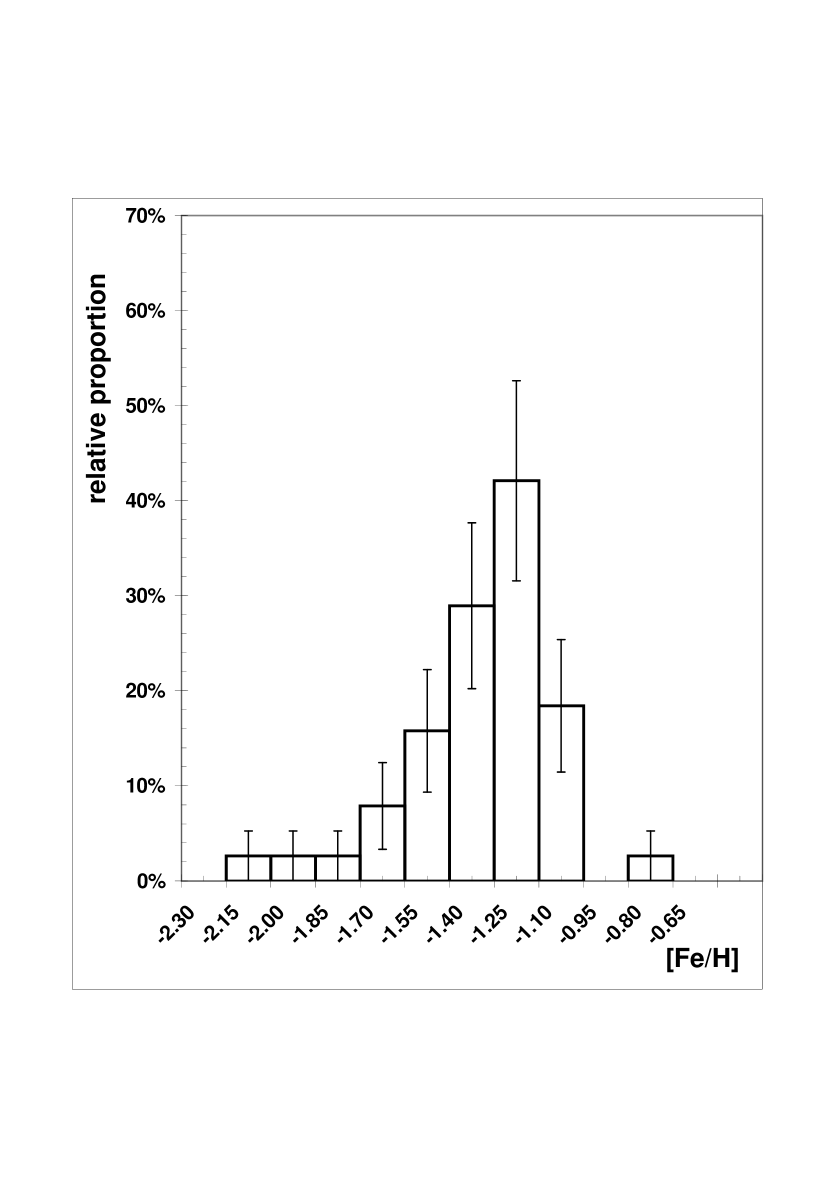
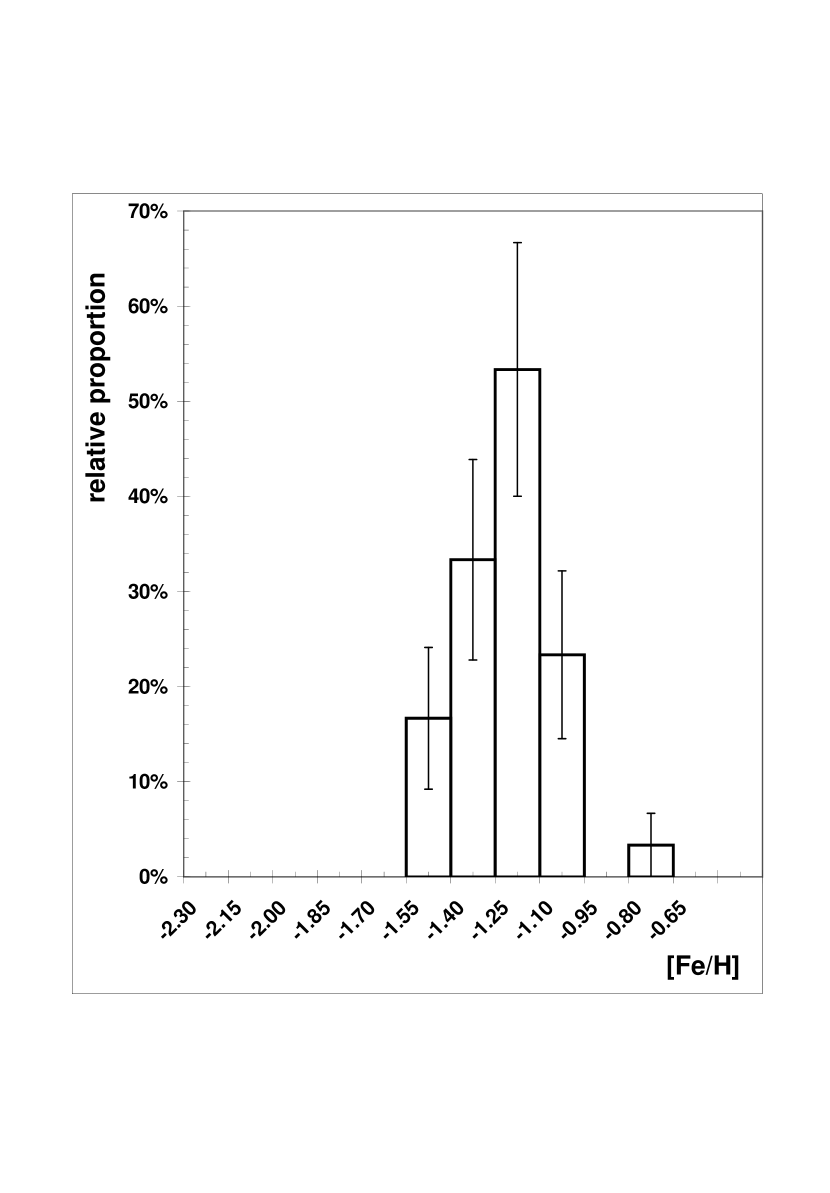
The sample of globular cluster systems presented in this paper is the largest database to-date, and times more numerous than Forbes et al. (1997a) initial dataset. The mean of our data lies at [Fe/H] with a dispersion of . Compared to the Forbes et al. dataset, our sample is slightly more metal-poor on average and exhibits a smaller scatter. The mean absolute magnitude of the galaxies in our sample is with a dispersion of 2.4 mag. Fig. 1 shows the distribution of mean metallicities, plotted as a percentage of globular cluster systems within each bin ([Fe/H]). The first apparent result is that the mean-metallicities of the metal-poor globular clusters are not distributed homogeneously over the spanned range, but rather peak around a characteristic value : 74% of the sample is concentrated around [Fe/H]. The distribution is asymmetric and more extended towards lower metallicity (dominated by the dwarf galaxies), resembling in shape to the halo field star metallicity distribution. When we exclude galaxies with a number of observed blue globular clusters N (almost exclusively dwarf galaxies) from the sample, our statistics are slightly altered to [Fe/H] and for the 39 remaining galaxies . The new histogram (Fig. 1) appears more peaked. Indeed, 85 % of the globular cluster systems are found within [Fe/H] and 67% within the two central bins i.e. [Fe/H]. Thus, the data suggest an even higher concentration of the metal-poor globular clusters.
The peaked (roughly Gaussian) distribution of the mean metallicities would be expected on the base of the Central Limit Theorem if all metal-poor globular clusters could be associated with a single sample (i.e. be considered to have a similar origin). The fact that the distribution looks indeed peaked supports the latter hypothesis.
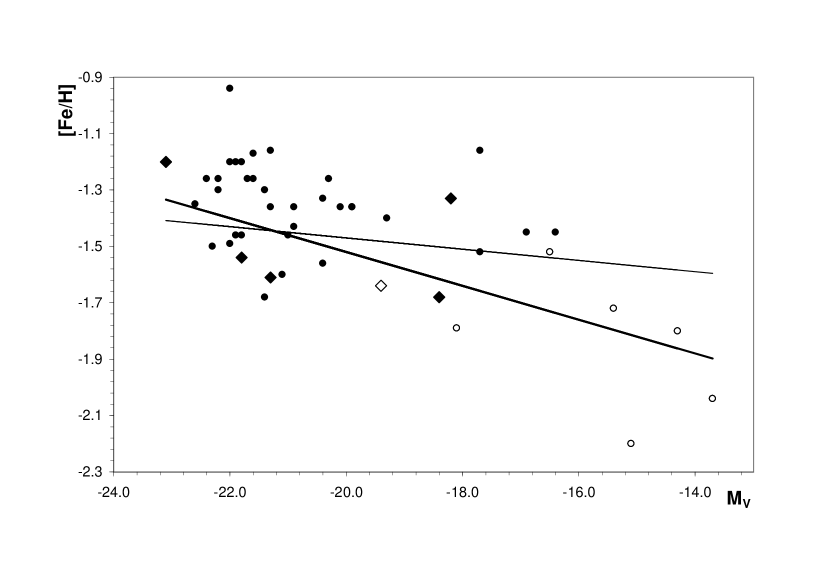
Figure 2 shows the metallicities of the globular cluster systems as a function of the absolute magnitude . The global trend is a decrease of the metallicity with . The statistical Spearman’s rank test seems to confirm this impression and gives a probability of 0.0005 that a correlation is not present (Spearman’s = -0.521). A linear fit gives : [Fe/H] for 46 values. However, removing the globular cluster systems with NGC 6 from the sample (but keeping Kundu’s), the same Spearman rank test gives a much lower probability of 0.0813 that a correlation is not present (Spearman’s = -0.283 for 39 values). A linear fit gives [Fe/H], with a low slope not significantly different from zero (at 1).
Thus, the mean metallicity of the old, metal-poor globular clusters seems to correlate with the absolute luminosity of their host galaxy. However, taking only the galaxies with NGC 6, this correlation is no longer statistically significant while we still have a large range in galaxy luminosity (). Thus, our findings confirm Ashman $ Bird’s results for the metal-poor clusters. However, the globular cluster systems of dwarf galaxies seems to deserve a more complete discussion and they will be discussed in a future paper.
3.2 Mean metallicities against Mg2, , and environment density
Next, we investigate whether the mean metallicity of the metal-poor globular clusters correlates with other galaxy properties, like metallicity, size or environment. We used the derived mean metallicities, as well as the mean values (when available), to avoid possible systematic errors due to the different transformations from broad-band colors to metallicities. Note that when several values for were available for a given system, we computed a simple mean, and averaged it with any other metallicity determination, if available for that system.
The correlation between [Fe/H]mp and the Mg2 index of the host galaxy, as well as between [Fe/H]mp and the velocity dispersion of the host galaxy, computed for the full sample, are significant at the 99% confidence level (spearman test returning student distributed -value and 2.90 with 35 and 40 degrees of freedom, respectively). Mg2 and being strongly correlated (see Fig. 3 for our sample), the similarity of the relations is not surprising. Neglecting, however, the dwarf galaxies (Mg, kms-1) which do not exhibit a separate metal-poor component, reduces the significance of the correlations to the 92% confidence level ( and 1.30 for 33 and 35 degrees of freedom, respectively). Furthermore, the significance is reduced even further when selecting the clusters as in Sect. 3.1 (i.e. only galaxies with more than 6 clusters are considered). The correlation disappears well below the 90% confidence level ( and 0.75 for 32 and 34 degrees of freedom, respectively).
A linear fit returns a relation of the form [Fe/H] for the full sample. The slope of this relation is times shallower than a direct conversion of Mg2 into [Fe/H]mp (see Kissler-Patig et al., 1998b) indicating only a very weak dependence of globular cluster mean metallicity on galaxy metallicity, if present at all.
Again, a possible correlation for dwarf galaxies will be discussed in a future paper discussing metal-rich globular cluster sub-populations.
We note that absolutely no correlation is detected with environment density ( for 35 degrees of freedom).
3.3 against Mg2, , and environment density
Similar test as in the above section were preformed for instead of metallicity in order to avoid any potential systematic effects arising from the conversion of color into metallicity.
The most significant correlations of the peak color with a galaxy property are again the correlation between and Mg2, and and for the full sample. The quantities are correlated at the 97% confidence level ( and 1.80 for 27 degrees of freedom respectively). These correlations are mostly driven by NGC 4458, the only galaxy with 6 or less clusters for which a peak color is available. Note, however, that NGC 4458 is a rather uncertain detection: Neilsen & Tsvetanov (1999) had 17 clusters to detect a bimodality in the color distribution, of which 6 are associated to the metal-poor peak. Neither Kundu (1999), nor we could detect a bimodality and reproduce this result with 33 clusters detected in the Gebhardt & Kissler-Patig (1999) dataset. Removing this galaxy from the sample, the significances of the correlations are reduced to the 94% and 90% confidence level ( and 1.39 for 26 degrees of freedom, respectively), becoming marginal. A linear fit returns a relation of the form for the sample excluding NGC 4458. The slope is compatible with 0 within 1.3 errors (a similar result is obtained for the velocity dispersion). Figure 4 shows the relations.
A correlation with environment density is completely absent ( for 26 degrees of freedom).
We conclude that, the mean metallicity of the metal-poor globular clusters is not significantly related to the size, metallicity or environment of the host galaxy. A weak correlation might exist but remains to be confirmed.
Interestingly, Larsen et al. (2001 in preparation) find for a very homogeneous sample of 12 galaxies a similar trend. Tentative implications are discussed below.
4 Some constraints on the formation of halo globular clusters
From the results of Sect. 3 we retain two important points :
1) the mean metallicity of our sample of metal-poor globular cluster systems is only weakly (if at all) dependent of the host galaxy properties (MV, type, environment, metallicity). This suggests that the formation of metal-poor globular clusters was largely uncorrelated with the final host galaxy properties. The metal-poor globular clusters (often associated with the halo) could have formed either in the proto-galactic phases of the host galaxies or in the earlier phases of the galaxy formation. The old age of the globular clusters also supports these latter ideas.
2) the mean value of our sample of metal-poor globular cluster systems seems almost “universal” at [Fe/H] with a low dispersion of the metallicity distribution function of . This suggests a “universal” mode of formation for the metal-poor globular clusters, in the sense that their formation sites had very similar metallicities / properties (?).
4.1 Size of the putative fragments
With this formation hypothesis in mind, we can explore a noteworthy consequence on the fragment sizes. Ashman & Bird (1993) already addressed this problem comparing globular cluster sub-groups within the M31 halo with expectations from cold dark matter models (predicting substructures of the order of ). They found the observations and predictions in good agreement, with typical mass scales for substructures within M31 of M⊙. The sizes can also be derived by combining i) the mean metallicity of the metal-poor globular clusters around giant galaxies and ii) an assumed relation between the galaxy initial luminosity and the average globular cluster metallicity (Côté et al., 1998). Relating the two, most metal-poor globular clusters must have formed in objects with luminosities around M, i.e. masses of the order of to M⊙ (i.e. in galaxies larger than the remaining dwarfs observed in the Milky Way neighborhood). In good agreement with Ashman & Bird (1993)’s results.
4.2 Was the formation of the metal-poor globular cluster independent of the final host galaxy ?
The current data favor a formation of most metal-poor globular clusters in very similar environments/substructures, out of low-metallicity gas (as already speculated by Ashman & Bird, 1993).
Whether these substructures were fragments à la Searle & Zinn (1978), i.e. entities within the dark matter halo of the final host galaxy, or satellites with similar properties but independent of the dark matter halo of the final galaxy, is unclear. But it appears secure that they formed independently of the metal-rich component (bulge) of the host galaxy.
Thus, the properties cannot distinguish yet between a scenario in which the metal-poor globular clusters formed completely independently of the final galaxy and were later accreted (e.g. Richtler, 1994; Côté et al., 1998; Hilker et al., 1999), and a scenario in which they formed as part of the galaxy during the assembly of the halo (Searle & Zinn, 1978). The latter would be favored if a correlation between the mean metallicity of the metal-poor clusters and the metallicity of the host galaxy would exist. The former would be favored if no such correlation would be present. Both scenarios would not restrict any formation scenario of the final galaxy (e.g. major collapse, major merger, …), since all galaxy formation scenarios envision similar assemblies of the halos (be it as a first stage of further collapse or as the halos of progenitors of a subsequent major merging event).
If existent, the correlation between the mean metallicity of the metal-poor population and the galaxy metallicity is about 10 times shallower than a one to one relation. Such a correlation would imply that a fraction of the metal-poor globular clusters formed in satellites (i.e. not related to the dark matter halo of the galaxy) but get accreted later while the other part formed in fragments (i.e. already within the dark halo of the final galaxy). For our dataset such a correlation is, however, still uncertain, and the fraction of metal-poor clusters from both origins in a system that contributes to it is also unknown and probably variable with galaxies.
Finally, we do know that, in the Milky Way, some halo globular clusters formed around other galaxies and were accreted later on. For example, such an accretion process can be witnessed today in the form of the Sagittarius dwarf galaxy (Ibata et al., 1994). Although halo globular clusters of the Milky Way form a homogeneous population from their metallicity, it has been suggested from an analysis of their horizontal branch types (Zinn, 1993) that it may contain two sub-systems with similar average metallicities. This would complicate the interpretation of their origin. A review of pros and cons can be found in Ashman & Zepf (1998), Harris (2000) and Parmentier et al. (2000).
5 Time and site of formation of the metal-poor globular clusters
5.1 DLA systems as the progenitors of metal-poor globular clusters
Pettini et al. (1999) presented a diagram giving the rough location of different components of the early universe at z 3 in a N(HI) – metallicity plane. Among the objects whose metallicity can be estimated at high redshift are the Damped Lyman (DLA) systems, the Lyman Break Galaxies (LBG) and the Lyman forest. DLA systems are neutral gas objects observed at all redshifts (Pettini et al., 1999; Prochaska & Wolfe, 2000). Their dynamics is consistent with protogalactic clumps or progenitors of present-day galactic disks (Wolfe et al., 1995; Katz et al., 1996; Haehnelt et al., 1996). One interpretation of DLA systems is that they are gas clouds within protogalactic halos, that could be associated with Searle-Zinn fragments. LBGs are star-forming objects similar to our local starbursting galaxies (Steidel et al., 1996) They appear as objects with compact cores, some with multiple components, surrounded by diffuse and asymmetric halos (Steidel et al., 1996; Lowenthal et al., 1997). If the metallicity of the Lyman forest is definitely too low, DLA systems and LBGs are found to lie in the same metallicity range as halo globular clusters. However, recent data from Kobulnicky & Koo (2000) show that the mean interstellar medium metallicity in their LBGs is consistent with the metal-rich globular cluster population in the Milky Way. Consequently, since metal-poor globular clusters are formed from metal-poor gas, DLA systems appear as the best candidates for their site of formation.
Furthermore, globular clusters contain stars and the column density of their progenitors must be above a threshold of N(HI) 1020 cm-2 for the star formation to occur (Kennicutt, 1989). Simulations carried out by Nakasato et al. (2000) also suggest that a self-enrichment in a cloud appears to exclude the formation massive star clusters. However, this point is still controversial (Parmentier et al., 2000).
Bringing the above mentioned facts together confirms the allowed location of halo globular cluster progenitors in the N(HI) vs. [Fe/H] diagram and suggests that we should concentrate, as a working hypothesis, on DLA systems as the potential sites of formation of the (halo) metal-poor globular clusters.
5.2 Estimating the metallicity evolution of DLA systems
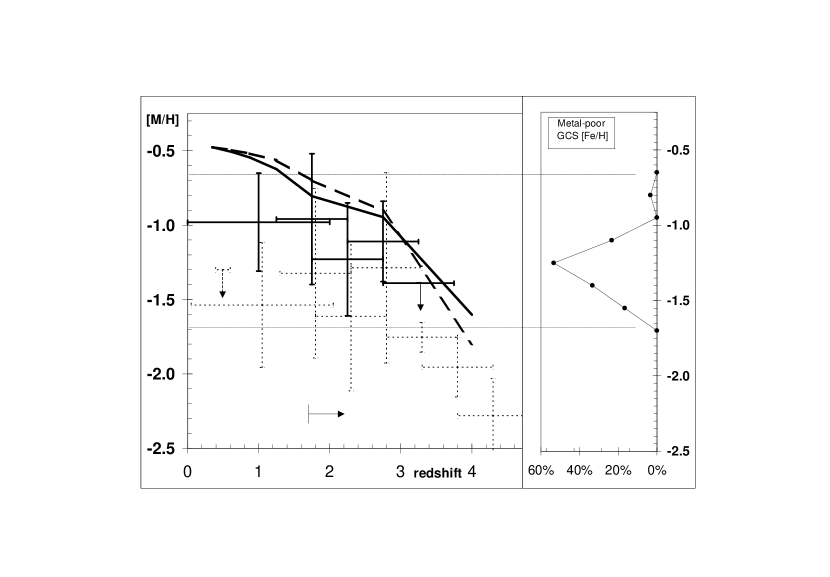
With the previous hypothesis that DLA systems can be connected to the progenitors of the metal-poor globular clusters, we take advantage of the available database of DLA observations, normalized to Anders et al. (1989) solar abundances : Log [Fe/H] and Log [Zn/H], to study the chemical evolution of these objects with redshift. However, [Fe/H] may not be a reliable estimate of the metallicity of DLA systems, since some Fe may be locked up in dust and result in biased [Fe/H] measurements. Pettini et al. (1997) showed that [Zn/H] is a more reliable estimator because it essentially measures the metallicity independently of dust depletion. The [Zn/H] and [Fe/H] variations as a function of the redshift (Table 3) are plotted in Fig. 5. We use the column-density weighted abundances : where (M = Fe or M = Zn) and the associated standard deviations as defined in Pettini et al. (1997).
The average values and for the two complete samples, give over the whole sample. We do not normalize the [Fe/H] to the [Zn/H] values since it remains unclear whether is constant with redshift. A similar trend of decreasing metallicity with redshift appears both for [Fe/H]DLA and [Zn/H]DLA. The possibility that part of this trend is caused by a fraction of high redshifts DLA systems missed because of dust is investigated and ruled out by Pei & Fall (1995) (but see also Prochaska & Wolfe, 2000). The steeper slope at z 2.8 has been interpreted as the fast formation of metals after the dark age (Pettini et al., 1997; Lu et al., 1996).
In order to verify whether the above trend of decreasing metallicity with increasing redshift is supported by other evidence, we further compute the evolution of the metallicity of the universe with the redshift. We use the star formation evolution of (Steidel et al., 1999) and also consider an alternative scenario between z = 1 and 3 from sub-mm data (Barger et al., 1999). The second scenario implies a higher metal production at z 3 and a lower metal production at z 3. The expected metallicity is computed following Pettini et al. (1997) except that the values are normalized to give a global metallicity in the present-day Universe Z = 1/3 Z⊙ (Renzini, 1999). As noticed by (Pettini et al., 1997), the metal production is deduced from the radiation essentially emitted by massive stars. To compare these values with direct DLA metallicity, we need to correct them using [/Fe] (Boesgaard et al., 1999). In our considered metallicity range ([Fe/H]), this value is found approximately constant (Clementini et al., 1999). The resulting curves were added in Fig. 5.
On the one hand, the comparison of DLA and globular cluster system metallicities is direct; both are observables. On the other hand, a number of assumptions have been used to estimate the metal production in the Universe from the LBGs. Consequently, even if these latter curves may be used as an important check of the DLA metallicity trend, we need to rely on the latter to settle our conclusions.
5.3 A redshift range for the formation of the oldest globular clusters
The chemical evolution of DLA systems is below the lower limit for our metal-poor globular clusters at z 4. The conclusion suggested by these data is that the old globular cluster formation occurred at z 4 for the adopted cosmology.
Steidel et al. (1999) found that the total integrated UV luminosity at z 3 is of the same order as that at z 4 suggesting a similar stellar formation in the two redshift ranges. However, an interesting point to stress is that a small number of star-forming galaxies are observed at redshifts z 4 (e.g. Dey et al., 1998; Spinrad et al., 1998; Hu et al., 1999). The observed signal-to-noise ratio of these observations is low and we have only a very limited information on the galaxies. However, a preliminary conclusion is that those few galaxies may be in the very early stages of their formation. Nevertheless, observations of the bulk of high redshift ellipticals are consistent with a formation at redshifts of the order of z to 4, while a formation at z 2 and z 5 appears to be ruled out (Treu & Stiavelli, 1999; Menanteau et al., 1999) but see Jimenez et al. (1999) for an alternative. To date, the detection of z 4.5 star-forming galaxies is still anecdotal and most of the stellar formation is observed below this redshift. The results presented in this paper brings an additional argument to this hypothesis.
6 Conclusion
The mean metallicity of metal-poor globular clusters is approximately constant in all galaxies and environments, with no significant dependence of galaxy size of metallicity. This argues for a formation of all metal-poor globular clusters in very similar gas fragments. Further, it suggest either a very homogeneous metallicity of the initial gas out of which old metal-poor globular clusters formed, and/or very similar self-enrichment processes of the clouds. Self-enrichment, however, is unlikely to play an important role during the formation of clusters, (e.g. Ashman & Zepf, 1998; Nakasato et al., 2000), so that a very homogeneous metallicity in the initial fragments is favored.
A weak correlation (to be confirmed) of the mean metallicity of metal-poor globular cluster systems with the host galaxy metallicity/size might exist. This would suggest that (at least some of) the fragments in which the metal-poor globular clusters formed were already embedded in the dark halo of the final galaxy, rather than belonging to independent satellites.
We found high redshift DLA systems (having high column densities of neutral gas, and similar metallicities to the metal-poor clusters and “population II” objects) to be good candidates for the formation sites of metal-poor globular clusters. This would support a picture in which, at least some, DLA systems are gas clouds within protogalactic halos.
References
- Anders et al. (1989) Anders E., Grevesse N. 1989, Geoch. Cosmoch. Acta, 53, 157
- Armandroff (1989) Armandroff T.E., 1989, AJ 97, 375
- Armandroff & Zinn (1988) Armandroff T.E. & Zinn R. 1988, AJ 96, 92
- Ashman & Bird (1993) Ashman K.M., Bird C.M. 1993 AJ 106, 2281
- Ashman & Zepf (1998) Ashman K.M., Zepf S.E. 1998, Globular Cluster Systems, Cambridge University Press
- Ashman et al. (1994) Ashman K.M., Bird C.M., Zepf S.E. 1994 AJ 108, 2348
- Barger et al. (1999) Barger A.J., Cowie L.L., Sanders D.B. 1999, ApJ 518, 5
- Barmby et al. (2000) Barmby P., Huchra J.P., Brodie J.P., Forbes D.A., Schroder L.L. & Grillmair C.J. 2000, AJ 119, 727
- Boissé et al. (1998) Boissé P., Le Brun V., Bergeron J., Deharveng J.-M. 1998, A&A 333, 841
- Boesgaard et al. (1999) Boesgaard A.M., King J.R., Deliyannis C.P., Vogt S.S. 1999, A.J. 117, 492
- Brodie & Huchra (1991) Brodie J.P., Huchra J.P. 1991 ApJ 379,157
- Brodie et al. (2000) Brodie J.P., Larsen S.S., Kissler-Patig M. 2000, ApJL submitted
- Buonanno et al. (1998) Buonanno R., Corsi C. E., Zinn R. et al. 1998, ApJ 501, L33
- Caldwell et al. (1998) Caldwell N., Armandroff T.E., da Costa G.S., Seitzer P. 1998, AJ 115,535
- Chaboyer et al. (1998) Chaboyer B., Demarque P., Kernan P.J., Krauss L.M. 1998, ApJ 494, 96
- Clementini et al. (1999) Clementini G., Gratton R.G., Carretta E., Sneden C. 1999, MNRAS 302, 22
- Côté et al. (1998) Côté P., Marzke R.O., West M.J. 1998, ApJ 501, 554
- Cohen et al. (1998) Cohen J.G., Blakeslee J.P., Ryshov A. 1998, ApJ 496, 808
- Dey et al. (1998) Dey A., Spinrad H., Stern D., Graham J.R., Chaffee F.H. 1998, ApJ 498, L93
- Dressler et al. (1987) Dressler A., Lynden-Bell D., Burstein D., et al. 1987, ApJ 313, 42
- Durell et al. (1996a) Durell P.R., Harris W.E., Geisler D., Pudritz R.E. 1996a, AJ 112, 972
- Durell et al. (1996b) Durell P.R., McLaughlin D.E., Harris W.E. , Hanes D.H. 1996b, ApJ 463., 543
- Feltzing & Gilmore (2000) Feltzing S., Gilmore G. 2000, A&A 355, 949
- Forbes et al. (1996) Forbes D.A., Franx M., Illingworth G.D., Carollo C.M. 1996, ApJ 467,126
- Forbes et al. (1997a) Forbes D.A., Brodie J.P., Grillmair C.J. 1997a, AJ 113, 1652
- Forbes et al. (1997b) Forbes D.A., Grillmair C.J., Smith R.C. 1997b, AJ 113, 1648
- Forbes et al. (1997c) Forbes D.A., Brodie J.P., Huchra J.P. 1997c, AJ 113, 887
- Gebhardt & Kissler-Patig (1999) Gebhardt K., Kissler-Patig M. 1999 AJ 118, 1526
- Geisler et al. (1996) Geisler D., Lee M.G., Kim E. 1996, AJ 111, 1529
- Golev & Prugniel (1998) Golev V., Prugniel P. 1998, A&AS 132, 255
- Haehnelt et al. (1996) Haehnelt M. G., Steinmetz M., Rauch, M. 1996 ApJ 465, L95
- Harris (2000) Harris W.E. 2000, in ”Lectures for the 1998 SAAS-FEE Advanced Course on Star Clusters” (Swiss Society for Astrophysics and Astronomy), in press, (http://physun.mcmaster.ca/ harris/WEHarris.html)
- Harris et al. (1992) Harris G.L.H., Geisler D., Harris H.C., Hesser J.E. 1992, AJ 104, 613
- Hilker et al. (1999) Hilker, M., Infante, L., and Richtler, T. 1999, A&A Suppl., 138, 55
- Hu et al. (1999) Hu E.M., McMahon R,G,m Cowie L.L. 1999, ApJ 522, L9
- Ibata et al. (1994) Ibata R, Gilmore G.F., Irwin M.J. 1994, Nat. 370,194
- Jimenez & Padoan (1998) Jimenez R., Padoan P. 1998, ApJ 498, 704
- Jimenez et al. (1999) Jimenez R., Friaca A.C.S., Dunlop J.S. et al. 1999, MNRAS 305, L16
- Katz et al. (1996) Katz N., Weinberg D.H., Hernquist L., Miralda-Escude J. 1996, ApJ 457, L57
- Kennicutt (1989) Kennicutt R.C. 1989, ApJ 344, 685
- Kinman (1959) Kinman T.D. 1959, MNRAS 119, 559
- Kissler-Patig et al. (1997a) Kissler-Patig M., Richlter T., Storm J., Della Valle M. 1997a, A&A 327, 503
- Kissler-Patig et al. (1997b) Kissler-Patig M., Kohle S., Hilker M. et al. 1997b, A&A 319, 83
- Kissler-Patig et al. (1998a) Kissler-Patig M., Forbes D.A., Minniti D., 1998a, MNRAS 298, 1123
- Kissler-Patig et al. (1998b) Kissler-Patig M., Brodie J.P., Schroder L.L, et al. 1998b, ApJ 115, 105
- Kobulnicky & Koo (2000) Kobulnicky H.A., Koo D. 2000, astro-ph/0008242
- Kundu (1999) Kundu A., 1999, PhD Univ. Maryland
- Kundu & Whitmore (1998) Kundu A., Whitmore B.C. 1998, AJ 116, 2841
- Kundu et al. (1999) Kundu A., Whitmore B.C., Sparks W.B. et al. 1999, ApJ 513, 733
- Lee et al. (1998) Lee M.G., Kim E., Geisler D. 1998, ApJ 115, 947
- Lowenthal et al. (1997) Lowenthal J.D., Koo D.C., Guzman R. et al. 1997, ApJ 481, 673
- Lu et al. (1996) Lu L., Sargent W.L.W., Barlow T.A., Churchill C.W., Vogt S.S. 1996, ApJS 107, 475
- Menanteau et al. (1999) Menanteau F., Ellis R.S., Abraham R.G., Barger A.J., Cowie L.L. 1999, MNRAS 309, 208
- Mighell et al. (1996) Mighell K.J., Rich R.M., Shara M., Fall S.M. 1996, AJ 111, 2314
- Minniti (1995) Minniti D. 1995, AJ 109, 1663
- Montegriffo et al. (1998) Montegriffo P., Bellazzini M., Ferraro F.R. et al. 1998, MNRAS 294, 315
- Nakasato et al. (2000) Nakasato N., Mori M., Nomoto K. 2000, ApJ 535, 776 astro-ph/0001333
- Neilsen & Tsvetanov (1999) Neilsen E.H., Tsvetanov Z.I. 1999, ApJ 515, L13
- Olsen et al. (1998) Olsen K.A.G., Hodge P.W., Mateo M. et al. 1998, MNRAS 300, 665
- Ortolani et al. (1995) Ortolani S., Renzini A., Gilmozzi R. et al. 1995, Nat. 377, 701
- Olszewski et al. (1996) Olszewski E.W., Suntzeff N.B., Mateo D. 1996, ARAA 34, 511
- Parmentier et al. (2000) Parmentier G., Jehin E., Magain P., Noels A., Thoul A.A. 2000, astro-ph0009477
- Pei & Fall (1995) Pei C., Fall S.M. 1995, ApJ 454, 69
- Pettini et al. (1997) Pettini M., Smith L.J., King D.L., Hunstead R.W. 1997, ApJ 486, 665
- Pettini et al. (1999) Pettini M., Ellison S.L., Steidel C.C., Bowen D.V. 1999, ApJ 510, 576
- Prochaska & Wolfe (1999) Prochaska J.X., Wolfe A.M. 1999 ApJS 121,3691
- Prochaska & Wolfe (2000) Prochaska J.X., Wolfe A.M. 2000, ApJ 533, L5
- Prugniel & Simien (1996) Prugniel P., Simien F. 1996, A&A 309, 749
- Puzia et al. (1999) Puzia T.H., Kissler-Patig M., Brodie J.P., Huchra J.P. 1999, AJ 118, 2734
- Renzini (1999) Renzini A. 1999, astro-ph/9902108
- Richtler (1994) Richtler T., 1994, Reviews in Modern Astronomy, Vol. 8, ed.G.Klarer, P.163
- Rosenberg et al. (1999) Rosenberg A., Saviane I., Piotto G., Aparicio A 1999, AJ 118, 2306
- Sarajedini et al. (1998) Sarajedini A., Geisler D., Harding P., Schommer R. 1998, ApJ 508, L37
- Searle & Zinn (1978) Searle L., & Zinn R., 1978, ApJ 225, 357
- Secker et al. (1995) Secker J., Geisler D., McLaughlin D.E., Harris W.E. 1995, AJ 109,1019
- Smith et al. (1998) Smith E.O., Rich R.M., Neill J.D. 1998, AJ 115, 2369
- Spinrad et al. (1998) Spinrad H., Stern D., Bunker A. et al. 1998, AJ 116, 2617
- Steidel et al. (1996) Steidel C.C., Giavalisco M., Adelberger K.L., Dickinson M. 1996, ApJ 462, L17
- Steidel et al. (1999) Steidel C.C., Adelberger K.L., Giavalisco M., Dickinson M., Pettini M. 1999, ApJ 519,1
- Suntzeff et al. (1992) Suntzeff N.B., Schommer R.A., Olszewski E.W., Walker A.R. 1992, AJ 104, 1743
- Testa et al. (1995) Testa V., Ferraro F.R., Brocato E., Castellani V. 1995, MNRAS 275, 454
- Treu & Stiavelli (1999) Treu T., Stiavelli M. 1999, AJ 524, L27
- Tully (1988) Tully R.B. 1998, Nearby Galaxies Catalogue, Cambridge University Press
- vandenBergh (1975) van den Bergh S. 1975, ARA&A 13,217
- Walker (1992) Walker A.R. 1992, AJ 104, 1395
- Wolfe et al. (1995) Wolfe A.M., Lanzetta K.M., Foltz C.B., Chaffee F.H. 1995, ApJ 454, 698
- Zepf & Ashman (1993) Zepf S.E., Ashman K.M. 1993, MNRAS 264, 611
- Zepf et al. (1995) Zepf S.E., Ashman K.M., Geisler D. 1995, ApJ, 443, 570
- Zinn (1985) Zinn R. 1985, ApJ, 293, 424
- Zinn (1993) Zinn R. 1993, ”Stellar Populations”, eds. C.A. Norman, A. Renzini and M. Tosi, Cambridge Univ. Press, p.73


| Galaxy | Type | (m-M)0 | MV | [Fe/H]mp | NGC | source | ||
|---|---|---|---|---|---|---|---|---|
| MW | Sbc | 15.0 | -21.3 | 0.90 | -1.61 | 0.34 | 90 | H00 |
| LMC | Sm | 18.7 | -18.4 | -1.68 | 0.32 | 12 | M96/T95/O98/S92/W92 | |
| Sgr | dSph | 17.1 | -1.90 | 0.10 | 2 | SRN98/M98 | ||
| Fornax | dE0 | 20.6 | -13.7 | -2.04 | 0.18 | 4 | B98 | |
| NGC147 | dE5 | 24.6 | -15.1 | -2.20 | 0.30 | 2 | M96 | |
| NGC185 | dE3 | 24.6 | -15.4 | -1.72 | 0.44 | 5 | M96 | |
| NGC205 | dE5 | 24.6 | -16.5 | -1.52 | 0.23 | 6 | M96 | |
| M31 | Sb | 24.6 | -21.8 | -1.54 | 0.10 | 95 | AB93 | |
| F8D1 | dE | 28.0 | -14.3 | -1.80 | 0.25 | 1 | C98 | |
| M33 | Scd | 24.5 | -19.4 | -1.64 | 0.30 | 2 | SGHS99 | |
| NGC584 | E4 | 31.7 | -21.4 | -1.30 | 0.25 | … | K99p | |
| NGC1023 | E/S0 | 30.0 | -21.3 | 1.02 | -1.16 | 0.25 | 65 | GK99 |
| NGC1380 | S0 | 31.1 | -19.3 | -1.40 | 0.26 | 180 | KP97b | |
| NGC1399 | E1/cD | 31.1 | -21.6 | 0.99 | -1.26 | 0.26 | 200 | O98 |
| NGC1404 | E1 | 31.1 | -21.1 | -1.60 | 0.15 | 372 | F97a | |
| NGC1427 | E5 | 31.3 | -20.4 | -1.56 | 0.25 | … | K99p | |
| NGC1439 | E1 | 31.8 | -20.4 | -1.33 | 0.25 | … | K99p | |
| NGC2434 | E | 30.9 | -20.1 | 0.98 | -1.36 | 0.25 | 23 | GK99 |
| NGC3115 | S0 | 30.2 | -21.3 | 0.96 | -1.36 | 0.15 | 64 | K98 |
| NGC3115DW1 | dE1.N | 30.2 | -17.7 | -1.16 | 0.30 | 59 | D96b | |
| VCC1254 | dE0.N | 31.0 | -16.4 | -1.45 | 0.30 | 22 | D96a | |
| VCC1386 | dE3.N | 31.0 | -16.9 | -1.45 | 0.30 | 17 | D96a | |
| NGC3311 | cD | 33.4 | -22.3 | 0.91 | -1.50 | 0.30 | B00 | |
| NGC3377 | E5-6 | 30.1 | -19.9 | -1.36 | 0.25 | … | K99p | |
| NGC3379 | E1 | 30.1 | -20.9 | -1.43 | 0.25 | … | K99p | |
| NGC3923 | E3 | 31.9 | -22.0 | -0.94 | 0.15 | 138 | Z95 | |
| NGC4278 | E1LIN | 31.1 | -21.0 | -1.46 | 0.25 | … | K99p | |
| NGC4365 | E2 | 31.4 | -21.9 | 0.95/1.04 | -1.46 | 0.25 | 160/85∗ | GK99/N99 |
| NGC4406 | E3/S0 | 31.0 | -22.2 | -1.30 | 0.25 | … | K99p | |
| NGC4458 | E0-1 | 29.9 | -18.1 | 0.83/none/none | -1.79 | 0.25 | 6∗ | N99/GK99/K99p |
| NGC4472 | E2 | 31.0 | -22.6 | 0.93/0.99/0.92 | -1.35 | 0.20 | 1154/282/… | G96, P99/N99/K99p |
| NGC4473 | E5 | 31.0 | -20.9 | 0.99/0.93 | -1.36 | 0.25 | 50∗/… | N99/K99p |
| NGC4478 | E2 | 31.4 | -20.3 | 0.99 | -1.26 | 0.30 | 53∗ | N99 |
| M87 | E0 | 31.0 | -22.4 | 0.96/0.98/0.95 | -1.26 | 0.25 | 296/70∗/382 | GK99/N99/K99 |
| NGC4486B | cE0 | 31.0 | -17.7 | -1.52 | 0.25 | … | K99p | |
| NGC4494 | E0 | 31.4 | -21.8 | 0.91 | -1.46 | 0.25 | 50∗/… | F96/K99p |
| NGC4526 | S0 | 31.0 | -21.4 | 0.88 | -1.68 | 0.25 | 28 | GK99 |
| NGC4550 | SB0 | 29.7 | -18.2 | 0.97/none/none | -1.33 | 0.25 | 17∗/… | N99/GK99/K99p |
| NGC4552 | E0 | 31.3 | -21.8 | 1.05/0.96 | -1.20 | 0.25 | 70∗/… | N99/K99p |
| NGC4594 | Sa | 30.7 | -23.1 | -1.20 | 0.30 | 378 | F97b | |
| NGC4621 | E5 | 31.1 | -21.6 | 1.06/0.98 | -1.17 | 0.25 | 75∗/… | N99/K99p |
| NGC4649 | E2 | 31.0 | -22.2 | 0.99/1.02/0.95 | -1.26 | 0.25 | 120∗/86/… | GK99/N99/K99p |
| NGC4660 | E6 | 30.9 | -19.9 | 0.99/0.93 | -1.36 | 0.25 | 20∗/… | N99/K99p |
| NGC5128 | E0p | 28.3 | -22.0 | -1.20 | 0.15 | 42∗ | H92 | |
| NGC5846 | E0 | 32.0 | -22.0 | 0.94/0.96 | -1.49 | 0.25 | 218 | GK99/F97b |
| NGC5982 | E3 | 32.9 | -21.7 | -1.26 | 0.25 | … | K99p | |
| IC1459 | E3 | 31.6 | -21.9 | …/0.97 | -1.20 | 0.25 | 70∗/… | F96/K99p |
References. — AB93: Ashman & Bird (1993); B00: Brodie et al. (2000); B98: Buonanno et al. (1998); C98: Caldwell et al. (1998); D96a: Durell et al. (1996a); D96b: Durell et al. (1996b); F96: Forbes et al. (1996); F97a: Forbes et al. (1997a); F97b: Forbes et al. (1997b); F97c: Forbes et al. (1997c); G96: Geisler et al. (1996); GK99: Gebhardt & Kissler-Patig (1999); H92: Harris et al. (1992); H00: Harris (2000); KP97b: Kissler-Patig et al. (1997b); K98: Kundu & Whitmore (1998); K99: Kundu et al. (1999); K99p: Kundu (1999); M96: Mighell et al. (1996); M98: Montegriffo et al. (1998); N99: Neilsen & Tsvetanov (1999); O98: Olsen et al. (1998); P99: Puzia et al. (1999); SGHS98 : Sarajedini et al. (1998); S95: Secker et al. (1995); S92: Suntzeff et al. (1992); SRN98: Smith et al. (1998); T95: Testa et al. (1995); W92: Walker (1992); Z95: Zepf et al. (1995)
Note. — The number of globular clusters used was not recorded by Kundu (1999) but it is typically of the order of 100 or more and never below 20.
| Galaxy | [km/s] | Mg2 | ||
|---|---|---|---|---|
| Milky Way | 0.55 | |||
| LMC | 0.55 | |||
| Sag | 11 4 | 0.55 | ||
| Fornax | 6 3 | 0.55 | ||
| NGC147 | 22 4 | 0.55 | ||
| NGC185 | 25 8 | 0.095 0.016 | 0.55 | |
| NGC205 | 20 5 | 0.080 0.008 | 0.52 | |
| M31 | 173 15 | 0.320 0.020 | 0.52 | |
| F8D1 | ||||
| M33 | 0.52 | |||
| NGC584 | 225 20 | 0.292 0.004 | 0.42 | |
| NGC1023 | 212 15 | 0.340 0.010 | 0.57 | |
| NGC1380 | 240 15 | 0.280 0.008 | 1.54 | |
| NGC1399 | 359 20 | 0.370 0.008 | 1.59 | |
| NGC1404 | 242 20 | 0.340 0.010 | 1.59 | |
| NGC1427 | 170 20 | 0.260 0.010 | 1.59 | |
| NGC1439 | 159 20 | 0.258 0.021 | 0.45 | |
| NGC2434 | 229 20 | 0.280 0.010 | 0.19 | |
| NGC3115 | 271 20 | 0.330 0.020 | 0.08 | |
| NGC3115DW1 | 29 10 | 0.208 0.039 | 0.08 | |
| VCC1254 | 41 15 | 3.31 | ||
| VCC1386 | ||||
| NGC3311 | 190 20 | 0.310 0.010 | ||
| NGC3377 | 143 20 | 0.290 0.004 | 0.49 | |
| NGC3379 | 221 20 | 0.337 0.006 | 0.52 | |
| NGC3923 | 241 15 | 0.320 0.020 | 0.40 | |
| NGC4278 | 251 20 | 0.311 0.010 | 1.25 | |
| NGC4365 | 269 15 | 0.330 0.030 | 2.93 | |
| NGC4406 | 246 20 | 0.334 0.007 | 1.41 | |
| NGC4458 | 101 20 | 0.240 0.010 | 3.21 | |
| NGC4472 | 303 20 | 0.340 0.010 | 3.31 | |
| NGC4473 | 179 15 | 0.320 0.010 | 2.17 | |
| NGC4478 | 144 15 | 0.260 0.020 | 3.92 | |
| M87 | 339 30 | 0.310 0.030 | 4.17 | |
| NGC4486B | 178 30 | 0.304 0.011 | 3.92 | |
| NGC4494 | 155 20 | 0.290 0.010 | 1.04 | |
| NGC4526 | 260 20 | 0.304 0.008 | 2.45 | |
| NGC4550 | 80 30 | 0.191 0.010 | 2.97 | |
| NGC4552 | 263 15 | 0.350 0.020 | 2.97 | |
| NGC4594 | 251 20 | 0.340 0.010 | 0.32 | |
| NGC4621 | 237 15 | 0.330 0.010 | 2.60 | |
| NGC4649 | 343 20 | 0.370 0.010 | 3.49 | |
| NGC4660 | 191 15 | 0.320 0.010 | 3.37 | |
| NGC5128 | 129 15 | 0.20 | ||
| NGC5846 | 250 20 | 0.340 0.010 | 0.84 | |
| NGC5982 | 250 10 | 0.302 0.008 | ||
| IC1459 | 311 20 | 0.340 0.010 | 0.28 |
| z | dz | Tmin | Tmax | DLA | [Fe/H]DLA | [Zn/H]DLA | # DLA | [Zn/Fe] | |||
|---|---|---|---|---|---|---|---|---|---|---|---|
| 0.45 | 0.1 | 5.1 | 5.9 | 1 (1) | -1.30 | ||||||
| 1.00 | 1.0 | 5.9 | 9.7 | 10 (1) | -1.54 | 0.42 | -0.98 | 0.33 | 4(0) | 0.56 | 0.53 |
| 1.75 | 0.5 | 9.7 | 10.5 | 5 (0) | -1.32 | 0.57 | -0.96 | 0.44 | 8(2) | 0.36 | 0.72 |
| 2.25 | 0.5 | 10.5 | 11.0 | 13 (0) | -1.61 | 0.50 | -1.23 | 0.38 | 12(6) | 0.38 | 0.63 |
| 2.75 | 0.5 | 11.0 | 11.4 | 4 (0) | -1.29 | 0.64 | -1.11 | 0.27 | 7(4) | 0.18 | 0.69 |
| 3.25 | 0.5 | 11.4 | 11.6 | 3 (0) | -1.75 | 0.10 | -1.39 | 3(3) | |||
| 3.75 | 0.5 | 11.6 | 11.8 | 2 (1) | -1.95 | 0.20 | |||||
| 4.25 | 0.5 | 11.8 | 12.0 | 3 (1) | -2.28 | 0.25 | |||||
| 2.45 | 4.1 | 5.1 | 12.0 | 47 (4) | -1.53 | 0.40 | -1.13 | 0.38 | 34(15) | 0.40 | 0.55 |