EGRET (GeV) Blazars
Abstract
The EGRET instrument on the Compton Gamma Ray Observatory (1991-2000) has positively detected high energy -ray emission from more than 67 active galaxies of the blazar class. The majority of the EGRET blazars are flat-spectrum radio quasars, which are characterized by inferred isotropic luminosities often as high as ergs s-1. The remainder are BL Lac objects, some of which have been detected at TeV energies ( GeV) by ground-based atmospheric Cherenkov telescopes. One of the remarkable characteristics observed in blazars is that the -ray luminosity often dominates the bolometric power in these sources. The detection of blazars by EGRET has undoubtedly been one of the highlights of the mission, and has forever impacted our understanding of the emission mechanisms in these objects. In this article, we summarize the properties of EGRET blazars, and review the constraints that the EGRET observations place on the various models of -ray production in these sources.
Introduction
The earliest surveys of the sky above 100 MeV were carried out by the COS-B satellite, which detected -rays from 3C 273 swan78 , the first extragalactic -ray source. At the time EGRET was launched in 1991, 3C 273 was the only extragalactic source known to emit -rays. The subject of -ray blazars got its first dramatic boost after the EGRET detection of several high energy -ray blazars mont95 ; mukh97 ; hart99 . EGRET discovered two remarkable characteristics of these sources: (1) In the majority of the blazars, the -ray emission dominates the bolometric power in the spectral energy distributions of these objects, and (2) blazars are characterized by short-time scale variabilities, often on the order of days to months.
Almost all the active galaxies detected by EGRET belong to the blazar-class of objects. Although the term “blazar” is not well-defined, it includes OVV quasars, BL Lac objects, and high polarization quasars (HPQs). These sources are characterized by emissions that include high radio and optical polarizations, strong variability at all wavelengths, and non-thermal, continuum spectra. Blazars detected by EGRET are radio-loud, flat-spectrum radio sources, with radio spectral indices for a flux density of . Several blazars have been observed to exhibit apparent superluminal motion (3C 279, 3C 273, 3C 454.3, PKS 0528+134, for example verm94 ), as evidenced from VLBI radio observations. EGRET observations of blazars are summarized in section I.
Three of the EGRET blazars (Mrk 421, Mrk 501, PKS 2155-304) have now been detected at TeV energies ( GeV) by ground-based atmospheric Cherenkov telescopes (ACTs) cata99 . These results have reinvigorated the -ray studies of blazars and have opened a new chapter in high energy astrophysics. As new ACTs with lower energy thresholds ( GeV ) become operational ongr98 , the high energy -ray studies of blazars will be conducted from the ground before the next generation satellite-based experiments like GLAST gehr99 or AGILE tava99 come on line. The future of high energy -ray blazar studies looks very promising. Some of the EGRET blazars observed at TeV energies are described in section II.
EGRET observations of blazars have helped constrain models of -ray emission mechanisms in these objects. The combination of high luminosity, short-term variability, and superluminal motion observed in blazars all bolster arguments for relativistic beaming in these objects. This is in agreement with the strong association of EGRET blazars with radio-loud flat-spectrum radio sources, with many of them showing superluminal motion in their jets. Most blazar models adopt a beaming paradigm. EGRET observations of blazars have enabled us to test several competing blazar emission models, most of which can be divided into two broad classes: “leptonic” and “hadronic.” It is generally believed that the broadband spectral energy distribution of blazars is due to energy losses of highly energetic particles via both synchrotron and Compton processes. A summary of the current blazar models and their implications, as pertaining to EGRET sources, is given in section III. The possible contributions of blazars to the diffuse extragalactic -ray background are discussed in section IV.
This article presents a snap shot of the current knowledge on EGRET-detected -ray blazars and selectively reviews some of the interesting highlights of the field. A comprehensive review is not possible, owing to the limited number of the allotted pages. Instead, the reader is referred to several recent articles which serve as excellent introductions to the exciting field of -ray blazars detected by EGRET mont95 ; mukh97 ; hart97 ; mukh98 .
I EGRET Observations
This article reviews the blazars listed in the third EGRET (3EG) catalog hart99 . These blazars were typically observed by EGRET for a period of about 2 weeks. Some observations were as short as 1 week, while others were as long as 3 to 5 weeks. EGRET’s threshold sensitivity ( MeV) for a single 2-week observation was photons cm-2 s-1. Details of the EGRET instrument, and data analysis techniques are given elsewhere thom93 ; hart99 .
Of the 271 sources detected by EGRET above 100 MeV, 67 are blazars detected with a high degree of confidence (a detection of at least a statistical significance at high galactic latitudes, and a detection for hart99 ). In addition, 27 other blazars are classified in the 3EG catalog as possible AGN hart99 . This is because their identification is questionable, either because the candidate source has a low radio flux, or lies outside the 95% error contour of the EGRET source. This makes blazars the second-largest class of EGRET sources, following the “unidentified” sources that have no known counterparts at other wavelengths. EGRET has detected blazars with redshifts ranging from 0.03 to 2.28.
The majority of the blazars detected by EGRET are classified as flat-spectrum radio quasars (FSRQs). The 46 FSRQs with strong identifications, listed in the 3EG catalog, are shown in Table 1. Of these, 0440-003, CTA 102, and 3C 454.3 are not strictly “flat-spectrum” in the range between 1.4 and 5 GHz, or 2.7 and 8 GHz. The BL Lac objects detected by EGRET are listed in Table 2. Not included in the table is Mrk 501, which is discussed in section II. The BL Lac objects are characterized by stronger polarization and weaker optical lines than FSRQs, which makes redshift determination more difficult. Other differences between FSRQs and BL Lac objects are discussed in the following sections. Not listed in either table are four flat-spectrum radio sources 0616-116, 0738+545, 1759-396, and 1908-201, also detected by EGRET. In addition, EGRET has detected -ray emission from Cen A, a radio galaxy, the only one seen to emit -rays sree99a .
| Name | Other Name | Flux | Photon | ||||
|---|---|---|---|---|---|---|---|
| ph cm-2s-1 | Spectral Index | ergs s-1 | |||||
| 0202+149 | 4C+15.05 | 147.95 | -44.32 | 0.405 | 0.0600 | ||
| 0208-512 | PKS | 276.10 | -61.89 | 1.003 | 1.4500 | ||
| 0336-019 | CTA026 | 188.40 | -42.47 | 0.852 | 1.4000 | ||
| 0414-189 | 213.90 | -43.29 | 1.536 | 2.1600 | |||
| 0420-014 | 194.88 | -33.12 | 0.915 | 0.6900 | |||
| 0430+285 | 170.48 | -12.58 | - | - | |||
| 0440-003 | NRAO190 | 197.39 | -28.68 | 0.844 | 0.9100 | ||
| 0446+112 | 187.86 | -20.62 | 1.207 | 2.7900 | |||
| 0454-463 | 252.40 | -38.40 | 0.858 | 0.0900 | |||
| 0459+060 | 193.99 | -21.66 | 1.106 | 0.2500 | |||
| 0458-020 | 201.35 | -25.47 | 2.286 | 1.1900 | |||
| 0528+134 | 191.50 | -11.09 | 2.060 | 7.8600 | |||
| 0827+243 | 199.91 | 31.69 | 2.046 | 2.0600 | |||
| 0836+710 | 143.49 | 34.79 | 2.172 | 0.9700 | |||
| 0954+556 | 159.55 | 47.33 | 0.901 | 0.1200 | |||
| 1156+295 | 4C+29.45 | 201.53 | 78.63 | 0.729 | 0.4300 | ||
| 1222+216 | 254.91 | 81.53 | 0.435 | 0.0400 | |||
| 1226+023 | 3C273 | 289.84 | 64.47 | 0.158 | 0.0100 | ||
| 1229-021 | 292.58 | 59.66 | 1.045 | 0.2400 | |||
| 1243-072 | 300.96 | 55.99 | 1.286 | 0.2900 | |||
| 1253-055 | 3C279 | 304.98 | 57.03 | 0.538 | 0.7800 | ||
| 1331+170 | 346.29 | 76.68 | 2.084 | 0.8100 | |||
| 1406-076 | 334.23 | 50.30 | 1.494 | 4.0000 | |||
| 1424-418 | 321.66 | 16.98 | 1.522 | 1.2600 | |||
| 1510-089 | 351.49 | 40.37 | 0.361 | 0.0300 | |||
| 1606+106 | 4C+10.45 | 23.51 | 41.05 | 1.226 | 0.9200 | ||
| 1611+343 | 55.44 | 46.29 | 1.401 | 0.9400 | |||
| 1622-297 | 348.67 | 13.38 | 0.815 | 2.7700 | |||
| 1622-253 | 352.28 | 16.37 | 0.786 | 0.4200 | |||
| 1633+382 | 4C+38.41 | 61.21 | 42.26 | 1.814 | 6.8000 | ||
| 1725+044 | 27.27 | 20.62 | 0.296 | 0.0200 | |||
| 1730-130 | NRAO530 | 12.00 | 10.57 | 0.902 | 0.4800 | ||
| 1739+522 | 79.37 | 32.05 | 1.375 | 0.6200 | |||
| 1741-038 | 22.19 | 13.42 | 1.054 | 0.4100 | |||
| 1830-210 | 11.92 | -5.50 | 1.000 | 0.4500 | |||
| 1933-400 | 358.65 | -25.23 | 0.966 | 0.3400 | |||
| 1936-155 | 23.95 | -17.12 | 1.657 | 2.8400 | |||
| 2022-077 | 36.72 | -24.40 | 1.388 | 2.5900 | |||
| 2052-474 | 352.56 | -40.20 | 1.489 | 0.9600 | |||
| 2209+236 | 81.83 | -25.65 | - | - | |||
| 2230+114 | CTA102 | 77.45 | -38.50 | 1.037 | 0.3500 | ||
| 2251+158 | 3C454.3 | 86.05 | -38.30 | 0.859 | 0.6500 | ||
| 2320-035 | 76.82 | -58.07 | – | 1.411 | 1.3800 | ||
| 2351+456 | 113.39 | -15.82 | 1.992 | 1.1200 | |||
| 2356+196 | 107.01 | -40.58 | 1.066 | 0.3100 |
| Name | Other Name | Flux | Photon | ||||
|---|---|---|---|---|---|---|---|
| ph cm-2s-1 | Spectral Index | ergs s-1 | |||||
| 0219+428 | 3C66A | 140.22 | -16.89 | 0.444 | 0.0500 | ||
| 0235+164 | OD+160 | 156.46 | -39.28 | 0.940 | 0.9500 | ||
| 0454-234 | 223.96 | -34.98 | 1.009 | 0.2500 | |||
| 0537-441 | 250.08 | -30.86 | 0.894 | 0.3300 | |||
| 0716+714 | 143.98 | 28.00 | 0.300 | 0.0200 | |||
| 0735+178 | 202.16 | 17.88 | 0.424 | 0.0400 | |||
| 0829+046 | 219.60 | 23.82 | 0.180 | 0.0100 | |||
| 0851+202 | OJ+287 | 207.19 | 35.43 | 0.306 | 0.0100 | ||
| 0954+658 | 145.78 | 43.11 | 0.368 | 0.0300 | |||
| 1101+384 | Mrk421 | 179.97 | 65.04 | 0.031 | 0.0002 | ||
| 1219+285 | ON+231 | 197.27 | 83.52 | 0.102 | 0.0015 | ||
| 1334-127 | 320.07 | 46.95 | 0.539 | 0.0500 | |||
| 1604+159 | 4C+15.54 | 29.18 | 43.84 | 0.357 | 0.0800 | ||
| 2032+107 | 56.12 | -17.18 | 0.601 | 0.0700 | |||
| 2155-304 | 17.45 | -52.23 | 0.116 | 0.0100 | |||
| 2200+420 | BLLac | 92.56 | -10.39 | 0.069 | 0.0024 |
I.1 Time Variability of EGRET Blazars
Blazars detected by EGRET have exhibited time variability in their -ray emission on timescales of months, to sometimes well under a day. Long term flux variability for EGRET blazars have been discussed earlier by several authors mont95 ; mukh97 . Figure 1 shows the flux history of the blazar PKS 0528+134 over a period of six years mukh99 . Each data point corresponds to the time averaged flux from the source during a viewing period (VP). Upper limits, at the 95% confidence level, are shown for any detections below the level. The figure demonstrates variability on the time scale of months. PKS 0528+134 is one of the most variable sources detected by EGRET. A dramatic flare was seen from the source in 1993 March when its flux was several times greater than that of the Crab mukh99 .
The flux variability of the blazars can be quantified by assigning a “variability index,” , where mcla96 . The quantity is the probability of observing or something larger from a distribution with degrees of freedom. The values were obtained by fitting the data similar to that shown in Figure 1 to a constant flux, using a least square fit method. The quantity has been used in the past to assess the strength of variability mcla96 ; mukh97 , following the somewhat arbitrary classification: non-variable - ; variable - ; uncertain - . Figure 1 shows a distribution of the variability indices of the FSRQs and BL Lac objects listed in tables 1 and 2. Although the sample of the blazars is small, the figure indicates that FSRQs are generally more variable than the BL Lac objects, in the EGRET energy range. Nearly 75% of all FSRQs may be classified as variable. In comparison, most of the unidentified EGRET sources are found to be non-variable, although recent studies have found short time scale variability in a few unidentified EGRET sources wall00 .
Although the study of short time scale variability is limited for most blazars by the small number of photons detected by EGRET during a single observation period, some EGRET blazars have been observed to flare dramatically on the time scale of days. For example, PKS 1622-297 exhibited a major flare during the observation in 1995. A flux increase by a factor of at least 3.6 was observed in a period of less than 7 hours matt97 . The peak flux observed was cm-2 s-1 ( MeV), which corresponded to an isotropic luminosity of ergs s-1matt97 . The characteristic time scale of variability, or the “doubling time,” can be somewhat arbitrarily defined as the shortest timescale during which the source flux is seen to change by a factors of 2. In the case of PKS 1622-297, the doubling time was less than 3.8 hr. A dramatic flare was also observed in the blazar 3C 279, in which the doubling time was hours wehr97 . Other blazars that have shown strong variability on timescales of 1 to 3 days in the past are PKS 0528+134, 3C 454.3, PKS 1633+382, 1406-076, and CTA26. Studies of fast variations of -ray emission in blazars using structure function analysis techniques have also been carried out for a few selected sources nand97 ; wagn97 .
The study of short time scale variability in blazars is important as they help to constrain the size of emission regions in these objects. A flux variation by a factor of two on an observed time scale limits the size of the emitting region to roughly using simple light travel time arguments. This implies that the blazar emission region is very compact.
I.2 Spectra of EGRET blazars


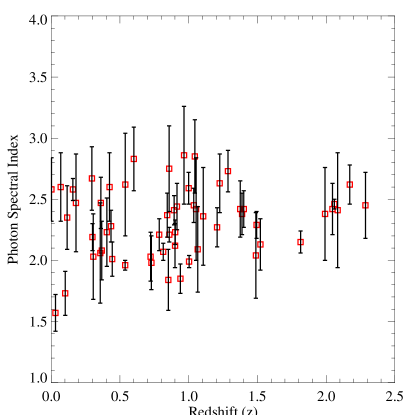
The spectra of blazars detected by EGRET cover the energy range from 30 MeV to 10 GeV and are well-described by a simple power-law model of the form photons cm-2 s-1 MeV-1, where the photon spectral index, , and the coefficient, , are the free parameters. The energy normalization factor, , is chosen so that the statistical errors in the power law index and the overall normalization are uncorrelated. Details of the EGRET spectral analysis techniques for blazars may be found elsewhere mont95 . Figure 2 shows the spectra of two blazars detected by EGRET hart99 . The spectral indices of all the blazars detected by EGRET are included in tables 1 and 2. The average photon spectral index in the EGRET energy band, assuming a simple power law fit to the spectrum, is . There is no evidence of a spectral cutoff for energies below 10 GeV. Figure 3 shows a plot of spectral indices versus redshift of all blazars detected by EGRET.
I.3 Luminosity of EGRET blazars
Tables 1 and 2 list the -ray luminosity of the blazars, calculated assuming isotropic emission. The -ray luminosity was estimated using the method described in mukh97 . Figure 3 shows a plot of the luminosity as a function of redshift for the FSRQs and BL Lac objects detected by EGRET. The solid line corresponds to the typical detection threshold for EGRET as a function of redshift, for relatively good conditions. As seen from the figure, the BL Lac objects (indicated with dark diamonds) are predominantly closer and have lower luminosities than the FSRQs.


II SEDs of EGRET blazars
II.1 FSRQs and Radio-selected BL Lac Objects
In order to decipher the underlying physics of the emission mechanisms in blazars, it is essential to study the broad band spectral energy distributions (SEDs) of these sources. Since EGRET first started detecting blazars, several multiwavelength campaigns have been organized to simultaneously observe these sources at different wavelengths (see shra97 for a recent review). Although these campaigns have proven difficult to organize, and the SEDs of blazars are often non-simultaneous or under-sampled, they have helped constrain blazars models.
The SED of the blazar 3C 279 from radio to -ray energies over 15 decades in energy for two different epochs wehr97 is shown in Figure 4. 3C 279 is one of the most intensely monitored of all EGRET blazars. The figure plots the quantity as a function of frequency, thus showing the relative amounts of power detected in each energy band. The overall SEDs of both FSRQs and BL Lac objects show two broad components: the synchrotron component and the inverse Compton (IC) component. In the case of FSRQs, as shown in Figure 4, the first peak is in the optical-IR band, while the second peak is in the MeV-GeV energy range. The figure demonstrates the dominance of the -ray luminosity over that at other wavebands. 3C 279 also shows considerable spectral variability, particularly in the -ray band, between different epochs. This has been found to be a characteristic feature of the FSRQs observed by EGRET.


II.2 Blazars detected at TeV Energies
Of the blazars detected by EGRET, only three have been seen at TeV energies ( GeV), all three being X-ray selected BL Lac (XBL) objects. These are Mrk 421, Mrk 501, and PKS 2155-304 week99 . Figure 4 shows the broad band SED of Mrk 501 measured during the outburst in 1997 May kata99 . Mrk 501 was detected first at TeV energies before it was recognized in the EGRET data. The strongest EGRET detection of the source occurred in 1996 May, when Mrk 501 was detected at 5.2 at energies above 500 MeV sree99b . Six high energy photons ( GeV) were observed from the direction of Mrk 501 in a 1-day interval, when the probability for this happening by chance was sree99b . A power-law fit to the EGRET data suggested a spectral index of for Mrk 501, and is the hardest known blazar spectrum at GeV energies sree99b .
The SED of Mrk 501 shown in Figure 4 is similar to that of other X-ray selected BL Lac objects. Unlike in FSRQs, the -ray peak in the SED of this high-frequency-peaked BL Lac (HBL) no longer dominates the spectrum, although it plays a very important part. The synchrotron peak of Mrk 501 is located in the X-ray band, while the Compton peak is in the GeV-TeV regime. In fact, a correlation between the peak frequencies of the synchrotron and IC components of the SED and the total energy density of the emitting region has been noted previously ghis98 . There appears to be evidence for a well-defined sequence in the properties of different blazar classes, namely, HBL, LBL (low frequency-peaked BL Lacs), HPQ (high-polarization quasars), and LPQ (low-polarization quasars). The trends in the observed properties are a decrease in frequencies of the synchrotron and inverse Compton peaks, and an increase in the power-ratio of the high and low energy spectral components along the sequence HBL LBL HPQ LPQ.
At a redshift of 0.031, Mrk 421 is the closest XBL seen by EGRET, and the first one to be detected by ground-based ACTs cata99 . Although it is a rather weak source at GeV energies, it has been persistently detected by EGRET liny92 . Above 30 MeV the source has a very hard photon spectral index of , and has a high energy peak in its SED at TeV energies.
III Gamma ray emission models
III.1 Leptonic models
It is generally believed that blazars are powered by accretion of matter on to a supermassive black hole, and that -ray emission originates in strongly beamed jets. The absence of intrinsic pair absorption in the observed blazar spectra strongly points to the fact that -ray emission is beamed radiation from the jet. A review of the constraints placed on AGN models from the -ray observations may be found in schl96 .
Leptonic jet models explain the radio to UV continuum from blazars as synchrotron radiation from high energy electrons in a relativistically outflowing jet which has been ejected from an accreting supermassive black hole blan79 . The emission in the MeV-GeV range is believed to be due to the inverse Compton scattering of low-energy photons by the same relativistic electrons in the jet. However, two main issues remain questionable: the source of the soft photons that are inverse Compton scattered, and the structure of the inner jet, which cannot be imaged directly. The soft photons can originate as synchrotron emission from within the jet (the synchrotron-self-Compton or SSC process), or from a nearby accretion disk, or they can be disk radiation reprocessed in broad-emission-line clouds (the external radiation Compton or the ERC process). A review on leptonic jet models and the relevant references may be found in boet99a .
Recently, Mukherjee et al. (1999) have applied a leptonic jet model to the SED of PKS 0528+134 observed by EGRET from 1991 to 1997 mukh99 . A combination of SSC and ERC models was used. A two-component model, in which the target photons are produced externally to the -ray emitting region, but also including an SSC component, was required to suitably reproduce the spectral energy distributions of the source. The analysis indicated that there is a trend in the observed properties of PKS 0528+134, as the source goes from a -ray low state to a flaring state. The model fits presented in mukh99 indicated that during the higher -ray states, the bulk Lorentz factor of the jet increased and the ERC component dominated the high-energy emission. The energies of the electrons giving rise to the synchrotron peak decreased, and the power-ratio of the -ray and low energy spectral components increased, as the source went from a low to a high -ray state.

In Figure 5 the fit results to two extreme states of PKS 0528+134 from mukh99 are compared. During the 1993 March observations, PKS 0528+134 was in its highest state ever, while the 1997 February data correspond to one of the lowest states of the source during the EGRET observations. The source exhibits considerable spectral variability between different epochs, a characteristic typical of many FSRQs observed by EGRET. The model calculations of the SED of PKS 0528+134 yielded a shift of the synchrotron peak frequency towards lower frequencies in a -ray bright state of the source, as has been predicted analytically boet99 . The spectral variability in PKS 0528+134 appears to arise from the different Doppler boosting patterns of the SSC and the ERC radiations. The relative contributions of the SSC and ERC cooling mechanisms seem to be related to the optical to -ray flux ratio from the source. The SSC mechanism plays a larger role if the source is in a low flux state. The ERC mechanism is the dominant cooling mechanism when the source is in a high -ray state.
Böttcher boet99 has demonstrated that the predicted peak shift is characteristic of a leptonic jet model in which the -ray emission is dominated by the ERC process during -ray flares, but does not depend on the physical details of such a model. This is particularly important, as the SEDs of most blazars are still quite poorly constrained observationally, and can in many cases be fitted equally well with several fundamentally different models.
A similar analysis was recently performed for the multi-epoch SEDs of 3C 279 hart00 , where the same general trend in the SEDs were observed as in the case of PKS 0528+134.
III.2 Hadronic models
In contrast to leptonic jet models where the jet consists of a hot plasma, in hadronic models the observed -ray emission is initiated by hot protons interacting with ambient gas or low-frequency radiation. In the proton induced cascade (PIC) model mann93 ; mann96 the relativistic protons interact electromagnetically and hadronically, i.e. through photo-pion production, with low frequency synchrotron radiation. Such a model would require extremely high luminosity in high energy protons in order to explain the observed TeV -ray fluxes in blazars. In contrast, in the synchrotron proton blazar models ahar00 ; muck00 , the high energy emission in the blazars detected at TeV energies is attributed to synchrotron radiation of extremely high energy protons. In such models, synchrotron radiation becomes the dominant energy loss mechanism of the high energy protons. Synchrotron proton blazar models have recently been applied to the case of the EGRET blazars Mrk 501 and Mrk 421 ahar00 ; prot00 .
IV Blazars and the extragalactic gamma-ray background
The precise origin of the extragalactic diffuse emission is not well-known and possibly includes contributions from diffuse origins as well as unresolved point sources. Recently, the evolution and luminosity function of the EGRET blazars was used to estimate the contribution to the diffuse extragalactic background chia98 . It was found that the evolution was consistent with a pure luminosity evolution. The redshift distribution of EGRET blazars was used to characterize the low end of the luminosity function better. The high end of the luminosity function was fixed by a non-parametric estimate chia98 . Using the lower limit of the de-evolved luminosity function, the -ray loud AGN contribution to the extragalactic -ray flux was estimated to be photons cm-2 s-1 sr-1. The sky-averaged flux contribution of identified EGRET blazars is photons cm-2 s-1 sr-1. Contribution to the diffuse background by unresolved blazars, therefore, was found to be photons cm-2 s-1 sr-1. The estimated extragalactic diffuse flux for MeV is photons cm-2 s-1 sr-1 sree98 . These calculations indicate that blazars cannot account for all of the diffuse extragalactic -ray background at the energies considered. Under this scenario, only 25% of the diffuse extragalactic emission measured by SAS-2 and EGRET can be attributed to unresolved -ray blazars. These findings are consistent with other studies muck98 , and contrary to estimates which assume a linear correlation between the measured radio and -ray fluxes and attribute a much larger contribution by blazars to the -ray background (e.g. stec96 ). These results lead to the exciting conclusion that other sources of diffuse extragalactic -ray emission must exist.
V Summary and Future Prospects
During its lifetime EGRET detected more than 67 blazars at energies above 100 MeV. This has been one of the most remarkable contributions from the mission. Only a handful of the EGRET sources have been detected with ground-based ACTs at energies above 250 GeV, although most of them have been observed kerr95 . This indicates that spectral changes must exist in the unexplored range between 50 and 250 GeV, possibly due to intrinsic absorption at the source or due to - pair production off the extragalactic background light (EBL) goul66 . In the future, it will be important to complement blazar studies by space-based experiments such as AGILE or GLAST, with ground-based instruments sensitive to the energy range 50 to 250 GeV. Ground-based instruments like STACEE and CELESTE with energy thresholds lower than 250 GeV are currently operational and well-suited to the study of several northern hemisphere AGN. Other experiments like VERITAS, HESS, MAGIC and CANGAROO III will soon come online. A review of these experiments, and a few others, and the relevant references may be found in ongr98 ; week99 .
I wish to thank M. Böttcher, R. C. Hartman, P. Sreekumar, for providing some of the data and figures presented here and at the Heidelberg 2000 conference. This research was supported in part by the National Science Foundation and the Research Corporation.
References
- (1) Swanenburg, B. N., et al., Nature, 275 (1978) 298.
- (2) C. von Montigny, et al., ApJ, 440 (1995) 525.
- (3) R. Mukherjee, et al., ApJ, 490 (1997) 116.
- (4) R. C. Hartman, et al., ApJ, 123 (1999) 79.
- (5) R. C. Vermeulen & M. H. Cohen, ApJ, 430 (1994) 467.
- (6) M. Catanese & T. C. Weekes, PASP review, astro-ph 9906501 (1999).
- (7) R. A. Ong, Phys. Rep., 305 (1998) 95.
- (8) N. Gehrels & P. Michelson, APh, 526 (1999) 297.
- (9) M. Tavani, et al., A&AS, 138 (1999) 569.
- (10) R. C. Hartman, et al., AIP Conf. Proc. 410 (1997) 307.
- (11) R. Mukherjee, in “Observational Evidence for Black Holes in the Universe,” ed. S. K. Chakrabarti (1999) 215, Kluwer Academic Publishers.
- (12) D. J. Thompson, et al., ApJS, 102 (1995) 259.
- (13) P. Sreekumar, et al., APh, 11 (1999) 221.
- (14) R. Mukherjee, et al., ApJ, 527 (1999) 132.
- (15) M. A. McLaughlin, et al., ApJ, 473 (1996) 763.
- (16) P. Wallace, et al., ApJ, 540 (2000) 184.
- (17) J. R. Mattox, et al., ApJ, 476 (1997) 692.
- (18) A. Wehrle, et al., ApJ, 497 (1998) 178.
- (19) G. Nandikotkur, et al., AIP Conf. Proc. 410 (1997) 1361.
- (20) S. J. Wagner, C. von Montigny, M. Herter, AIP Conf. Proc. 410 (1997) 1457.
- (21) C. R. Shrader & A. E. Wehrle, AIP Conf. Proc. 410 (1997) 328.
- (22) R. Sambruna, (1999), Proc. of the GeV - TeV Astrophysics International meeting, Snowbird, Utah; astro-ph/9912129.
- (23) G. Fossati, et al., MNRAS, 299 (1998) 433.
- (24) G. Ghisellini et al., MNRAS, 301 (1998) 451.
- (25) C. M. Urry, APh, 11 (1999) 159.
- (26) T. C. Weekes, (2000), Proceedings of the International Symposium on High Energy Gamma-Ray Astronomy, Heidelbergl; astro-ph/0010431.
- (27) J. Kataoka, et al., ApJ, 514 (1999) 138.
- (28) P. Sreekumar, et al., AIP Conf. Proc. 510 (1999) 318.
- (29) Y. C. Lin, et al., ApJ, L401 (1992) 61.
- (30) R. Schlickeiser, Space Sci. Rev., 75 (1996) 299.
- (31) R. D. Blandford, & A. Königl, ApJ, 232 (1979) 34
- (32) M. Böttcher, (1999) Proc. of the GeV - TeV Astrophysics International meeting, Snowbird, Utah; astro-ph/9909179.
- (33) M. Böttcher, ApJ, L515 (1999) 21
- (34) R. C. Hartman, et al., (2000), ApJ, submitted.
- (35) K. Mannheim, A&A, 269 (1993) 67.
- (36) K. Mannheim, Space Sci. Rev., 75 (1996) 331.
- (37) F. A. Aharonian, New Astronomy, 5 (2000) 377.
- (38) A. Mücke & R. Protheroe, APh, accepted (2000); astro-ph/0004052.
- (39) R, Protheroe & A. Mücke, astro-ph/0011154.
- (40) J. Chiang, & R. Mukherjee, ApJ, 496 (1998) 752.
- (41) P. Sreekumar, et al., ApJ, 494 (1998) 523.
- (42) A. Mücke & M. Pohl, AIP Conf. Proc. 410 (1997) 1233.
- (43) F. W. Stecker & M. H. Salamon, ApJ, 464 (1996) 600.
- (44) A. D. Kerrick, et al., ApJ, 452 (1995) 588.
- (45) R. J. Gould & G. Schreder, Phys. Rev. Lett., 16 (1966) 252.