EXTREME ULTRAVIOLET EMISSION IN THE FORNAX CLUSTER OF GALAXIES
Abstract
We present studies of the Extreme Ultraviolet (EUV) emission in the Fornax cluster of galaxies; a relatively nearby well-studied cluster with X-ray emitting cluster gas and a very large radio source. We examine both the large-scale ( size of the X-ray emitting cluster gas), and the small-scale ( arc min) emission. We find that this cluster has large-scale diffuse EUV emission. However, at the sensitivity level of the existing EUVE data, this emission is due entirely to the low energy tail of the X-ray emitting gas. We have also examined small-scale structures in raw EUVE images of this cluster. We find that small-scale irregularities are present in all raw Deep Survey images as a result of small-scale detector effects. These effects can be removed by appropriate flat-fielding. After flat-fielding, the Fornax cluster still shows a few significant regions of small-scale EUV enhancement. We find that these are emission from stars and galaxies in the field. We find that at existing levels of sensitivity, there is no excess EUV emission in the cluster on either large or small scales.
1 Introduction
The Fornax cluster (Abell S 373) is a relatively poor cluster at a distance 25 Mpc. It is well studied in the X-ray, radio, and optical bands. It contains the radio galaxy Fornax A which is well known for its giant radio lobes that extend almost a degree across the sky. The brightest optical galaxy in the group is NGC 1399; an E1 Galaxy located near the center of the cluster. The cluster has an associated X-ray emitting gas that has been studied by a number of investigators, most recently by Jones et al. 1997. They find the cluster gas has a mean temperature of 1.3 keV and a heavy element abundance of 0.6 with respect to solar. The cluster X-ray emission is 36 arc minutes in diameter roughly centered on NGC 1399.
We studied the Fornax cluster in the hope that it might shed light on the underlying source mechanism of the EUV emission found in some clusters of galaxies. We were particularly interested in this cluster since Berghöfer et al. (2000a) showed that the jet in M87 may have activated the EUV emission in the Virgo cluster. Although Fornax A is well away from the cluster center and was not in the field covered by our observation, we entertained the possibility that this radio source might be activating processes in the central part of the cluster. Throughout this paper we assume a Hubble constant of 50 km s-1 Mpc-1 and = 0.5.
2 Data and Analysis
The Fornax cluster was observed from August 29th through September 2nd, 1998. During this period, 104 ks of data were obtained. The cluster center was placed about 6 arcmin away from the known dead spot of the detector.
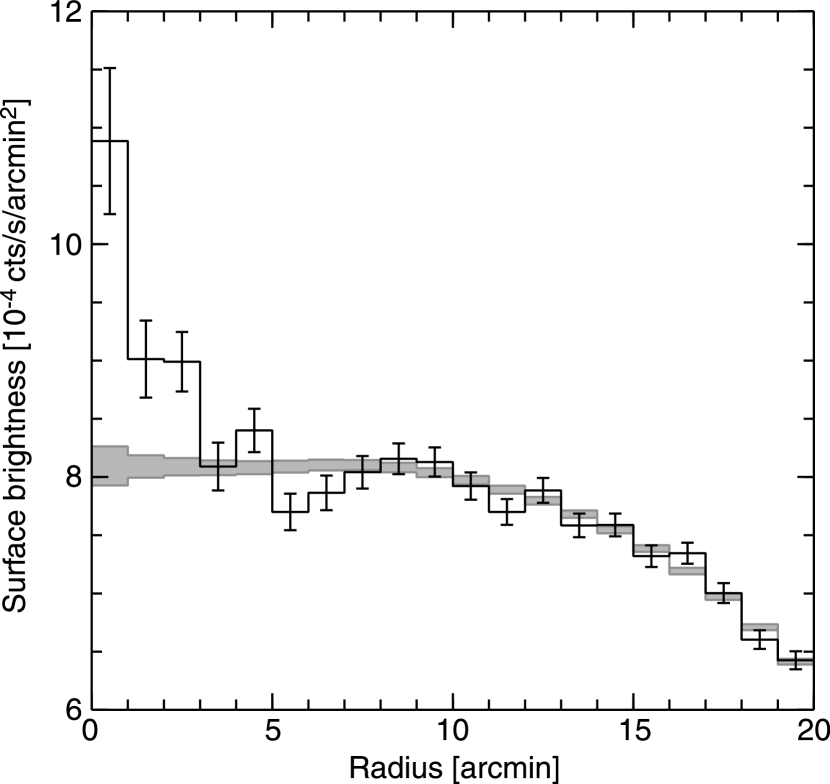
The reduction of the data was carried out with the EUVE package built in IRAF. We employed the analysis methods described in detail in Bowyer, Berghöfer and Korpela 1999. (See Berghöfer, Bowyer, and Korpela 2000b for a definitive discussion of the validity of these procedures). Briefly, corrections for dead time and telemetry limitations were applied to the data set and a raw EUV image was produced. A flat non-photonic background determined from highly obscured regions at the outer most parts of the field was subtracted from this image. We then computed the azimuthally averaged radial emission profile of the raw data centered on the cluster center. In Figure 1 we show this profile. We also show the azimuthally averaged radial profile of the telescope sensitivity map (or flat-field) constructed from 788 ks of blank field observations. The flat-field profile and its statistical errors are shown as gray shaded regions. As can be seen from a comparison of these data sets, no EUV emission is detected at radii larger than 5 arcmin and the detection between 4 and 5 arcmin is marginal at best. The statistical uncertainties in the flat-field are small because of the large number of counts in this data set.
We determined the EUV contribution of the low energy tail of the X-ray emitting cluster gas by analyzing 53,100 seconds of ROSAT PSPC archival data on this cluster. A reanalysis of this data using an accurate Galactic hydrogen column and appropriate interstellar absorption was necessary to obtain the correct EUV emission from the cluster, although the use of these improved parameters do not affect previous X-ray cluster gas measurements. We used the temperature of the X- ray gas as obtained by Jones et al. 1997 and employed the MEKAL plasma code to derive the ROSAT PSPC to EUVE DS counts conversion factors for each separate radial bin. The Galactic hydrogen column employed was N (H) = cm-2 (Murphy et al. 2000). The ISM absorption we employed is described in detail in Bowyer et al. 1999. This reference includes an extensive discussion of the necessity of employing an improved EUV ISM absorption cross section in the analysis of EUVE data.
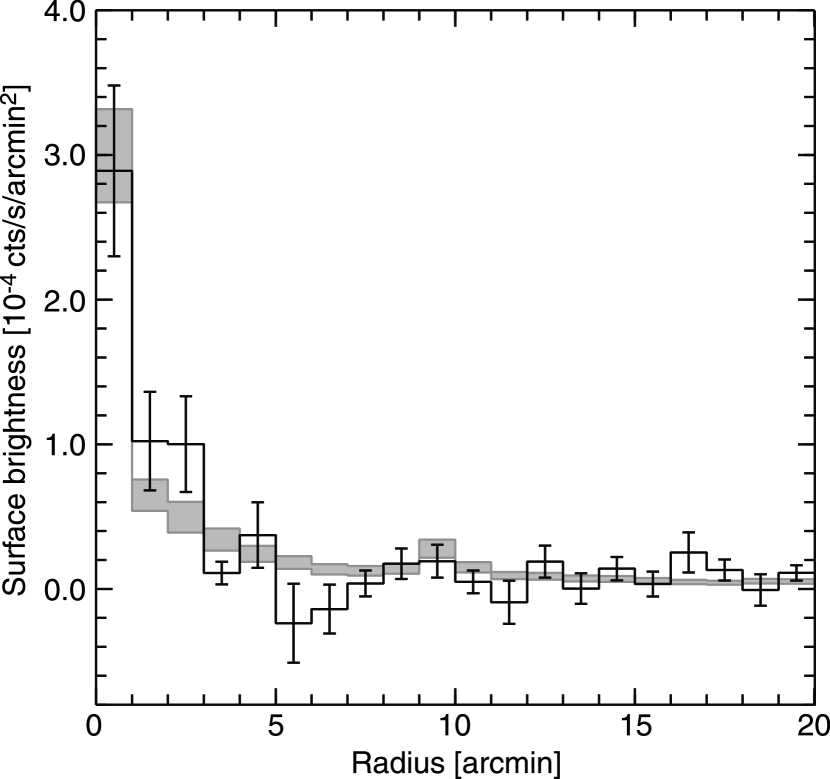
We established that the ROSAT PSPC to EUVE Deep Survey counts conversion factor fell between 220 (kT = 0.88 keV) and 125 (kT = 1.32 keV). We estimate the uncertainties in these values to be +/- 20%. Employing these values and using the azimuthally averaged radial X-ray emission profile derived from the PSPC hard energy band (0.5-2.4 keV), we derived upper and lower limits for the EUV emission from the X-ray emitting gas in the EUVE Deep Survey bandpass. In Figure 2 we show the EUV emission from the X-ray emitting gas as shaded regions with uncertainties in this emission indicated by the size of the shaded bin. We also show the EUV emission in the cluster as derived from the subtracting the flat-field shown in Figure 1 from the raw Fornax data shown in this figure. The errors in the signal and flat-field have been added in quadrature. The result shows that all the EUV flux in the cluster (at the sensitivity level of this observation) is produced by the X-ray cluster gas.
Using a 15.3 ks ROSAT observation of the Fornax cluster, Rangarajan et al. (1995) concluded that a soft X-ray excess was needed to fit the data. Their proposal of a K thermal component with an HI column density of cm-2 would produce an EUVE count rate of s-1. This compares with the total emission we measure of s-1 and the expected count rate due to the X-ray emitting gas of s-1. There is no evidence in the EUVE data that this excess emission is present, although we can only exclude its existence at the 80% confidence level. Jones et al (1997) carried out an extensive analysis of the Fornax cluster with a substantially longer ROSAT exposure of 54 ks (27.8 ks usable). They concluded that no soft excess was present, but a higher surface brightness was manifest in the innermost region. They suggested this was the result of a central cooling flow. Similar effects have been found in other clusters with cooling flows, and this is now the generally accepted explanation for this effect.
A detailed examination of the raw EUV image showed small-scale, arc minute, regions which deviate substantially from the mean. If these features were intrinsic to the cluster this would provide important information on the EUV cluster excess phenomenon. Because of the importance of the possibility that such structures are present in one or more clusters, we have examined the small-scale structure we found in the Fornax image in detail.
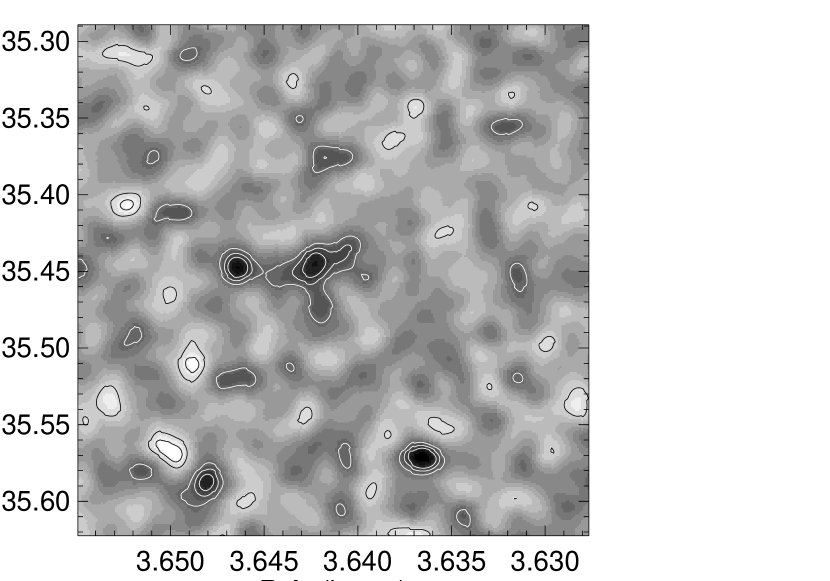
The pixel scale of our Fornax data set was 4.6 arc seconds. We smoothed this data in order to increase the number of counts in individually resolved features using a 1 arc minute FWHM Gaussian; this is about the 90% included energy width of the EUVE DS Telescope. We then subtracted our flat-field, similarly smoothed, from this image. The resultant image is shown in Fig. 3. The data in this image shows obvious deviations, both greater and less than the mean.
We carried out a variety of tests to determine if these deviations were statistically significant, and to determine whether or not they were unique to the Fornax cluster. To this end we examined both our 104 ks of Fornax cluster data, and a number of blank field data sets. Hardcastle 2000 (and references therein) has shown that extreme care must be used in determining the validity of features in an image that has been smoothed as described. The statistics in the smoothed image are neither Poissonian (because of the smoothing), nor Gaussian (because of the small number of counts in each cell). Hardcastle points out that one cannot simply determine the r.m.s. dispersion of an image after smoothing, multiply by n, add the mean, and call the resulting contour level “”.
Hardcastle points out that there is no analytic solution to the problem of establishing the statistical significance of a data set after smoothing. Hardcastle describes a Monte Carlo procedure that gives valid results. A field of simulated Poisson noise with the same bin size as the true data set is convolved with a Gaussian used with this data, and the statistical uncertainty levels are derived directly from the distribution of the resulting noise. An “equivalent” contour is defined as the contour that includes all but 0.135% of the data. Contours of other significance levels are defined in an analogous manner.
Following these procedures, we carried out a Monte Carlo simulation of Poisson noise in an empty field to determine the expected fraction of the field exceeding various levels of significance. The results of this simulation are shown in Column 1 of Table 1. Given that this data set is used to define these levels, they precisely match their respective statistical level. For comparison we also show in Column 2 the expected deviations (at these equivalent sigma levels) as calculated from Poisson statistics. These are clearly different, confirming the work of Hardcastle. In Column 3 we show the fraction of regions in the Fornax field with these statistical significance levels. The Fornax image shows more positive deviations than would be present by chance.
To further evaluate these fluctuations, we examined a number of blank field data sets. In Column 1 of Table 2 we show the fraction of the field exceeding various levels of significance in a set of 205 ks of blank field data (set 1). In this column we list the results for the blank field data after subtraction of the mean. There are substantial regions showing statistically significant structure in this raw data set. In Column 2 we show the results after subtraction of an independent set of 425 ks of blank field data (set 2) scaled in the same manner used with the cluster data. This subtraction provides a flat-fielded image of the set 1 blank field data. In Column 3 we show the Monte Carlo simulation of smoothed Poisson noise (reproduced here from Column 1 of Table 1 for the convenience of the reader.) The fluctuations in the flat-fielded blank field data are consistent with the Monte Carlo simulation of smoothed Poisson noise.
3 Discussion and Conclusions
The data displayed in Figure 1 shows the Fornax cluster exhibits large-scale diffuse EUV emission. However, the results displayed in Figure 2 show this emission is due entirely to the low energy tail of the X-ray emitting gas and that there is no detectable excess EUV flux in the central region of the cluster. The Fornax A radio source is not activating EUV emission in the central part of the cluster at the sensitivity level provided by the existing data.
The question as to what activates the production of large-scale EUV emission in some cluster of galaxies remains unanswered. A major factor limiting this inquiry is that few of the sources that have been studied in an appropriate manor have been found to exhibit this emission, hence few clues are available as to the nature of the underlying source mechanism(s). Excess EUV emission is clearly present in the Coma cluster (Bowyer et al. , 1999, Korpela et al. , in progress). It is also present in the Virgo cluster (Berghöfer et al. 2000a). Intriguingly, the character of the emission in the Virgo cluster emission is quite different than that in the Coma cluster. The only generalization that can be made from a study of the emission in these two clusters is that the emission is not the product of a gravitationally bound gas. Excess EUV emission has been claimed to have been detected in Abell 1795 (Mittaz et al. 1998) and Abell 2199 (Lieu et al. 1999). However, these authors used a theoretically derived flat flat-field in the analysis of these clusters which is now acknowledged by all researchers to be inappropriate. An appropriate analysis of Abell 1795 and Abell 2199 (Bowyer et al. 1999) does not show excess EUV emission.
We next discuss the small-scale structure observed in the raw Fornax image. Our analysis of blank field data shows that any field in which a constant level has been subtracted from the raw data will show a substantial number of small-scale features. These will be positive, or negative, or a mix, depending upon the numerical value of the constant level which has been subtracted. However, a comparison of the flat-fielded blank field data in Column 2 of Table 2 with the true significance levels shown in Column 3 show the fluctuations in a correctly flat-fielded blank field image are consistent with random noise.
We turn now to the question of small-scale structure in the correctly flat-fielded Fornax image. Most of the small-scale features seen in the raw data are no longer present, consistent with our demonstration that most of this structure is due to detector effects. However, a few regions with statistically significantly positive deviations are present even after appropriate flat-fielding has been carried out. The large-scale feature in the raw EUVE data is closely aligned with the X-ray emitting cluster gas, and is clearly due to the EUV emission of this gas. It can be eliminated by subtracting a properly scaled X-ray image. The next most significant features have widths the point spread function of the Deep Survey Telescope; they are associated with known galaxies and an unnamed star, and have nothing to do with intrinsic cluster emission. It is highly likely that the few remaining enhancements in this field are also due to galaxies in the Fornax cluster or to unidentified field stars. The negative fluctuations are consistent with their being the result of chance alignments of random fluctuations in either the Fornax data set or the background data set. We conclude there is no evidence for small-scale EUV enhancements or deficits in the Fornax cluster.
Finally, we emphasize that investigators of diffuse emission with EUVE (or other spacecraft) should be aware of the complexities in evaluating apparent small-scale fluctuations in the raw data set.
4 Acknowledgments
This work was supported in part by NASA cooperative agreement NCC5-138 and an EUVE Guest Observer Mini Grant. TWB was supported in part by a Feodor- Lymen Fellowship of the Alexander-von-Humboldt-Stiftung. We thank the anonymous referee for useful comments which greatly improved this paper.
References
- (1) Berghöfer, T.W., Bowyer, S., & Korpela, E.J. 2000a, ApJ, 535,615
- (2) Berghöfer, T.W., Bowyer, S., & Korpela, E.J. 2000b, ApJ, in press
- Bowyer et al. (1999) Bowyer, S., Berghöfer, T.W., & Korpela, E.J. 1999, ApJ, 526,592-598
- Ekers et al. (1989) Ekers, R. D., Wall, J.W., Shaver, P.A., Goss, W.M., Fosbury, R.A.E., Danziger,I.J., Moorwood, A.F.M., Malin, D.F., Monk, A.S, & Ekers, J.A. 1989, MNRAS, 236, 737-777
- Geldzahler & Fomalont (1984) Geldzahler, B. J., & Fomalont, E. B. 1984, AJ, 89, 1650
- Hardcastle (2000) Hardcastle, M.J. 2000, A&A, 357, 884.
- Korpela et al. (2000) Korpela, E.J., Bowyer, S., & Berghöfer T.W. 2000, in prep.
- Lieu et al. (1999) Lieu, R., Bonamente, M., & Mittaz, J. 1999 ApJ, 517, L91
- Jones et al. (1997) Jones, C., Stern, C., Forman, W., Breen, J., David, L., Tucker, W., & Franx, M. 1997, ApJ, 482, 143-155
- Mills (1954) Mills, B.Y. 1954, The Observatory, 74, 248
- Mittaz et al. (1998) Mittaz, J., Lieu, R., & Lockman, F. 1998, ApJ 498, L17
- Murphy et al. (2000) Murphy, E., Sebach, K., & Lockman, F. 2000, ApJS in press
- Rangarajan et al. (1995) Rangarajan, F.V.N., Fabian, A.C., Forman, W.R., & Jones, C. 1995 MNRAS, 272, 665.
- Robertson & Roach (1990) Robertson, J. & Roach, G. 1990, MNRAS, 247, 387-399
- Wade (1961) Wade, C.M. 1961, Pub. N.R.A.O., 1, 99
| Fraction of Field Exceeding Significance Levels | |||
|---|---|---|---|
| Monte Carlo Simulation | Poisson Statistics | Fornax Field | |
| 0.00003 | 0.003 | 0.003 | |
| 0.0013 | 0.010 | 0.007 | |
| 0.023 | 0.066 | 0.031 | |
| 0.159 | 0.228 | 0.161 | |
| 0.159 | 0.217 | 0.173 | |
| 0.023 | 0.062 | 0.024 | |
| 0.0013 | 0.010 | 0.0019 | |
| Fraction of Field Exceeding Significance Levels | |||
|---|---|---|---|
| Blank Field 1-Mean | Blank Field 1-Blank Field 2 | Monte Carlo Simulation | |
| 0.0000 | 0.0000 | 0.00003 | |
| 0.005 | 0.0010 | 0.0013 | |
| 0.074 | 0.025 | 0.023 | |
| 0.267 | 0.159 | 0.159 | |
| 0.245 | 0.162 | 0.159 | |
| 0.094 | 0.024 | 0.023 | |
| 0.025 | 0.0018 | 0.0013 | |
| 0.010 | 0.0007 | 0.00003 | |