The redshifts of bright sub-mm sources
Abstract
One of the key goals in observational cosmology over the next few years will be to establish the redshift distribution of the recently-discovered sub-mm source population. In this brief review I discuss and summarize the redshift information which has been gleaned to date for the bright sub-mm sources which have been uncovered via the six main classes of survey performed with SCUBA on the JCMT over the last 2-3 years. Despite the biases inherent in some of these surveys, and the crudeness of the redshift information available in others, I conclude that all current information suggests that only % of luminous sub-mm sources lie at , and that the median redshift of this population is . I suggest that such a high median redshift is arguably not unexpected given current theories designed to explain the correlation between black-hole mass and spheroid mass found at low redshift. In such scenarios, peak AGN emission is expected to correspond to, or even to cause termination of major star-formation activity in the host spheroid. In contrast, maximum dust emission is expected to occur roughly half-way through the star-formation process. Given that optical emission from bright quasars peaks at , dust-emission from massive ellipticals might be reasonably expected to peak at some point in the preceding Gyr, at . Confirmation or refutation of this picture requires significantly-improved redshift information on bright samples of SCUBA sources.
keywords:
cosmology:observations , galaxies:formation , galaxies:starburst , infrared:galaxies , ISM:dust1 Introduction
The importance of understanding the nature of the recently-discovered sub-mm galaxy population has been discussed in detail by many authors (e.g. Hughes et al. 1998; Blain et al. 1999). Most importantly, constraining the redshift distribution of this population is a requirement for obtaining an unbiased view of the star-formation history of the universe, and potentially holds the key to understanding the formation and evolution of massive elliptical galaxies (e.g. Eales et al. 2000; Dunlop 2001). In this review I therefore concentrate on what we have learned to date about the redshift distribution of the sub-mm population from the six main classes of survey which researchers have undertaken in the last 2-3 years with the SCUBA camera on the JCMT.
First I consider current results from three different types of surveys aimed at determining the sub-mm luminosities of objects which have already been discovered at other wavelengths. These are i) radio galaxies, ii) optically selected quasars, and iii) micro-Jy radio sources. Such studies have the practical advantage of accurate source positions, and (at least in the first 2 cases) pre-existing redshift information. By focussing on specific sub-classes of object they are inevitably biased to some extent, but the extent of this bias may not necessarily be severe.
Second, I consider current results from surveys which have been designed to discover new sources at sub-mm wavelengths. Again, I have divided these into three distinct classes, namely i) surveys which aim to take advantage of the gravitational lensing effects of intervening rich clusters, ii) imaging surveys of the fields around known high-redshift objects, and iii) genuinely unbiased, blank-field surveys of non-descript regions of sky.
For the sake of clarity and comparability I have produced summary statistics for each survey considering only sources which have been detected in the sub-mm at significance levels , and which have intrinsic sub-mm flux densities mJy.
Before proceeding with this census, it is important to note that, apart from the radio galaxies and quasars for which spectroscopic redshifts already exist, almost all of the redshift estimates discussed and summarized in what follows are based on the observed far-infraredradio spectral energy distributions (SEDs) of the sources. This serves to emphasize the importance of understanding such SEDs, and legitimizes the inclusion of this review in this particular conference! However it does of course mean that many of the current redshift constraints are inevitably rather crude and uncertain.
Of greatest current importance is the use of the sub-mm:radio flux-density ratio which is a relatively sensitive function of redshift for a starburst galaxy, initially rising before flattening towards higher redshift in a manner which depends on the form of the assumed template spectrum. This ratio was first used by Hughes et al. (1998) to set redshift constraints on the sub-mm sources detected in the Hubble Deep Field, and has since been explored in detail by Carilli & Yun (1999), Carrilli & Yun (2000), Dunne et al. (2000), Barger et al. (2000), and Blain (2001). There is now general agreement that adopting M82 as a template SED (e.g. Carilli & Yun 1999) is probably not appropriate for the luminous sub-mm population and is likely to lead to excessive redshift estimates. Instead, most authors now adopt Arp220 as the most appropriate low-redshift template ULIRG. Alternatively, Dunne et al. (2000) have chosen to derive a mean-SED from their SCUBA survey of low-redshift IRAS galaxies. There is some continuing controversy over the precise form of the best relation to use. Dunne et al. (2000) argue convincingly that their relation is most robustly calibrated at low redshift. On the other hand the revised relation presented by Carilli & Yun (2000) appears to do a better job of reproducing the redshifts of the handful of objects with known CO redshifts at . However, the level of this disagreement is now comparable to the uncertainties in these relations, and the key point in what follows is that essentially all authors in this field would appear to agree that a flux-density ratio (or equivalently a spectral index ) implies . Finally, when utilising this redshift-estimation technique, it is always worth remembering that over-optimistic radio-submm associations, or failure to recognize an AGN contribution to radio flux-density, will always result in an under-estimate of the true redshift of the source. Over-estimation of redshift is less likely to occur.


2 Redshifts of known sources now detected in the sub-mm
2.1 Radio galaxies
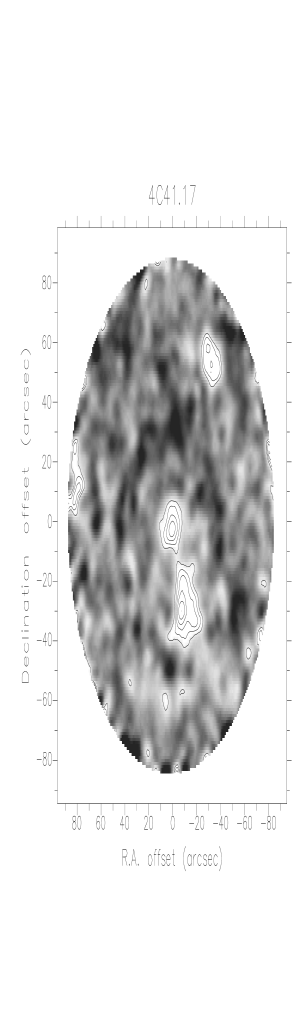
The first radio galaxies to be detected at sub-mm/mm wavelengths were also the most distant and powerful radio galaxies known at the time - 4C41.17 at z = 3.8 (Dunlop et al. 1994) and 8C1435635 at z = 4.2 (Ivison et al. 1995). Even before SCUBA it was clear that these detections were telling us something important because attempts to detect other well-known radio galaxies at lower redshift were much less successful (Hughes et al. 1997). However, it was only with the advent of SCUBA that it became possible to observe sufficiently large samples of radio galaxies to determine if the large dust masses found in 4C41.17 and 8C1435635 (Figure 1) are primarily a consequence of their extreme redshifts or their extreme radio luminosities.
My colleages and I have now completed the first such major sub-mm survey
of radio galaxies, using SCUBA in photometry mode to undertake sensitive
850-micron observations (rms noise mJy) of powerful radio
galaxies spanning the redshift range (Archibald et al.
2000). As shown in Figure 2, this study has confirmed the
increased sub-mm detectability of radio galaxies with
increasing redshift (15% success rate at , 75% success rate at
). Moreover, we have been able to break the degeneracy between
radio luminosity and redshift, and find that the primary dependence of
sub-mm luminosity is with redshift - specifically we find that average
sub-mm luminosity increases approximately out to
.
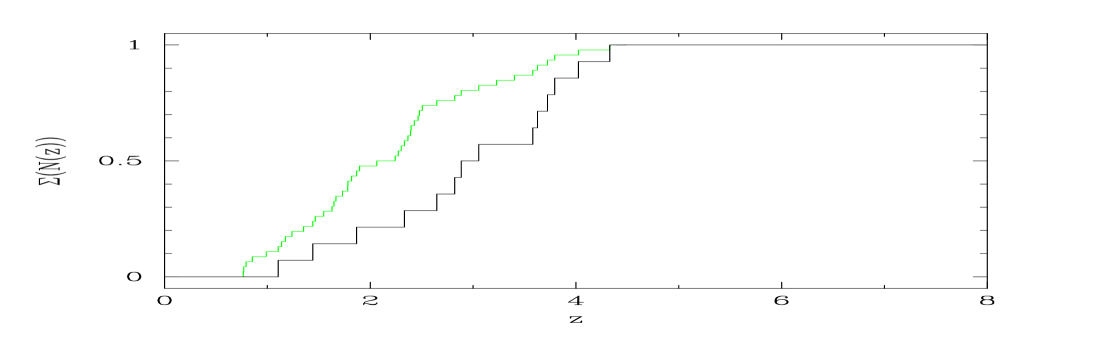
The median redshift of the sub-mm detected radio galaxies in this sample is
. It is important to stress that this is not simply a reflection
of the redshift distribution of the parent sample, as this has
(see Figure 2).
Interestingly, all but one of the radio galaxies with mJy lie at
, and the median redshift for this subset is .
Redshift Summary: Median . 1/9 4
mJy sources at .
Bias: Potentially unbiassed if radio galaxies are representative of
massive galaxies in general.
2.2 Quasars
A substantial number of high-redshift ()
optically-selected quasars have now been detected at sub-mm
(McMahon et al. 1999) and mm (Carilli et al. 2000) wavelengths.
However, to date such observations have been deliberately concentrated
on very high-redshift quasars, and no study has yet been completed of
the sub-mm luminosity of QSOs of comparable optical
luminosity over a wide range in redshift, analogous to that described above
for radio galaxies. As a result it is not yet possible to quantify the
redshift dependence of dust mass in quasars. However, McMahon et al. (1999)
have explored whether, at high redshift, there is any evidence that sub-mm
luminosity depends on optical luminosity and do not find any
support for such a luminosity dependence.
Redshift Summary: Median . 0/9 sources at .
Bias: Biassed - bias potentially severe and not yet quantified.
2.3 Weak radio sources
Barger et al. (2000) have found that a substantial
fraction () of optically-faint micro-Jy radio sources
can be detected by SCUBA at flux densities
mJy. This is an important, albeit not entirely unexpected,
result as both synchrotron emission from Type II supernovae and thermal
emission from warm dust are symptomatic of very recent
(yr) massive star-formation activity. Barger et al. conclude
that % of the bright sub-mm population can be located via
micro-Jy radio maps, and that the entire sub-mm population lies in the
redshift band . However, a closer examination of their data
suggests that this conclusion may be premature. In fact,
of the 4 sub-mm sources they have discovered with mJy, only
two are Jy radio sources, and the listed radio-submm SED-based
redshift estimates for these 4 sources are , ,
and . This ‘survey’ thus arguably
supports a mean/median redshift of for the bright sub-mm
population, albeit with very large errors. In fact, even at somewhat
lower sub-mm flux densities, examination of their figure 2 suggests that
Jy radio-source selection can only identify % of the SCUBA
population, especially when one factors in the inevitable bias introduced
by imaging only sub areas which contain the majority of faint
radio sources. Furthermore, the % of the
SCUBA population which can be detected by this approach must, inevitably,
be the lower-redshift half.
Wide area blank-field surveys, such as the 8-mJy survey described below,
offer the only way to properly quantify this bias.
Redshift Summary: Median 1/4 sources at .
Bias: Biased to lower- sources, but extent of bias
not yet properly quantified.
3 Redshifts of sub-mm selected sources
I now consider our current information on the redshifts of sources which have been discovered through sub-mm imaging. Such sources have been uncovered via three different classes of sub-mm survey, namely i) surveys designed to take advantage of the gravitational lensing provided by rich galaxy clusters, ii) surveys of the fields around known high-redshift AGN, and iii) unbiassed blank-field surveys, generally conducted in regions of sky which have already been well-studied at other wavelengths. Below I give a summary of the main results from each class of survey. I have deliberately focussed attention on the brightest sources, because it is generally only for these sources that solid, unconfused sub-mm/mm positional information has been obtained so far.
3.1 Lensing surveys
The ultimate goal of spectroscopic redshifts, confirmed by CO detections,
has been achieved for three of the sources detected via SCUBA imaging of the
fields of rich clusters – SMMJ023990136 at ,
SMMJ14011+0252 at , and SMMJ023990134 at (Smail
et al. 2000).
However, while it is obviously nice to have some concrete numbers, it is
unclear how representative these sources are, given that their redshift
determination was assisted by their unusually bright optical
counterparts and, in the latter two cases, by the presence of an AGN. For
the sample as a whole one has to resort to the radio-submm redshift estimator
discussed above. Based on the fact that only of the sample has
proved detectable at 1.4GHz, Smail et al. (2000) argue that
the median redshift is most likely . This result
provides direct support for the argument advanced above (in section 2.3)
that targeted sub-mm observations of known micro-Jy radio sources are
likely to reveal only the low-redshift half of the sub-mm galaxy population.
It also means that the median redshift of the lensing-survey sources
is in excellent accord with the
median redshift of sub-mm detected radio galaxies discussed in section 2.1.
Redshift Summary: Median . 2/7 sources at .
Bias: Unbiased.
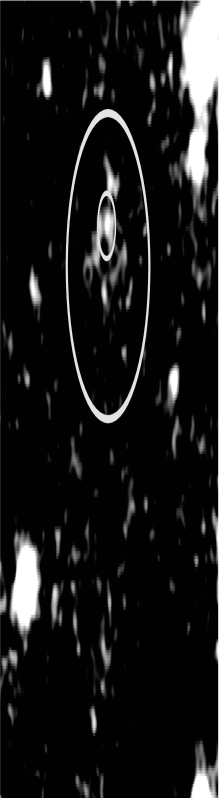
3.2 AGN companions
Sub-mm surveys of the fields around known high-redshift objects are, by
definition, inevitably biassed to some extent. However, given the
probability that galaxy
formation at high redshift is itself biassed towards regions of
high density, such targeted imaging surveys are a potentially important
complement to genuinely unbiassed blank-field surveys. Indeed the first
few deep SCUBA images of the fields around high-redshift radio galaxies
have proved remarkably successful at uncovering bright sub-mm sources,
as illustrated in Figure 3. Deep radio imaging in the vicinity of
such powerful radio sources is obviously challenging, but is underway at the
time of writing. However, existing 450:850 ratios, and the faintness of
possible optical/IR identifications already support the
statistically-probable conclusion that these sources lie at the same
redshift as the central
AGN. Moreover, direct confirmation of this has recently been obtained
for one source via CO imaging (Ivison 2001). The best estimate of the
yield of this
work to date is 8 sources with mJy – 3 at ,
2 at and 3 at .
Redshift Summary: Median . 0/8 sources at .
Bias: Biassed - imaging largely confined to objects at .
3.3 Blank-field surveys
3.3.1 The Hubble Deep Field
At the time of writing none of the
sub-mm sources in the Hubble Deep Field reported by Hughes et al. (1998) has
a reliable redshift. Given the wealth of supporting data this serves to
demonstrate how hard it will be to obtain complete redshift information on
sub-mm selected samples. Interesting constraints can, however, be placed
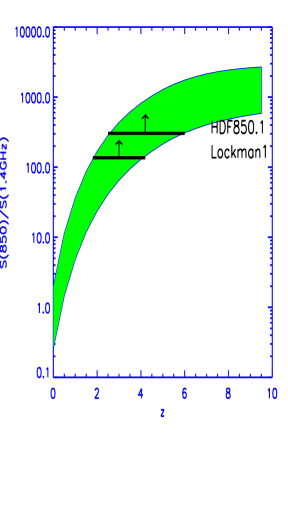
on the redshift of the brightest source HDF850.1 (mJy), following
its detection with the IRAM PdB interferometer at 1.3mm (Downes et al.
1999). While the accurate position provided by the interferometric detection
has not in fact yielded an unambiguous optical identification, it has enabled
a robust upper limit to be placed on the 1.4GHz:850 flux-density ratio
of . This, along with the 450:850 and 850:1300 ratios all point
to a redshift in the range (see Figures 4 and 5), in which
case it is certainly possible that its optical/IR counterpart is too faint to
be detected by existing optical/IR imaging. Radio-submm SED constraints
suggest for the second-brightest source in the HDF.
Redshift Summary: Median . 0/2 sources at .
Bias: Unbiassed, but sample very small.


3.3.2 The Canada-UK Deep Sub-mm Survey
The recent completion of the 14-hr field of the Canada-UK SCUBA survey
has yielded 7 sources with signal:noise and
mJy (Eales et al. 2000).
Of particular interest is the brightest source
(CUDSS 14.1; mJy) which, like HDF850.1 has now been detected
with the the IRAM PdB interferometer at 1.3mm (Gear et al. 2000). Again
radio-mm-submm SED constraints
favour a high redshift in the range ; Eales et al.
choose an estimated redshift of . Most of the other
4- sources in this sample have not been detected at 1.4GHz, but
their relatively
weak sub-mm fluxes means the resulting redshift constraint is generally
simply .
Redshift Summary: Median . 1/7 sources at .
Bias: Unbiassed, but only 3 sources brighter than 5 mJy, so
radio-submm redshift constraints are weak.
3.3.3 The 8-mJy survey
The ongoing SCUBA survey of the ELAISN2 and Lockman-E fields has now
covered 150 sq. arcmin to even depth, and has currently yielded 12 sources
with signal:noise at flux densities mJy
(Scott et al. 2001). Very deep radio data will not
be available for these fields until early in 2001, and so at present it is
not possible to place even crude constraints on the redshifts of most
of these sources. However, the brightest source in the Lockman field has
been detected by the IRAM PdB interferometer, and in this case identified
with a faint red complex object via very-deep -band imaging. As shown
in Figure 5, both SED
constraints and the properties of this infrared identification
favour a redshift in the range (Lutz et al. 2001; Dunlop 2001).
Redshift Summary: Median . 0/2 sources at .
Bias: Unbiassed, but currently lacking in redshift information.
Addition of deep radio data in early 2001 will transform this situation.
4 Conclusion
The results discussed above are summarized in Table 1. Despite the biases inherent in several of these surveys, it is interesting that of the significant extragalactic sources with mJy uncovered by SCUBA during its first 2-3 years of operation, only % appear to lie at . Certainly, all of these studies can be reconciled with a median redshift of at least for the luminous sub-mm galaxy population.
Such a high median redshift is arguably not unexpected given current theories designed to explain the correlation between black-hole mass and spheroid mass found at low redshift. In such scenarios, peak AGN emission is expected to correspond to, or even to cause termination of major star-formation activity in the host spheroid. In contrast, maximum dust emission is expected to occur approximately half-way through the star-formation process (Eales & Edmunds 1996; Archibald et al. 2001). Given that the optical emission from powerful quasars peaks at , dust-emission from massive ellipticals might be expected to peak 0.5-1 Gyr earlier, at . Confirmation or refutation of this appealingly-simple picture requires substantially-improved redshift information on bright samples of SCUBA sources, such as the 8mJy survey.
| Survey | No. | No. at | |
|---|---|---|---|
| Radio Galaxies | 9 | 1 | 3.1 |
| Quasars | 9 | 0 | 4.4 |
| -Jy Radio | 4 | 1 | 2.9 |
| Lensing Surveys | 7 | 2 | 3 |
| AGN fields | 8 | 0 | 3.8 |
| HDF | 2 | 0 | 3 |
| CUDDS | 7 | 1 | 2.1 |
| 8mJy | 2 | 0 | 3 |
| Total | 48 | 5 |
Acknowledgments
I gratefully acknowledge the contributions of my collaborators on several of the projects covered in this review, especially Elese Archibald, Dave Hughes, Rob Ivison, Steve Rawlings, Omar Almaini, Dieter Lutz, John Peacock, Suzie Scott, Steve Serjeant and the other members of the UK SCUBA Consortium.
References
Archibald, E.N., et al., 2000, MNRAS, in press (astro-ph/0002083).
Archibald, E.N., Dunlop, J.S., et al., 2001, ApJ, in preparation.
Barger, A.J., Cowie, L.L., Richards, E.A., 2000, AJ, 119, 2092.
Benford, D.J., et al., 1999, ApJ, 518, L65.
Blain, A.W., 2001, In: ‘Deep Sub-millimetre Surveys’, eds. Lowenthal, J.
&
Hughes, D., World Scientific, in press (astro-ph/0009012).
Blain, A.W., Smnail, I., Ivison, R.J., Kneib, J.-P., 1999, MNRAS, 302, 632.
Carilli, C.L., Yun, M.S., 1999, ApJ, 513, L13.
Carilli, C.L., Yun, M.S., 2000, ApJ, 530, 618.
Carilli, C.L., et al., 2000, ApJ, in press (astro-ph/0002386).
Downes, D., et al, 1999, A&A, 347, 809.
Dunlop, J.S., et al., 1994, Nature, 370, 347.
Dunlop, J.S., 2001, In: ‘Deep Sub-millimetre Surveys’, eds. Lowenthal, J.
&
Hughes, D., World Scientific, in press (astro-ph/0011077).
Dunne, L., Clements, D.L., Eales, S.A., 2000, MNRAS, 315, 115.
Eales, S.A., Edmunds, M.G., 1996, MNRAS, 280, 1167.
Eales, S.A., et al., 2000, AJ, in press (astro-ph/0009154).
Gear, W.K., et al., 2000, MNRAS, in press (astro-ph/0007054).
Hughes, D.H., Dunlop, J.S., Rawlings, S., 1997, MNRAS, 289, 766.
Hughes, D.H., et al., 1998, Nature, 394, 241.
Ivison, R.J., 1995, MNRAS, 275, L33.
Ivison, R.J., 2001, In: ‘Deep Sub-millimetre Surveys’, eds.
Lowenthal, J. &
Hughes, D., World Scientific, in press.
Ivison, R.J., et al., 2000, ApJ, in press (astro-ph/0005234).
Lutz, D., et al., 2001, A&A, in preparation.
McMahon, R.G., et al., 1999, MNRAS, 309, L1.
Scott, S., et al., 2001, MNRAS, in preparation.
Smail, I., et al., 2000, ApJ, 528, 612.