The inner nebula and central binary of the symbiotic star HM Sge
Abstract
We present contemporaneous HST WFPC2 and VLA observations of the symbiotic nova HM Sge. We identify a number of discreet features at spatial scales smaller than 0.1 arcsec embedded in the extended nebula, with radio and optical emission well correlated in the inner 1 arcsec. For the first time we measure the positions of the binary components of a symbiotic star directly. We estimate the projected angular binary separation to be 409 milli–arcsec, with the binary axis at position angle 13010∘. The latter is consistent with previous estimates made by indirect methods. The binary separation is consistent with a previous estimate of 50 au if the distance is 1250280 pc. Temperature and density diagnostics show two distinct regions in the surrounding nebula, with a cool wedge to the south–west. An extinction map indicates the true interstellar extinction to be no more than E(B–V) = 0.35. This is consistent with a minimum distance of 700 pc, but this would be reduced if there is a circumstellar contribution to the minimum in the extinction map. The extinction map also suggests a patchy dust distribution. We suggest that a southern concentration of dust and the south–west wedge are associated with the cool component wind. Alternatively, the southern dust concentration is the cause of the cool wedge, as it shields part of the nebula from the hot component radiation field.
1 Introduction
Symbiotic stars are an extreme case of interacting binaries, with separations of a few to a few 10s of au. They comprise a cool component (CC), typically a red giant or Mira–type variable, and a hot component (HC), usually a white dwarf associated with an ionized component of the CC wind. An infrared sub–classification has been made, dividing the class into D(usty)–types, and S(tellar)–types, based on the dominant contribution to the IR. Early modeling of the radio emission has shown that D–types typically have separations of 10 or more times that of S–types. Some of these objects show very slow optical outbursts, similar to those of novae, but lasting decades (see e.g. Kenyon 1986 and Mikołajewska 1997 for further discussion.)
HM Sge is a D–type symbiotic star which underwent such an optical outburst in 1975. Since then, there has been evidence of dust obscuration events, as in 1985 (Munari & Whitelock, 1989) when A 13.5 (Whitelock, 1988; Munari & Whitelock, 1989), and in 1979–1980 when A 12 (Thronson & Harvey, 1981). The different values of AV have led to a suggestion of clumping in the dust (e.g. Thronson & Harvey, 1981), which was also suggested by Richards et al. (1999) to explain the nebula structural changes seen in the radio. Various distance estimates to HM Sge are summarized by Ivison et al. (1991). Those authors’ own estimate of 1300 pc was based on a reddening estimate of E(B–V) = 0.53. Kenyon, Fernandez–Castro & Stencel (1988) used far–infrared IRAS colors to derive the extinction and a distance of 1800 pc. These estimates clearly depend on the effects of variable circumstellar extinction. Recently the Mira–type cool component has been clearly seen in spectro–polarimetry (Schmid et al., 2000), indicating that dust obscuration has subsided somewhat. The spectra of Schmid et al. (2000) are dominated by the line emission, with a rising continuum beyond 8000 Å. They also suggested that the binary axis had a position angle of 123∘ in 1998. This contradicts tentative conclusions by Richards et al. (1999) placing the Mira–type due north of the hot component (i.e. position angle ). Many of the observations of the outburst and subsequent development of HM Sge are described in Nussbaumer & Vogel (1990) and Mürset & Nussbaumer (1994).
Corradi et al. (1999) have conducted ground–based imaging of the extended nebula of HM Sge. They find a number of filaments and discrete features embedded in a nebula extending to arcsec. This emission is extremely faint, and if the nebula is due to activity in the central binary, suggests a much longer history to such activity than observed since 1975.
HM Sge was detected in the radio shortly after the optical outburst (Feldman, 1977). Radio surveys showed HM Sge to be one of the brightest radio emitters in the class (Seaquist, Taylor & Button, 1984; Seaquist, Krogulec & Taylor, 1993). Kwok, Bignell & Purton (1984) found a diffuse halo 0.5 arcsec in diameter, surrounding a central nebula 0.15 arcsec in size. More recently, Eyres et al. (1995) demonstrated that the structure seen in the radio could be correlated with HST images at the same spatial resolution, suggesting that at least the HC was centrally located in the inner nebula. Richards et al. (1999) traced the development of the radio structure over 5 years, and related it to the binary motion. They derived a period of 80 years and a binary separation of 50 au111The references in Richards et al. (1999) to a binary separation of 25 au are made in error – the binary orbital semi–major axis is 25 au, giving the binary separation as 50 au.. Non–thermal emission associated with an E–W outflow has also been found (Eyres et al., 1995), and Richards et al. (1999) showed that this is rare in symbiotic stars due to the relatively short timescale on which the emission dissipates.
Here, we discuss our observations of the nebula associated with this star using WFPC2 on the Hubble Space Telescope (HST). We also present contemporaneous radio images of the inner nebula made with the Very Large Array (VLA). These observations allow us to determine the physical parameters in the nebula, and to attempt to relate the conditions with the binary interaction and the outburst history of the system.
2 Observations
The HST observations were made on 1999 October 22, as part of a GO program 8330 on symbiotic stars, as shown in Table 1. Three orbits were allocated to HM Sge, and observations were made in seven filters, including F218W, F437N, F469N, F487N, F502N, F547M and F656N. The exposure times and dominant lines for images presented here are given in Table 1. Further details of these filters are available from Biretta et al. (1996).
| Filter | Exposure | Peak | Scientific features | ||
|---|---|---|---|---|---|
| times (s) | (Å) | (Å) | (Å) | and wavelengths (Å) | |
| F218W††dithered images | 40 | 2136 | 355.9 | 2091 | Interstellar absorption |
| F218W | 100 | 2136 | 355.9 | 2091 | Interstellar absorption |
| F437N | 800 | 4369 | 25.2 | 4368 | [O III] 4363 |
| F469N | 100 | 4695 | 24.9 | 4699 | He II 4686 |
| F487N | 200 | 4865 | 25.8 | 4863 | H4861 |
| F502N | 100 | 5012 | 26.8 | 5009 | [O III] 4959, 5007 |
| F547M††dithered images | 2 | 5454 | 486.6 | 5362 | Strömgren y |
| F547M | 20 | 5454 | 486.6 | 5362 | Strömgren y |
| F656N††dithered images | 100 | 6562 | 22.0 | 6561 | H6563 |
The calibrated data were retrieved from the HST archive. Each exposure was executed in two sub–exposures to allow cosmic ray subtraction. The F656N image presented here was also dithered to allow recovery of the full spatial resolution (Biretta et al., 1996). In addition, the stellar positions (section 3.3) were determined from dithered images taken through the F218W and F547M filters. The pixel size was 0.0455 arcsec for the undithered images and 0.02275 arcsec for the dithered ones.
The VLA observations were made on 1999 September 26 at 8.56 GHz and 23 GHz. Comparison with the primary calibrator 1331+305 (3C286) gave the flux of secondary calibrator 1935+205 as 0.3850.001 Jy at 8.56 GHz and 0.410.01 Jy at 23 GHz. The complex gain solutions for this calibrator were applied to HM Sge. MERLIN observations by Richards et al. (1999) show that the structures in the inner nebula move by 4 milli–arcsec per year and the flux density remained roughly constant at 22 GHz between 1994 and 1996. Thus the VLA and HST images can be directly compared.
3 Results
3.1 HST WFPC2 images
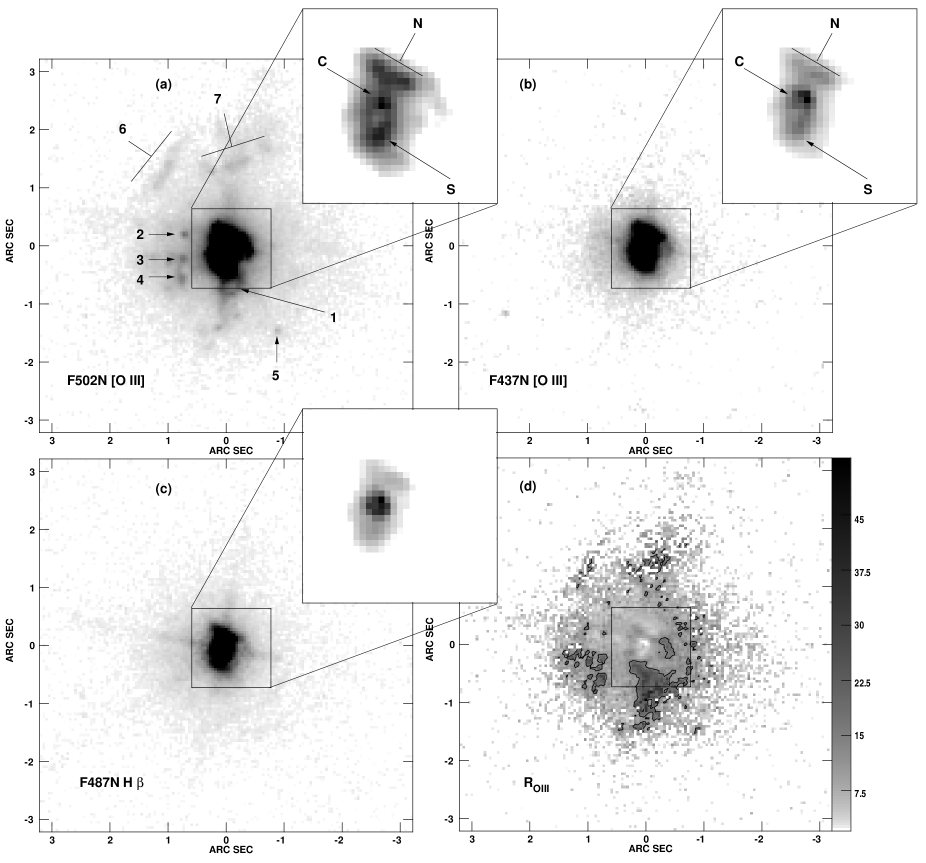
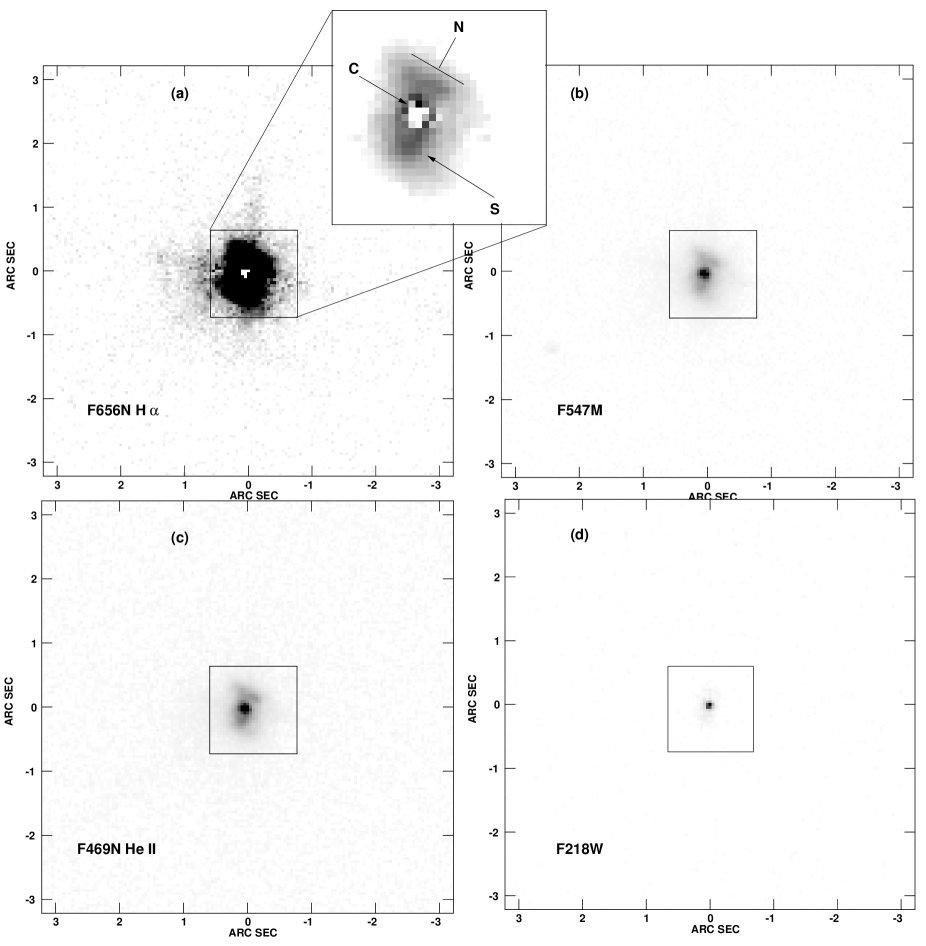
The HST WFPC2 images are shown in Figs. 1 and 2. Some extended emission is apparent out to 2 arcsec, but the brightest parts are within 0.5 arcsec of the central star, which is readily identified from the diffraction spikes in Fig. 1(c). Feature 1 visible in Fig. 1(a) is almost a ring of emission at the south–west edge of the inner nebula. There are three compact knots to the east of the central emission (features 2, 3 & 4), and a fourth one to the south–west (feature 5), which are most obvious in the F502N filter [Fig. 1(a)]. Weak filaments are also present to the north (feature 6 & 7), and may be associated with northern prominences seen at larger scales from the ground by Corradi et al. (1999). The inner parts of the nebula shows three structures: a ridge to the north (N), a peak at the center (C) and a more irregular feature to the south (S), which may be the brightest part of a loop of emission. In the case of the F656N image Fig. 2(a), dominated by H, the central star position has been fitted and the point spread function (PSF) subtracted, using a PSF modeled using the TinyTIM software (Krist, 1995). This image shows that features C, N and S are distinct in hydrogen, and they are also present in the weaker H emission in the F487N image Fig. 1(c). The features C, N and S are present in the F218W image Fig. 2(d), but the latter two features are extremely weak.
3.2 VLA images
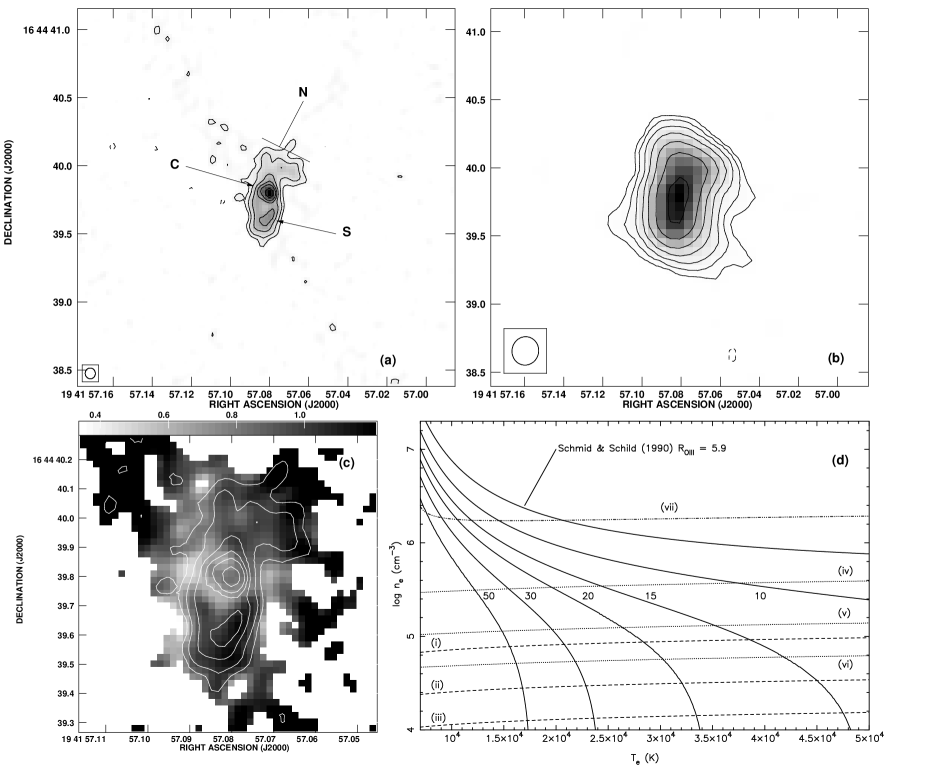
The VLA images are presented in Figs. 3(a) & (b). At 23 GHz there is a northern ridge running E–W, a central, almost circular peak, and a more irregular southern feature. These features coincide with features N, C and S in Fig. 1(a), and we adopt the same labels for the radio structure. From comparison of Fig. 3(a) and e.g. Fig. 1(a) we suggest that at least one of the binary components is coincident with radio feature C. We discuss this further in section 3.3. The 8.56 GHz image [Fig. 3(b)] has significantly lower resolution, but is sensitive to more extended emission. Two features are apparent: a central N–S elongated structure, encompassing features N, C and S, and an extension to the S–W coincident with feature 1.
3.3 Stellar positions
A simple estimate of the relative contributions of the HC and CC in HM Sge at a given wavelength can be made assuming blackbodies with T = 200 000 K (Mürset, Wolff & Jordan, 1997), T = 3 000 K, and taking approximate radii of 0.01 and 100 R⊙ respectively. This shows that the HC dominates the CC by a factor at 220 nm [F218W, Fig 2(d)] and the CC dominates the HC by a factor at 550 nm [F547M, Fig 2(b)]. Note that UV spectra show negligible line contribution to the F218W filter (see e.g. Kenyon, 1986). A number of lines contribute to the F547M filter (see e.g. Schmid et al., 2000, their Fig. 2). The CC is clearly badly modeled by this estimate, as it does not account for the absorption bands characteristic of Mira–types. In addition, a simple estimate of the luminosity of the HC Mürset et al. (1991) and the contribution at 2200Å shows that the central pixel will be entirely dominated by stellar emission, rather than nebular emission. These estimates show that if the two stars were displaced by more than a few pixels on the sky, the peak of the emission should clearly move between the F218W image and the F547M image. That this is not the case means that both stars must be within feature C.
As the PSF of the star in each image extends to a large angular distance from the peak, we have attempted to fit a Gaussian component to the peak positions in the F218W and F547M images. The best resolution was available in our dithered images, where the pixel size is 0.02275 arcsec. The position of the peak relative to 19 41 57 +16 44 39 in the F218W image [Fig. 2(d)] is = 0.080670.00004, = 0.61950.0005 while in the F547M image [Fig. 2(b)] it is = 0.082580.000005 = 0.59200.00002. The errors quoted are the formal uncertainties of the fits. When dithering, the measured shifts (from the positions of bright stars in each frame) can be up to 0.2 undithered pixels or 9 milli–arcsec (mas) different from the requested value of 5.5 pixels. This is probably the best estimate we have of the true uncertainty of the measured peak shift from F218W to F547M. Thus, the peaks in the two filters are displaced from each other by 409 mas at a position angle of 13010∘ measured north through east. The position angle agrees well with that suggested by Schmid et al. (2000). We suggest that the peak position in the F218W image is that of the HC while the peak position in the F547M image is that of the CC. Thus, the line connecting the two stars on the sky, the “binary axis”, is at a position angle of 13010∘. The schematic in Fig. 4 illustrates the relationship between the binary components and the features apparent in the inner nebula.

To test further these measurements, we also looked at other observations of symbiotic stars made under our GO programme. In the case of CH Cyg (paper in preparation), the star was known to be in eclipse during the observation, so that only one star could possibly be seen. The shift in that case was mas, comparable to the estimate from the dithering uncertainties, and hence consistent with the star being in eclipse.
The peak positions in the other filters are not necessarily coincident with the stars as they are dominated by nebular lines. These positions are illustrated in Fig. 4. By definition these filters are sensitive to more extended emission. This means that fitting a gaussian is invalid, as the nebulosity may be asymmetrical but strongly emitting near the stars. Thus a lack of coincidence between the peaks of the narrow filters and the peaks of the F218W and F547M filters is to be expected. The H and H images have peaks very close to that of the F547M image. The He II image, which traces the highest ionisation regions, has a peak between the two stars and slightly south of the binary axis, consistent with the model of Nussbaumer & Vogel (1990). Finally, the F437N and F502N images, dominated by [O III] lines which are sensitive to temperatures and densities, have peaks which differ from those of all the other images and from one another. The results for these latter three filters are most readily explained in the context of the suggested wind interaction which might be expected to have the strongest effects between the two stars.
3.4 Nebular diagnostics
A number of diagnostics of the physical conditions in the nebula can be derived from the images presented here. The ratio of the F502N image (including both [O III] 4959 & 5007) to the F437N image (including [O III] 4363) depends on both electron temperature and density according to the equation
| (1) |
(see Osterbrock, 1989). Examination of ground–based optical spectra indicate that these two WFPC2 filters are dominated by the three lines which contribute to the ratio, and the nebular continuum is very weak (see e.g. Schmid et al., 2000, their Fig. 2). Thus, Figs. 1(a) and (b) can be used to derive the ratio map Fig. 1(d) which traces and , and in principle depends on both of these quantities. This diagnostic has been applied effectively to HM Sge by Schmid & Schild (1990), using spatially–unresolved spectra for the entire nebula.
The WFPC2 Charge Transfer Efficiency (CTE) effect on the WFPC2 chips (Whitmore & Heyer, 1998; Whitmore, 1998) has a bearing on this analysis. For aperture photometry, this causes stars at the top of the chip (row number 800) to appear systematically fainter than those at the bottom (row number 0). The effect is also stronger for brighter stars. The consequences of this effect for extended emission is not well understood. In our case the observed emission falls on the same region of the chip for all observations, and brightness variations are not severe across the nebula. This means that we can draw firm qualitative conclusions from Fig. 1(d).
Radio brightness, expressed as a brightness temperature , is given by
| (2) |
where the optical depth at frequency is
| (3) |
assuming is constant, where is the path length through the nebula (again see Osterbrock, 1989). Thus, the radio brightness temperature also depends on both and . Relationships (1), (2) and (3) provide loci in a – plot, which intersect at the conditions appropriate to the various features. Comparing Figs. 1(d) and 3(b), we can determine the conditions as a function of position.
Loci for typical values of , and are illustrated in Fig. 3(d). Also shown here is the locus for the Schmid & Schild (1990) value of . It is clear that the main source of uncertainty in this analysis is the value adopted for . A reasonable estimate would be to place it at somewhere between the largest and the smallest angular size seen on the sky. When estimated in this fashion, it also depends linearly on the distance, which is not well known. However, we should still be able to draw qualitative conclusions about the relative temperatures and densities of the different regions despite this distance uncertainty. Most importantly, it is apparent from Fig. 3(d) that along contours of constant , Fig. 1(d) primarily traces variations in . At the same time, variations in trace variations in . We must be careful not to use this analysis to draw conclusions about those regions of the nebula where no radio emission is detected. An interferometer such as the VLA will resolve–out smooth extended structure, meaning that the true extended radio brightness will generally be greater than that present in the radio map. We note that the value of from Schmid & Schild (1990) is effectively an average, dominated by the brightest nebular feature. We have plotted a locus in Fig 3(d) for the peak emission in the 23 GHz image (the peak of feature C) as the most relevant one for comparison with the Schmid & Schild (1990) locus. Given the variable nature of the inner nebula (Richards et al., 1999), the values which might be derived for that central region are similar to those derived by Schmid & Schild (1990), which were effectively a weighted average for the entire nebula.
The F469N image [Fig. 2(c)] is dominated by He II 4686 emission. This is a discriminator of strongly ionized regions (see Osterbrock, 1989). It can be seen from the image that features C, N and S are visible in He II. This suggests that these features are strongly ionized, and is consistent with these features being well defined in the F437N and F502N images [Figs. 1(a) & (b)], as [O III] shows roughly the same ionization structure. In addition, the He II emission does not extend far beyond a radius of 1 arcsec, suggesting that the intermediate scale nebulosity is more weakly ionized than the smallest scale features. This is more difficult to reconcile with the extended structure seen particularly in Fig. 1(a). However, as noted above the [O III] lines seen in these filters are sensitive to temperature and density, so we may well be seeing the effects of density inhomogeneities in the nebula. Such inhomogeneities are in turn consistent with the very clumpy nature of much of the emission at sub–arcsec scales.
3.5 Extinction mapping
A third diagnostic comes from the fact that the dereddenned H flux, , can be derived from the radio flux via the equation
| (4) |
where is in erg cm-2s-1. This assumes the radio flux is due to optically thin thermal emission. Thus, with a measured H flux we can derive the reddening E(B–V). In the past this has been used to derive the interstellar reddening using the total radio and H fluxes. However, in dusty environments such as that seen in HM Sge, there may be a contribution to the reddening from circumstellar matter. Such variations in circumstellar reddening have been suggested to explain the different estimates of E(B–V) and AV towards HM Sge in the past (e.g. Munari & Whitelock, 1989). In our case, the images of both H emission [Fig. 1(c)] and radio emission [e.g. Fig. 3(a)] allow us to derive an extinction map, as is shown in Fig. 3(c) for = 10 000 K. We note that Ivison, Hughes & Bode (1992) present a spatially–unresolved radio–infrared spectrum for HM Sge, indicating that the turn–over from optically thick to thin radio emission occurs at 8.5 GHz. However, it is clear from their Fig. 1 that the turn–over is gradual, consistent with partially optically thin emission up to 30 GHz. In addition, the inner nebula of HM Sge is variable in both brightness and structure (e.g. Richards et al., 1999), making the spectrum of Ivison, Hughes & Bode (1992) out of date. This means that it remains difficult to assess the optical depth conditions within the inner nebula as a function of position.
The consequences of the CTE effect for Fig. 3(c) are to provide an overestimate of the extinction, with the largest over estimates being at the brightest parts of Fig. 1(c). This extinction map is also affected by our assumptions about the radio emission. Equation 4 relies on the assumption that the radio emission is optically thin thermal. While the brightness temperatures are consistent with thermal emission, the optical depth is not well constrained. However, where emission is optically thick, we would underestimate the extinction. As the brightest radio emission most likely comes from the regions of greatest optical depth, this effect works in the opposite sense to the CTE effect. Finally, E(B–V) depends on electron temperature. If = 40 000 K, instead of the 10 000 K assumed above, E(B–V) would decrease by 0.2. Fig. 3(d) demonstrates that can vary considerably over the nebula. However, for the larger values of in the inner regions relationships (2) and (3) lead to loci at higher electron densities, while the curves derived from equation (1) converge towards lower , and extend over a narrower range of temperatures. Thus in the inner regions shown in Fig. 3(c) the variations in are relatively small. As the hotter regions are closest to the white dwarf, it seems likely that the intermediate values of E(B–V) = 0.7 may be somewhat reduced by the expected higher in that region. Bearing in mind these considerations, we are confident that we can draw qualitative conclusions from Fig. 3(c).
4 Discussion
4.1 Dust distribution and interstellar extinction
The extinction map in Fig. 3(c) can be taken to trace the circumstellar variation in the dust distribution, assuming the interstellar extinction is reasonably uniform over the relatively small angular size of the inner nebula. In this case, the best estimate of the true interstellar extinction comes from the minimum values in the extinction map. Three distinct regions are apparent: (i) to the south E(B–V) 1, coincident with feature S; (ii) to the north around feature N, E(B–V) 0.6, consistent with previous reddening estimates; and (iii) a low–ratio band running from east to west across the position of feature C. Note that the peak itself does not give a reliable E(B–V) estimate, as the emission in the optical is not entirely nebular. This band is also weakly contaminated by the diffraction spikes, which have a position angle of . The eastern part of this low–ratio band has E(B–V) = 0.35, the lowest value on the map, and presumably the best estimate of the true interstellar extinction. As high E(B–V) correlates with a greater quantity of dust, we can see that the dust is concentrated at feature S. In addition, there is a deficit of dust closer to feature C in Fig. 1(a), especially immediately to the east. This clumping of the dust at small scales was suggested by Thronson & Harvey (1981), based on discrepancies in reddening estimates. Our maximum value of E(B–V) 1 gives A 3.1 for interstellar dust (Evans, 1994), which is much lower than the value of A 12 of Thronson & Harvey (1981) but similar to other estimates both before and after that time. Much more recently, spectro–polarimetry by Schmid et al. (2000) demonstrated that the Mira was clearly visible, in agreement with the significant reduction in AV since 1980 we see here. Results from the Infrared Space Observatory (Schild et al., submitted) are consistent with a two–component dust model, with optical depths comparable to those derivable from our E(B–V) values. Such a model is also consistent with the extinction map in Fig 3(c), particularly as the Schild et al. modeling suggests that at least one of the components is clumpy.
We suggest that the highest concentration of dust, at feature S, is associated with the CC wind. Note that Fig. 3(c) is blanked beyond the 1 level of the VLA image, as no useful information can be derived beyond this limit. Hence, we have no knowledge about the dust distribution beyond that region.
4.2 The distance and the binary parameters
The minimum in the extinction map Fig. 3(c) places the interstellar extinction at no more than E(B–V) = 0.35. This is an upper limit because there may be a circumstellar contribution to the minimum. This gives an interstellar total extinction 1.1 magnitudes. Neckel & Klare (1980) provide maps of the galactic extinction versus distance. HM Sge lies at the edge of their field 265 (see Figs. 5 and 6m of Neckel & Klare 1980). For = 1.1, the minimum distance to HM Sge is approximately 700 pc, although measurements of similar are shown in field 265 for distances as low as 400 pc and as high as 2 kpc. Comparison with the extinction maps of Lucke (1978) suggest a distance of 800 pc for this value of E(B–V). However, such large–scale extinction maps are based on a small number of lines of sight in each field, so that the distance–dependent extinction values are not readily applicable to individual objects for the purposes of distance estimates.
4.3 Nebular temperatures
The map of [Fig. 1(d)] shows two distinct regions in the extended nebula visible with the HST. Most of the nebula has 4 15, while a wedge region to the south–west has 15 [coincident with feature 1 in Fig. 1(a)]. At the center, where the stars contribute significantly, is as low as 2, but clearly this is not purely nebular emission, and so cannot be relied upon for nebular diagnostics. From Fig. 3(d) it is clear that higher regions are consistent with lower electron temperatures along a given contour. This wedge extends from roughly the location of the highest extinction in Fig. 3(c) to the edge of the nebula, and is suggestive of the “bow wave” structures seen in interacting–wind simulations. More importantly, there is a cooler region in the nebula associated with the southern dust feature, further supporting our suggestion that we are seeing the CC wind directly. Alternatively, this region of the nebula could be shielded from the HC radiation field by feature S.
5 Conclusion
Using contemporaneous HST WFPC2 and VLA observations of the symbiotic nova HM Sge, we have investigated the nebular conditions and the relationship of the star positions to the nebular structure. We identify a number of discreet features at spatial scales smaller than 0.1 arcsec embedded in the extended nebula, including at least four discreet knots, and two linear features to the north–east. A ring–like feature (labeled 1) is evident on the south–west edge of the inner nebula.
The radio and optical emission is well correlated in the inner 1 arcsec, with a northern ridge (N), a central peak (C), and a more irregular southern feature (S) clearly evident at both 23 GHz and 5000Å. Temperature diagnostics show a “wedge” to the south–west, encompassing feature 1, consistent with lower temperatures than the rest of the nebula. The knots 1–3 and the western tip of ridge N also appear to have cooler, denser conditions than the rest of the nebula, but these are less well defined in the diagnostic map.
Both stars must be encompassed by feature C. The peak shifts by 409 mas between the F218W image ( 220 nm) and the F547M image ( 550 nm), with a position angle of 13010∘. We place the HC at the continuum UV peak and the CC at the red continuum peak. The position angle of the line between the two stars on the sky, the “binary axis”, is 13010∘. This is consistent with a suggested binary axis from spectro–polarimetry (Schmid et al., 2000). It is also consistent with a suggested binary separation of 50 au (Richards et al., 1999) if the distance is 1250280 pc.
The circumstellar extinction map suggests a patchy dust distribution, with the greatest extinction to the south–west, coincident with feature S, and the “wedge” around feature 1. The minimum in the extinction map indicates the true interstellar extinction to be no more than E(B–V) = 0.35. This is consistent with a minimum distance of 700 pc, but this would be reduced if there is a circumstellar contribution to the minimum. We suggest feature S and the south–west wedge (feature 1) are associated with the CC wind. Alternatively, the south–west wedge is shielded from the HC radiation field by feature S.
References
- Biretta et al. (1996) Biretta, J. et al. 1996, WFPC2 Instrument Handbook, Version 4.0 (Baltimore: STScI)
- Corradi et al. (1999) Corradi, R. L. M., Ferrer, O. E., Schwarz, H. E., Brandi, E. and García, L. 1999, A&A, 348, 978
- Evans (1994) Evans, A. 1994, The dusty universe (Chichester: Wiley)
- Eyres et al. (1995) Eyres S. P. S., Kenny H. T., Cohen R. J., Lloyd H. M., Dougherty S. M., Davis R. J. & Bode M. F. 1995, MNRAS, 274 317
- Feldman (1977) Feldman P. A., 1977, JRASC, 71, 386
- Ivison, Hughes & Bode (1992) Ivison R. J., Hughes D. H. & Bode M. F., 1992, MNRAS, 257, 47
- Krist (1995) Krist J., 1995, in Astronomical Data Analysis Software and Systems IV, ASP Conference Series, Vol. 77, eds. Shaw R. A., Payne H. E. & Hayes J. J. E. (ASP: San Francisco), p349
- Ivison et al. (1991) Ivison R. J., Bode M. F., Roberts J. A., Meaburn J., Davis R. J., Nelson R. F., Spencer R. E. 1991, MNRAS, 249, 374
- Kenyon, Fernandez–Castro & Stencel (1988) Kenyon S. J., Fernandez–Castro T., Stencel R. E. 1988, AJ, 92, 1118
- Kenyon (1986) Kenyon S. J. 1986, The symbiotic stars (Cambridge: CUP)
- Kwok, Bignell & Purton (1984) Kwok S., Bignell R. C. & Purton C. R. 1984, ApJ, 279, 188
- Lucke (1978) Lucke P. B. 1978, A&A, 64, 367
- Mikołajewska (1997) Mikołajewska, J. 1997, Physical processes in symbiotic binaries and related systems (Warszawa: Fundacja Astronomii Polskiej im. Mikołaja Kopernika)
- Munari & Whitelock (1989) Munari U. & Whitelock P. A. 1989, MNRAS, 237, 45P
- Mürset et al. (1991) Mürset, U., Nussbaumer, H., Schmid, H. M., Vogel, M., 1991, A&A, 248, 458
- Mürset & Nussbaumer (1994) Mürset U., Nussbaumer H., 1994, A&A, 282, 586
- Mürset, Wolff & Jordan (1997) Mürset U., Wolff B., Jordan S., 1997, A&A, 319, 201
- Neckel & Klare (1980) Neckel Th. and Klare G. 1980, A&AS, 42, 251
- Nussbaumer & Vogel (1990) Nussbaumer H. and Vogel M., 1990, A&A, 236, 117
- Osterbrock (1989) Osterbrock, D. E. 1989, Astrophysics of Gaseous Nebulae and Active Galactic Nuclei (Mill Valley, CA: University Science Books)
- Richards et al. (1999) Richards, A. M. S., Bode, M. F., Eyres, S. P. S., Kenny, H. T., Davis, R. J. and Watson, S. K. 1999, MNRAS, 305, 380
- Schmid & Schild (1990) Schmid H. M., Schild H., 1990, MNRAS, 246, 84
- Schmid et al. (2000) Schmid, H. M., Corradi, R., Krautter, J., Schild, H. 2000, A&A, 355, 261
- Seaquist, Taylor & Button (1984) Seaquist, E. R., Taylor, A. R. & Button, S. 1993, ApJ, 284, 202
- Seaquist, Krogulec & Taylor (1993) Seaquist, E. R., Krogulec, M. & Taylor, A. R. 1993, ApJ, 410, 260
- Thronson & Harvey (1981) Thronson, H. A. and Harvey, P. M. 1981, ApJ, 248, 584
- Whitelock (1988) Whitelock, P. A. 1988, in IAU Colloq. No. 103, The symbiotic phenomenon, eds. Mikołajewska, J., Friedjung, M., Kenyon, S. J. & Viotti, R. (Dordrecht: Kluwer), 47
- Whitmore & Heyer (1998) Whitmore, B. and Heyer, I. 1998, Instrument Science Report WFPC2 97–08, Space Telescope Science Institute
- Whitmore (1998) Whitmore, B. 1998, Technical Instrument Report WFPC2 98–01, Space Telescope Science Institute