NL 2300 RA Leiden, The Netherlands
Starbursts In Ultraluminous Infrared Galaxies - Fueling And Properties
Abstract
The properties of starbursts in ultraluminous infrared galaxies are discussed, with particular emphasis on the fueling, the amount of extinction and the intrinsic properties of the nuclear starbursts. It is shown by the example of that the vibrational lines can be used to measure the rate of gas inflow into the potential well, which is sufficient to fuel a nuclear starburst of the intensity required to account for the far-infrared emission. It is shown that in the faintness of all tracers of ionized gas can be accounted for by Lyman continuum absorption by dust within the ionized regions, combined with significant (but not extreme) extinction; there is no reason to invoke the presence of extreme extinction, an old starburst, or an additional non-stellar power source in .

1 Introduction
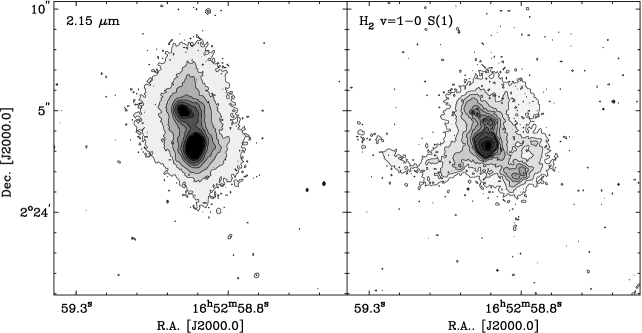
Are ultraluminous infrared galaxies (ULIGs) powered by intense bursts of star formation or is an additional source of energy, such as an active galactic nucleus (AGN) required? In order to address this question, it is instructive to compare the near-infrared spectra of ULIGs and lower luminosity starburst galaxies. In starburst galaxies of low or moderate luminosity, the dominant emission line is the line, underlining the importance of massive young stars in the energetics of these objects. The brightest rovibrational line, the S(1) line, is typically fainter MoorwoodOliva88 ; MoorwoodOliva90 ; Puxleyetal88 ; Puxleyetal90 ; Vanzietal96 ; VanziRieke97 . In contrast, in ULIGs the S(1) line is significantly brighter than the line, which is often not even detected Goldaderetal95 ; Murphyetal01 . This behaviour shows that ULIGs are not just scaled-up starburst galaxies. An extreme case of is presented by (Fig. 1), where the S(1) line is 40 times brighter than . The low ratio of luminosity to FIR luminosity in ULIGs has been used to argue against star formation as the power source of ULIGs, for instance in the nearby ULIG , where a starburst with the low luminosity observed can account for at most 10% of the bolometric luminosity of the galaxy Armusetal95 ; Scovilleetal97 . However, spectroscopy of ULIGs at longer wavelengths with the Infrared Space Observatory (ISO) revealed bright emission lines from powerful starbursts, which are the dominant power source in most of the objects studied, but are obscured at shorter wavelengths Genzeletal98 . Motivated by these results, in this paper the physical processes revealed by the -band spectra of ULIGs are reexamined in the context of the starburst scenario. In Sect. 2 the origin of the line emission is discussed, while Sect. 3 addresses the faintness of .
2 Origin of the H2 emission in ULIGs
The most extreme vibrational emission is found in the nearby luminous merger : is emitted in the S(1) line alone (for and with no correction for extinction). This line contains 0.012% of the bolometric luminosity of , which is considerably higher than any other galaxy VanDerWerfetal93 . Together the vibrational lines may account for 0.1% of the total bolometric luminosity.
Imaging of the S(1) emission from has shown that the emission peaks between the two remnant nuclei of the merging system VanDerWerfetal93 . This morphology provides a unique constraint on the excititation mechanism, since it argues against any scenario where the excitation is dominated by the stellar component (e.g., UV-pumping, excitation by shocks or X-rays from supernova remnants). Instead, the favoured excitation mechanism is slow shocks in the nuclear gas component, which, as shown by high resolution interferometry in the CO line Tacconietal99 , also peaks between the nuclei of .
What is the role of these shocks? In the shocks mechanical energy is dissipated and radiated away, mostly in spectral lines (principally , CO, and [O i] lines). This energy is radiated away at the expense of the orbital energy of the molecular clouds in the central potential well. Consequently, the dissipation of mechanical energy by the shocks will give rise to an infall of molecular gas to the centre of the potential well. Therefore, the vibrational lines measure the rate of infall of molecular gas into the central potential well. This conclusion can be quantified by writing
| (1) |
where is the total luminosity radiated by the shocks and the dissipation rate of mechanical energy, giving rise to a molecular gas infall rate given by
| (2) |
where is the circular orbital velocity at the position where the shock occurs.
Using a -band extinction of VanDerWerfetal93 , the total luminosity of vibrational lines from becomes ; inclusion of the purely rotational lines observed with ISO approximately doubles this number, so that .
In order to use this number to estimate , it is necessary to establish more accurately the fraction of the emission that is due to infalling gas. Observations with NICMOS on the Hubble Space Telescope (HST) provide the required information (Fig. 2) VanDerWerfetal01 . The NICMOS image shows that the emission consists of a number of tails (presumably related to the superwind also observed in emission), and concentrations assocated with the two nuclei, and a further concentration approximately (but not precisely) between the two nuclei. The relative brightness of the emission from the southern nucleus is deceptive, since this nucleus is much better centred in the filter that was used for these observations than the other emission components, in particular the northern nucleus. Taking this effect into account, it is found that 32% of the total flux is associated with the southern nucleus, 16% is associated with the northern nucleus, and 12% with the component between the two nuclei, the remaining 40% being associated with extended emission. Using inclination-corrected circular velocities of and for the southern and northern nucleus respectively Teczaetal00 , and of for the central component Tacconietal99 , the mass infall rates derived using – are for the southern nucleus, for the northern nucleus and for the central component.
The derived molecular gas inflow rate to the two nuclei is remarkably close to the mass consumption rate by star formation of approximately , indicating that the emission from the nuclei directly measures the fueling of the starbursts in these regions. This analysis shows that the central regions of are being fueled at a rate sufficient to maintain starburst activity at the level required to account for the FIR luminosity.
3 Dusty, compact starbursts in ULIGs
Accepting the starburst model, the faintness of and other recombination lines remains to be addressed. As pointed out in Sect. 1, it is evident that selective extinction towards the regions of most recent massive star formation plays a significant role in suppressing the emission. Can this effect be quantified?
The nearby ULIG has been studied in detail with the ISO satelite. Based on an upper limit on the ratio of the [S iii] 18 and lines, and a high over flux ratio, an extinction , located purely in an absorbing foreground screen was proposed Sturmetal96 . However, the supporting arguments have now weakened significantly. In the first place, a better understanding of the calibration of the [S iii] spectrum has made the upper limit on the [S iii] 18 to flux ratio less strict by approximately a factor of two Genzeletal98 . Secondly, the flux from ISO Sturmetal96 is almost certainly an overestimate: the line displays, on top of a higly structured baseline, a double-peaked structure, which is absent in any other line (including long-wavelength lines such as the well-detected [S iii] line). The velocity difference between the two peaks in is approximately and therefore cannot be attributed to motion of the two nuclei of , which have a radial velocity difference of approximately Scovilleetal97 . The same velocity difference of is found in long-slit spectra of the nuclei Larkinetal95 . An integrated high-resolution spectrum (Fig. 3) shows no trace of a double-peaked structure, indicating that the high flux found with ISO is most likely dominated by structure in the spectral baseline. The extinction derived from the / ratio should thus be used as an upper limit. A further argument against an obscuring foreground screen with is furnished by the derived Lyman continuum fluxes, which increase as as shorter wavelength tracers are used Genzeletal98 , a behaviour suggesting that the extinction has been overestimated. Finally, a strong limit on the presence of an intense, highly obscured, but otherwise normal starburst follows from the upper limit to the free-free emission at millimetre wavelengths Scovilleetal97 . These results indicate that either a foreground screen with a lower visual extinction, or a model with mixed emission and absorption needs to be adopted.

This result does however not imply the presence of a strongly aged starburst, or an additional source of power in , since the preceding analysis ignored the role of Lyman continuum absorption by dust within the ionized regions. If most of the ionizing radiation is absorbed by dust grains rather than hydrogen atoms, a dust-bounded (rather than hydrogen-bounded) nebula results, and all tracers of ionized gas (recombination lines, fine-structure lines, free-free emission) will be suppressed. If the H ii regions in are principally dust-bounded, the observational properties of can be accounted for, even with only moderate extinction. Since the dust would also absorb far-ultraviolet radiation longwards of the Lyman limit, the formation of photon-dominated regions would also be suppressed, and the thus the same mechanism can account for the faintness of the [C ii] line in and other ULIGs Fischeretal99 .
Is the starburst dominated by dust-bounded H ii regions? The average molecular gas density in the nuclear molecular complex in is Scovilleetal97 . The strong emission from high dipole moment molecules such as CS, HCO+ and HCN argues for even higher densities: of molecular gas (i.e., all of the gas in the nuclear complex) has a density Solomonetal90 . At such densities the ionized nebulae created by hot stars are compact or ultracompact H ii regions, where 50 to 99% of the Lyman continuum is absorbed by dust WoodChurchwell89 . Observationally, hydrogen-bounded and dust-bounded H ii regions can be distinguished by the quantity /: for a wide range of parameters, implies that the nebula is hydrogen-bounded, while implies that the nebula is dust-bounded Bottorffetal98 . For , the luminosity of (from the spectrum in Fig. 3, with a distance of ) implies assuming an obscuring foreground screen with (a model consistent with the results discussed above). Even with a foreground extinction of (which is most likely an overestimate, as discussed above), a ratio would result, so that even in that case the absorption of Lyman continuum radiation by dust would play a significant role. The star formation takes place in (ultra)compact H ii regions, where all of the usual tracers of ionized gas (recombination lines, fine-structure lines, free-free emission) are quenched, not extincted. While this result significantly complicates the interpretation of diagnostics of massive star formation in ULIGs, it is save to conclude that the properties of can be accounted for by an intense, and significantly (but not extremely) obscured starburst. There is no reason to invoke the presence of extreme extinction, a strongly aged starburst, or an additional power source in .
References
- (1) L. Armus, D.L. Shupe, K. Matthews, B.T. Soifer, G. Neugebauer: ApJ 440, 200 (1995)
- (2) M. Bottorff, J. Lamothe, E. Momjian, E. Verner, D. Vinković, G. Ferland: PASP 110, 1040 (1998)
- (3) J. Fischer et al.: ‘An LWS spectroscopic survey of infrared bright galaxies’. In: The universe as seen by ISO, ed. P. Cox, M.F. Kessler (ESA SP-427, ESA Publications Division, Noordwijk, 1999) pp. 817–820
- (4) R. Genzel et al.: ApJ 498, 579 (1998)
- (5) J.D. Goldader, R.D. Joseph, R. Doyon, D.B. Sanders: ApJ 444, 97 (1995)
- (6) J.E. Larkin, L. Armus, R.A. Knop, K. Matthews, B.T. Soifer: ApJ 452, 599 (1995)
- (7) A.F.M. Moorwood, E. Oliva: A&A 203, 278 (1988)
- (8) A.F.M. Moorwood, E. Oliva: A&A 239, 78 (1990)
- (9) T.W. Murphy, B.T. Soifer, K. Matthews, L. Armus, J.R. Kiger: AJ 121, 97 (2001)
- (10) P.J. Puxley, T.G. Hawarden, C.M. Mountain: MNRAS 234, 29P (1988)
- (11) P.J. Puxley, T.G. Hawarden, C.M. Mountain: ApJ 364, 77 (1990); erratum ApJ 372, 73 (1991)
- (12) N.Z. Scoville, M.S. Yun, P.M. Bryant: ApJ 484, 702 (1997)
- (13) P.M. Solomon, S.J.E. Radford, D. Downes: ApJ 348, L53 (1990)
- (14) E. Sturm et al.: A&A 315, L133 (1996)
- (15) L.J. Tacconi, R. Genzel, M. Tecza, J.F. Gallimore, D. Downes, N.Z. Scoville: ApJ 524, 732 (1999)
- (16) M. Tecza, R. Genzel, L.J. Tacconi, S. Anders, L.E. Tacconi-Garman, N. Thatte: ApJ 537, 178 (2000)
- (17) P.P. van der Werf, F.P. Israel: in preparation (2001)
- (18) P.P. van der Werf, R. Genzel, A. Krabbe, M. Blietz, D. Lutz, S. Drapatz, M.J. Ward, D.A. Forbes: ApJ 405, 522 (1993)
- (19) P.P. van der Werf, A.F.M. Moorwood, F.P. Israel: in preparation (2001)
- (20) L. Vanzi, G.H. Rieke: ApJ 479, 694 (1997)
- (21) L. Vanzi, G.H. Rieke, C.L. Martin, J.C. Shields: ApJ 466, 150 (1996)
- (22) D.O.S. Wood, E. Churchwell: ApJS 69, 831 (1989)