Deep VLT spectroscopy of the Radio Galaxy MRC 2104–242††thanks: Based on observations at the ESO VLT Antu telescope
Abstract
We present spectroscopic observations of the rest-frame UV line emission around radio galaxy MRC 2104–242 at , obtained with FORS1 on VLT Antu. The morphology of the halo is dominated by two spatially resolved regions. Ly is extended by 12″ along the radio axis, C and He are extended by 8″. The overall spectrum is typical for that of high redshift radio galaxies. The most striking spatial variation is that N is present in the spectrum of the region associated with the center of the galaxy hosting the radio source, the northern region, while absent in the southern region. Assuming that the gas is photoionized by a hidden quasar, the difference in N emission can be explained by a metallicity gradient within the halo, with the northern region having a metallicity of Z 1.5 Z⊙ and Z 0.4 Z⊙ for the southern region. This is consistent with a scenario in which the gas is associated with a massive cooling flow or originates from the debris of the merging of two or more galaxies.
Key Words.:
cosmology: early Universe – galaxies: active – galaxies: evolution – galaxies: individual: MRC 2104–242 – galaxies: kinematics and dynamics1 Introduction
High redshift (i.e. ) radio galaxies (HzRGs) are believed to be the progenitors of massive elliptical galaxies (e.g. Best et al. 1998). Therefore, these galaxies are an important tool for studying the epoch of galaxy formation in the early universe. HzRGs are often surrounded by giant halos of ionized gas, which radiate luminous emission lines in the UV/optical part of the spectrum. The continuum and the line emission, which can be spatially extended by as much as 100 kpc, are often elongated along the direction of the radio axis (Chambers et al. 1987; for a review see McCarthy 1993).
One of the most important questions in studying HzRGs concerns the ionization of the halo. There is striking evidence that the mechanism for ionization is either photo-ionization by the active nucleus Villar-Martín et al. (1997) or shock ionization by jets interacting with the gaseous medium Best et al. (2000). Another important question involves the origin of the emission line gas. If its origin is external to the radio galaxy, it can be gas associated with galaxy merging Heckman et al. (1986) or the result of a massive cooling flow from the intracluster medium Crawford & Fabian (1996). Alternatively, the gas could have been driven out by a starburst-wind or by shocks associated with the radio source. Studying the properties of the gas in detail may help to make a distinction between these scenarios.
In this letter we present spectroscopic observations of the extended emission line halo around MRC 2104–242. This radio source is identified with a galaxy at and is one of the brightest known HzRGs in Ly McCarthy et al. (1990). Narrowband Ly images show a total extent of 12″ (i.e. 136 kpc111We adopt H km s-1 Mpc-1, q. At this implies a linear size scale of 11.3 kpc arcsec-1.) distributed in two distinct regions separated by 6″. Spectroscopy shows that both regions have large FWHM ( km s-1), large rest-frame equivalent widths (330 and 560 Å) and a velocity difference of 500 km s-1 McCarthy et al. (1996); Koekemoer et al. (1996); Villar-Martín et al. 1999a . The two regions also emit other lines and faint continuum. HST imaging (WFPC2 and NICMOS) has shown that the host galaxy is very clumpy, suggestive of a merging system (see Pentericci et al. 1999 for an optical-radio overlay). One of the bright components hosted by the northern region is prominent in near-infrared emission and therefore it is assumed to be the center of the galaxy hosting the radio source. This nucleus and the other components in this region are not resolved in our spectra, so we will refer to the whole as the northern region. The southern region is associated with a narrow filamentary component of 2″ oriented in the direction of the radio axis.
The outline of this letter is as follows. In §2, we describe our VLT observations and we present the basic results in §3. In §4, we show evidence for a metallicity gradient between the two regions and in §5 we will discuss how this relates to the origin of the halo.
Throughout this letter we shall abbreviate the emission lines as follows: N for N 1240, C for C 1549, He for He 1640, Si for Si 1400 and O for O 1665.
2 VLT observations
The observations were carried out in service mode on UT 1999 September 25 with FORS1 on the 8.2m VLT Antu telescope (ESO-Chile). We used grism 600B with a 1″ wide slit. A 22 readout binning was used in order to increase the signal-to-noise ratio (S/N). The resultant spectral resolution was 6 Å (FWHM). The slit was positioned along the brightest components and the filamentary structure at a position angle of 2∘ North through East. The exposure time was 33600s. The seeing during the observations was 1″ and conditions were photometric. Data reduction followed the standard procedures using the NOAO IRAF long-slit package. We bias-subtracted the individual frames and divided them by a normalized dome flat-field frame. Cosmic rays were removed from the background subtracted images. We subtracted sky lines and shifted the images into registration using stars on the CCD. For wavelength calibration we used comparison spectra of a He and a HgCd lamp. For flux calibration we observed the spectrophotometric standard star LTT7987. The resulting photometric scale is believed to be accurate at a level of 15 %. We corrected the spectra for atmospheric extinction and applied a galactic extinction correction of E(BV)0.057 determined from the dust maps of Schlegel, Finkbeiner & Davis schl98 (1998).
The extraction apertures centered on the two regions were resp. 4″ and 3″, chosen to include most of the emission while keeping high S/N for the weaker lines. We measured wavelengths, fluxes, FWHM and equivalent widths (EW) by fitting Gaussian profiles to the lines Röttgering et al. (1997). The measured FWHM was deconvolved for the instrumental profile assuming Gaussian distributions.
3 Results
The main observational results can be summarized as follows:
1. Figs. 1 and 2 show the spectra of the northern and southern regions.
Both regions show Ly, C and He and weak Si , O .
N is detected in the northern region, but it is absent in the southern.
The emission line properties are listed in Table 1.
For the undetected N in the southern region we have calculated an upper limit
assuming a Gaussian line shape with a peak 3 times the rms of the
continuum at the expected wavelength and a width comparable to that of
N in the northern region.
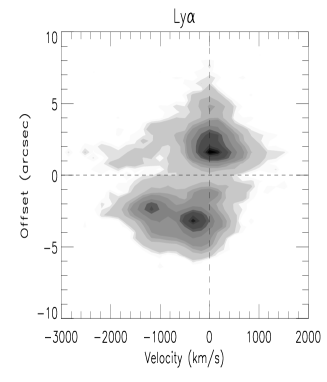
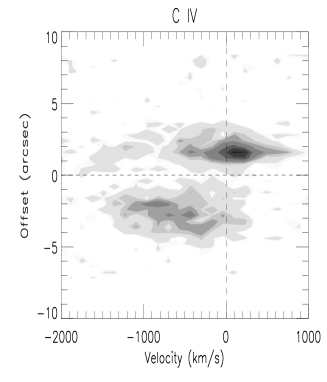
2. Fig. 3 shows the two-dimensional emission line structure of Ly, C and He . The peak of the C emission in the northern region is redshifted
with respect to that of Ly by 100 km s-1, while that of He is blueshifted by 150 km s-1.
In the southern region, Ly shows two separate peaks shifted blueward from
the northern region by 1000 and 500 km s-1. This two-peak
distribution is also seen in C and He , albeit at low S/N. The fact that it
is observed in He could indicate kinematical substructure
in the halo and that the dip in the Ly profile is not due to H I absorption.
3. The northern region shows similar FWHM (700 km s-1) for Ly, C and He .
In the southern, Ly and C have high FWHM (1000 km s-1),
while that of He is a factor 1.5 lower.
4. Within the errors, the emission line ratios of the two regions are the same,
only those involving N are discrepant. The N /C and N /He line ratios
are at least 4 and 3 times higher in the northern region compared to the
southern.
4 Difference in N emission from the two regions: evidence for a metallicity gradient?
We have detected N in the northern region, which is seldom present at a significant level in HzRGs Röttgering et al. (1997); De Breuck et al. (2000). In the southern region we detected no N , while the other line-ratios are similar in both regions. Vernet et al. (1999) found that HzRGs follow a sequence in N /C vs. N /He , parallel to the relation defined by the broad line regions (BLR) of quasars found by Hamann & Ferland (1993). These authors showed that this sequence can be explained by a variation of the metallicity of the BLR, caused by a rapidly evolving starburst in the massive galactic core. Villar-Martín et al. (1999) showed that both shock ionization and photo-ionization could not explain either the N correlation, or the strong N emission in some HzRGs (e.g. van Ojik et al. 1994). They found that a model of photo-ionization and variation of metallicity best explained both properties. Therefore, we conclude that the difference in N emission can be explained only by a metallicity gradient within the halo. Using the metallicity sequence with quadratic nitrogen enhancement (N Z2) from Vernet et al. ver00 (2000) we find a metallicity of Z 1.5 Z⊙ for the northern region and an upper limit of Z 0.4 Z⊙ for the southern (Fig. 4).
5 Discussion
The supersolar metallicity of the gas associated with the central part of the galaxy implies that 2104–242 has experienced a period of intense star formation. Assuming that the difference in N emission found within the halo is due to a metallicity gradient, it is likely that the emitting


| northern region | southern region | |||||||
|---|---|---|---|---|---|---|---|---|
| Line | Peak (Å) | Fluxa | FWHM (km s-1) | EW (Å) | Peak (Å) | Fluxa | FWHM (km s-1) | EW (Å) |
| Ly | ||||||||
| N | ||||||||
| Si | ||||||||
| C | ||||||||
| He | ||||||||
| O | ||||||||
| a Flux is given in units of 10-16 erg s-1 cm-2 | ||||||||

gas near the center and the gas further out are in different stages of evolution.
The infall of gas by massive cooling flows is believed to be an important process in galaxy formation (Crawford & Fabian 1996). In this scenario, gas cools from a primordial halo surrounding the radio source and provides the material from which the galaxy is made. This could also be the case for 2104–242. Fardal et al. (2000) recently examined cooling radiation from forming galaxies, focusing on Ly line luminosities of high redshift systems. They find that a significant amount of the extended Ly emission can arise from cooling radiation.
However, because the two regions of 2104–242 both show emission lines from other elements than H and He, at least some of the gas must already have been processed in stars in the past. The HST images revealed that this galaxy actually consists of a number of larger and smaller components Pentericci et al. (1999), which supports the general idea that galaxies are formed by a process of hierarchical buildup Kauffmann (1995). We have also found evidence for kinematical substructure within the halo. Therefore, the emission line halo may be the result of gas associated with such intensive galaxy merging.
Alternatively, the gas in the halo may be the result of other mechanisms. It may have been driven out by strong jet-cloud interactions. Line widths as large as 1500 km s-1 are common in HzRGs, which indicate extreme, non-gravitational motions. The alignment effect also suggests that jet-cloud interactions occur and for some sources there is evidence of shock ionization (Best et al. 2000). However, large radio sources like 2104–242 are less likely to be ’shock-dominated’, because the shockfronts have passed well beyond the emission line halo.
Also, the gas could have been expelled by a superwind following an enormous starburst. We have shown evidence for intense star formation in 2104–242. Binette et al. (2000) showed that radio galaxy 0943–242 is surrounded by a vestige gas shell of very low metallicity. They conclude that this gas has been expelled from the parent galaxy during the initial starburst at the onset of its formation.
We conclude that the emission line ratios are well explained by a combination of photo-ionization and a metallicity gradient. This is consistent with scenarios in which the halo is formed by gas falling onto the radio galaxy located at the center of a forming cluster or by gas associated with intense galaxy merging.
Acknowledgements.
We acknowledge productive discussions with Wil van Breugel and Laura Pentericci.References
- Best et al. (1998) Best P., Longair M., Röttgering H., 1998, MNRAS 295, 549
- Best et al. (2000) Best P., Röttgering H., Longair M., 2000, MNRAS 311, 23
- (3) Binette L., Kurk J., Villar-Martín M., Röttgering H., 2000, A&A 356, 23
- Chambers et al (1987) Chambers K., Miley G., van Breugel W., 1987, Nat 329, 604
- De Breuck et al. (2000) De Breuck C., Röttgering H., Miley G., van Breugel W., Best P., 2000, A&A 362, 519
- (6) Fardal M. et al., 2000, in press, astro-ph/0007205
- Crawford & Fabian (1996) Crawford C., Fabian A., 1996, MNRAS 282, 1483
- Hamann & Ferland (1993) Hamann F., Ferland G., 1993, ApJ 418, 11
- Heckman et al. (1986) Heckman T. et al., 1986, ApJ 311, 526
- Kauffmann (1995) Kauffmann G., 1995, MNRAS 274, 161
- Koekemoer et al. (1996) Koekemoer A., van Breugel W. & Bland-Hawthorn J., 1996, In: M. Bremer et al. (eds.) “Cold Gas at High Redshifts”, Kluwer, p. 385
- McCarthy et al. (1990) McCarthy P., Kapahi V., van Breugel W., Subrahmanya C., 1990, AJ 100, 1014
- McCarthy et al. (1993) McCarthy P., 1993, ARA&A 31, 639
- McCarthy et al. (1996) McCarthy P., Baum S., Spinrad H., 1996, ApJS 106, 281
- Pentericci et al. (1999) Pentericci L. et al., 1999, A&A 341, 329
- Röttgering et al. (1997) Röttgering H. et al., 1997, A&A 326, 505
- (17) Schlegel D., Finkbeiner D., Davis M., 1998, ApJ 500, 525
- van Ojik et al. (1994) van Ojik R. et al., 1994, A&A 289, 54
- (19) Vernet J. et al., 2000, in press, astro-ph/0010640
- Villar-Martín et al. (1997) Villar-Martín M., Tadhunter C., Clark N., 1997, A&A 323, 21
- (21) Villar-Martín M., Binette L., Fosbury R., 1999, A&A 346, 7
- (22) Villar-Martín M., Fosbury R., Binette L., Tadhunter C., Rocca-Volmerange B., 1999, A&A 351, 47