Time-Variable Emission from Transiently Accreting Neutron Stars In Quiescence due to Deep Crustal Heating
Abstract
Transiently accreting neutron stars in quiescence ( ) have been observed to vary in intensity by factors of few, over timescales of days to years. If the quiescent luminosity is powered by a hot NS core, the core cooling timescale is much longer than the recurrence time, and cannot explain the observed, more rapid variability. However, the non-equilibrium reactions which occur in the crust during outbursts deposit energy in iso-density shells, from which the thermal diffusion timescale to the photosphere is days to years. The predicted magnitude of variability is too low to explain the observed variability unless – as is widely believed – the neutrons beyond the neutron-drip density are superfluid. Even then, variability due to this mechanism in models with standard core neutrino cooling processes is less than 50 per cent – still too low to explain the reported variability. However, models with rapid core neutrino cooling can produce variability by a factor as great as 20, on timescales of days to years following an outburst. Thus, the factors of few intensity variability observed from transiently accreting neutron stars can be accounted for by this mechanism only if rapid core cooling processes are active.
keywords:
stars: neutron – X-rays: binaries – nuclear reactions, nucleosynthesis, abundances1 Introduction
Many neutron star (NS) X-ray binaries go through accretion outbursts ( ) followed by long periods (months–decades) of relative quiescence ( ). The origin of these outbursts remains under debate, although many agree that in the wider binaries an accretion disk instability is the cause [Van Paradijs 1996]. During these outbursts, on the order of g may be accreted, over a period of few-30 days (for a review of these transients see [Tanaka & Shibazaki 1996, Campana et al. 1997, Chen et al. 1997]).
Following an outburst, the NSs return to quiescence, and have typically been detected with luminosities in the – range [Van Paradijs et al. 1987, Verbunt et al. 1994, Asai et al. 1996a, Asai et al. 1996b, Campana et al. 1998a, Garcia & Callanan 1999, Rutledge et al. 1999, Campana et al. 2000, Rutledge et al. 2000]. The quiescent X-ray spectrum has been described as being comprised of two components, a soft (black-body 0.2 keV) thermal component, and a power-law component dominating the emission above 2 keV [Asai et al. 1996b, Campana et al. 1998b, Campana et al. 2000].
The basal luminosity has been attributed to continued accretion in quiescence [Van Paradijs et al. 1987], possibly through an advection-dominated accretion flow [Narayan et al. 1997, Menou et al. 1999]; accretion onto the NS magnetosphere [Campana et al. 1997] following a “propeller phase”, in which the NS magnetosphere is larger than the keplerian orbit with an orbital period equal to the spin period of the NS [Illarionov & Sunyaev 1975, Stella et al. 1986]; and to thermal emission from a hot NS core, heated by non-equilibrium reactions deep in the NS crust [Brown et al. 1998, BBR98 hereafter]. Of these possibilities, only deep-crustal heating predicts the similar luminosities observed in the thermal spectral component of these systems. The observed temperatures of the thermal component (=0.08–0.20 keV) are as expected in this scenario. In addition, the emission area radii of the thermal component are consistent with theoretically predicted NS radii (10 km; [Rutledge et al. 1999, Rutledge et al. 2000]); this supports the interpretation of this spectral component as a thermal NS photosphere. It is possible that the quiescent luminosity is due to a combination of these three mechanisms, in which case they are only separable by their spectral and intensity variability properties.
The detected flux during quiescence from some of these transients has been observed to vary, by a factor of as much as 3 or more, over timescales of days to years. No clear cause of this variability has yet emerged. There are three means discussed in the literature:
-
1.
Variable accretion onto the NS surface. If accretion onto the NS surface dominates the luminosity in quiescence, changes in the accretion rate could account for variations in the thermal (0.2 keV) part of the spectrum, since the photospheric spectrum at the low implied accretion rate is thermal in the absence of a shock [Zampieri et al. 1995], assuming quasi-steady-state accretion at the appropriate accretion rates.
-
2.
Variable accretion onto the NS magnetosphere. The power-law spectral “tail” which can dominate emission above 2 keV may be due to accretion onto a NS magnetosphere [Campana et al. 1998a]. Variations in accretion rate onto the magnetosphere would cause intensity variability in this power-law component.
-
3.
Variable absorption column density (). Outbursts may be accompanied by outflows, increasing locally the column density of absorbing material. This would cause variations in the absorption column density (), which may account for the factors of 2-3 variation in intensity observed [Rutledge et al. 1999].
Moreover, intensity variability due to accretion – either photospheric or magnetospheric – would likely be stochastic; there have been no theoretical estimations of its magnitude or variability timescale. In the variable- scenario, the amount of absorption should decrease (and intensity, increase) with time after outburst.
In this paper, we investigate the time dependence of the thermal emission mechanism proposed by BBR98. Compression of the NS crust by accretion during outbursts induces electron captures, neutron emissions, and pycnonuclear reactions deep in the crust (at densities g cm-3), and these reactions deposit MeV per accreted baryon of heat into the crust [Haensel & Zdunik 1990b]. BBR98 argued that these reactions heat the NS core to an equilibrium temperature K, and, during quiescence, the hot core shines with a typical luminosity , where is the mean accretion rate, averaged over the thermal time of the core, i.e., many recurrence intervals . Consequently, the core luminosity is not expected to change on timescales shorter than its thermal time, i.e., yrs.
Transient X-ray emission from the non-equilibrium reactions has not been previously considered. Similar work regarding transient energy deposition in NSs has either focussed on the atmosphere, well above the crust [Eichler & Cheng 1989], or investigated the thermal response to pulsar glitches [van Riper 1991, Chong & Cheng 1994, Hirano et al. 1997, Cheng et al. 1998]. However, the crucial difference is that the depths and amounts of energy deposited by non-equilibrium reactions can, at least in principle, be obtained from an ab initio calculation (and have been, for the case of iron, by [Haensel & Zdunik 1990b]), while, on the other hand, the total amount of energy deposited by the crust-breaking glitches is not precisely known (it is bounded by ), and neither the depth nor the distribution of energy deposition is well constrained.
Colpi et al. [Colpi et al. 2001] examined the effect of non-equilibrium reactions on the temperature of the core. They found that in transient NSs with recurrence timescales of 1 year, the core heats to an equilibrium temperature in yrs, after which the core temperature varies by 0.5% in response to the periodic input of energy from the non-equilibrium reactions during individual accretion outbursts. They confirmed the steady-state assumption made by BBR98. Our study is complimentary to that of Colpi et al., as we examine the time dependence of the temperature in the crust and the thermal luminosity from the NS surface between outbursts. We follow in detail the thermal relaxation of the crust and find that, depending on the microphysics and the accretion history, the magnitude of the variability can be as small as %, or as large as a factor of 20. Only the reactions that deposit energy at depths where lead to variable thermal emission. The luminosity due to individual reactions is largely blended together, simply because the difference between the of adjacent reactions is typically much shorter than . However, the emission from the reactions in the outer crust as a whole is typically well-separated from that due to the reactions in the inner crust, resulting in characteristic “double-hump” luminosity evolution. In addition, the amplitude of the variability is not simply related to the energy deposited in the individual reactions. We quantify the dependence of this variability on the conductivity of the crust and the physics of neutrino emission in the core.
In §2 we briefly recount the observational evidence for quiescent intensity variability. In §3, we describe detailed calculations of time evolution in the thermal NS flux, in response to a “delta-function” (1-day long) accretion event, for different time-averaged accretion rates (and thus core temperatures), different dominant conductivies and core neutrino cooling prescriptions We also present the resulting light curves in this section. Finally, in §4, we compare these results with observations, and in §5, we conclude.
2 Observations of Variability in Quiescence
Intensity variability in quiescent transients is, at present, not well-studied observationally, largely due to the low signal-to-noise of the data, from a small number of observations (only a few of which are made with the same instrumentation), and different assumed intrinsic energy spectra. Multiple observations in quiescence (at ) are found in the literature only for three NSs, Cen X4, 4U 2129+37, and Aql X1.
For Cen X-4, Van Paradijs et al. [Van Paradijs et al. 1987] found the luminosity increased by a factor of over 5.5 yr (Jul 1980–Feb 1986), for the same assumed thermal bremmstrahlung spectrum. There was no intervening outburst observed, and the observations were made using two different instruments (EXOSAT/LE and Einstein/IPC). Campana et al. [Campana et al. 1997] reanalysed these data, and contrarily concluded that they are consistent with the same luminosity. Also, Campana found that in observations with ROSAT/HRI of Cen X4 over a 4-8 day period, the source countrate varied by 3, with an average luminosity of 7 ; Campana did not discuss whether the 1995 ROSAT/HRI observations were consistent with the luminosities of the EXOSAT and Einstein observations; a comparison between their values and passbands indicates that the luminosities of Van Paradijs et al. were more than a factor greater, although part of this may be due to a different assumed spectrum. Finally, Rutledge et al. [Rutledge et al. 2001] found that Cen X-4 varied by 18% (0.2-2 keV) during a 10 ksec observation, while the 0.5-10.0 keV luminosity had decreased by 408% in comparison with an ASCA observation taken 5 years previously.
Aql X-1 was also found to have a variable flux in quiescence [Rutledge et al. 1999] between three observations with ASCA (Oct 1992, Mar 1993, and Oct 1996). If the same intrinsic spectrum is assumed, the three observations are inconsistent with having the same intensity with high confidence (probability=). The difference in observed flux is a factor of 2-3.
4U 2129+37 decreased in flux by a factor of 3.40.6 between Nov-Dec 1992 (ROSAT/HRI) and March 1994 (ROSAT/PSPC) [Garcia & Callanan 1999, Rutledge et al. 2000] in the unabsorbed luminosity, for the same assumed spectrum.
The observations of Cen X-4, with ROSAT/HRI, and of Aql X-1, with ASCA are the only two instances of repeated observations with the same instrumentation. Cen X-4 has not been observed in outburst since May, 1979 [Chen et al. 1997], while Aql X-1 goes into outburst every 220 days, and it therefore seems likely that there were intervening outbursts between the three ASCA observations.
Thus, observations of transiently accreting NSs in quiescence, taken at face value, indicate that their quiescent luminosities vary by a factor of up to 35 on timescales of days to years. However, it is not clear what fraction of this variability is intrinsic, and what can be attributed to systematic differences in instrumentation.
3 Thermal Emission from the Crust
We now describe our simulations of the thermal relaxation of the crust following an accretion outburst, and the resulting time dependence of the quiescent thermal emission. As argued by BBR98 and confirmed by Colpi et al. [Colpi et al. 2001], the nuclear energy release in the crust heats the NS core to a temperature corresponding to steady accretion at the corresponding time-averaged accretion rate. We performed several simulations starting with a very cold NS and subjecting it to a series of accretion outbursts and found that indeed, the core is heated to the appropriate temperature on a yr timescale, in agreement with Colpi et al. [Colpi et al. 2001]. For the remainder of our analysis we first construct a steady-state thermal model corresponding to the time-averaged , and then subject it to outbursts. After several outbursts, the model reaches a limit cycle. In this paper, we report the results of only these latter simulations. Our accretion events (“outbursts”) are 1-day long “delta-functions”, with no accretion outside of these events. More realistic time-evolved light-curves may in principle be found by convolving our “delta-function” thermal response light curves with a more realistic outburst accretion time-dependent profile for the small perturbation light curves (1); lightcurves in which the variations are larger would require a more detailed calculation. We simulate two different outburst recurrence timescales (1 yr and 30 yr) and three time-averaged accretion rates (, , and /yr). As we are primarily interested in illustrating the response of the NS surface flux from the crust and core to a “delta-function” accretion profile, it is unimportant that the implied 1-day accretion rates may be super-Eddington, and we do not include accretion luminosity in our results.
3.1 Microphysics of the Crust and Core
The hydrostatic and steady-state thermal models of the crust used in this paper are substantially identical to the ones used by Ushomirsky, Cutler, & Bildsten [Ushomirsky et al. 2000]. We briefly recount the major ingredients of these models, and then describe our time-evolution code.
Since the thermal timescale for the crust (days to years, see below) is so much longer than the sound crossing time (milliseconds), and the equation of state is nearly independent of temperature, the hydrostatic structure of the crust is effectively decoupled from its thermal evolution. Therefore, one can solve the thermal evolution equations assuming that the density and pressure as a function of the position in the star are fixed. This approach to modeling the thermal state of a neutron star is fully described by Brown [Brown 2000] and is followed here.
The composition of the crust (i.e., the mass and charge of the nuclei, as well as the neutron fraction ) is taken from the tabulation of Haensel & Zdunik [Haensel & Zdunik 1990b, Haensel & Zdunik 1990a]. The pressure is the sum of contributions from degenerate, relativistic electrons and free neutrons [Negele & Vautherin 1973] at densities exceeding neutron drip ( g cm-3, [Haensel & Zdunik 1990a]). With the equation of state as described above, we solve the Newtonian equations of hydrostatic balance (which, for a thin crust, are exactly equivalent to the fully relativistic equations). We take , and km. Our crust has a thickness of 1.1 km and a mass of .
With the hydrostatic structure specified, we solve the heat equation,
| (1) |
where is the heat capacity per gram (which has contributions from the ionic lattice, degenerate electrons, and free neutrons in the inner crust), is the nuclear energy release, is the neutrino emissivity, and is the thermal conductivity. We neglect the overall downward motion of the material due to accretion, as well as the heat release due to compression (these effects are not important in the crust). Therefore, the only energy source in the crust is the heat release due to non-equilibrium electron captures, neutron emissions, and pycnonuclear reactions. The detailed treatment of the energy release is described in Ushomirsky et al. [Ushomirsky et al. 2000]; we note here that is proportional to the instantaneous mass accretion rate . The total energy released in the crust is taken to be MeV per accreted baryon [Haensel & Zdunik 1990b]. At the temperatures of interest, neutrino losses in the crust are negligible.
Instead of fully modeling the thermal evolution of the NS core, we presume that it is isothermal, and is characterised by a single temperature which is equal to the temperature of the crust at the interface with the core, . The core temperature obeys
| (2) |
where is the total heat capacity, and is the total neutrino emissivity of the core (see below). This approximate treatment is justified because of the core’s large thermal conductivity and heat content. In effect, the temperature of the core changes by a negligible amount compared to the temperature variations in the crust, and the core acts as an energy sink at the bottom edge of the crust. With this approximation, we do not need to integrate the heat equation in the core, and instead use Eq. (2) as a boundary condition for Eq. (1) at the bottom edge of the crust.
To survey the parameter space, we use two different prescriptions for core cooling. “Standard” cooling models use modified Urca [Friman & Maxwell 1979, Yakovlev & Levenfish 1995] and - neutrino bremsstrahlung [Kaminker & Haensel 1999], while “rapid” cooling models assume the presence of a pion condensate [Shapiro & Teukolsky 1983]111Instead, one could assume that the NS mass is high enough to allow direct Urca neutrino emission (see, e.g., Colpi et al. [Colpi et al. 2001]), as the emissivities are similar.. Nucleon superfluidity significantly reduces neutrino emissivity in the core (see [Yakovlev et al. 1999] for an in-depth review). In our calculation we use superfluid parameters collated by Brown [Brown 2000]. Maxwell [Maxwell 1979] argued that at temperatures well below the superfluid transition temperature , this suppression is exponential. However, detailed calculations, summarized by Yakovlev et al. [Yakovlev et al. 1999] show that this suppression is weaker by a power-law factor in , leading to lower core temperatures than one would expect based on the simple exponential reduction in emissivity.
Core heat capacity is the sum of contributions from electrons, neutrons, and protons. However, superfluidity alters the heat capacity of the nucleons (see [Yakovlev et al. 1999] for an in-depth review). At , the reduction of the heat capacity is similar to the suppression of neutrino emissivity. Maxwell [Maxwell 1979] gives a fitting formula for 1S0 superfluid (applicable to neutrons in NS crust and protons in the core), while Levenfish & Yakovlev [Levenfish & Yakovlev 1994] give fitting formulae for the 3P2 superfluid as well (applicable to neutrons in the core). At temperatures of interest ( K) electrons dominate the heat capacity.
Throughout the crust, heat is transported by degenerate, relativistic electrons, and the thermal conductivity is very sensitive to the purity of the crust. If the crust is a pure crystal, electron-phonon scattering [Baiko & Yakovlev 1995] sets the conductivity. However, crusts of accreting neutron stars are unlikely to be pure crystals, since they are composed of (likely quite impure) products of nuclear burning in the upper atmosphere. In fact, calculations of Schatz et al. [Schatz et al. 1999] suggest that the typical values of the impurity parameter , where and are the charge and the fraction of the impurities, could be comparable to the average charge . Following Brown [Brown 2000], we set the absolute lower bound on the conductivity by using electron-ion scattering [Yakovlev & Urpin 1980], which has the same form as electron-impurity scattering with . The much smaller conductivity in the case of electron-impurity scattering with large leads to much longer crustal thermal time, and much smaller variability of quiescent thermal emission. This approach allows us to survey the entire range of possibilities for the crustal conductivity.222The presence of impurities does not dramatically affect the heat capacity of the ionic lattice. While the phonon spectrum will be affected by the presence of impurities, the heat capacity should still approach the Debye limit.
At the top of the crust ( g cm-3) we utilize the results of Potekhin et al. [Potekhin et al. 1997] for the relation between the core temperature to the surface temperature.333Potekhin et al. [Potekhin et al. 1997] express the surface temperature in terms of the temperature in the isothermal region of the crust, which they assume to be at g cm-3. However, since the authors assume that the crust has high thermal conductivity, the temperature difference between g cm-3 and g cm-3 is negligible in their models. They extended the original calculations of Gudmunsson et al. [Gudmundsson et al. 1983] by considering the opacities of accreted envelopes, rather than iron envelopes. Because of the smaller opacity of a light-element envelope, a 50% smaller core temperature is necessary to carry a given flux (see also [Blandford et al. 1983]). The thermal time at the top of the crust, where the outer boundary condtion is applied, is day in our models, so our simulations cannot follow variability on shorter timescales.
3.2 Time-Averaged Quiescent Luminsity
Before describing the results of our time evolution simulations, we discuss the thermal luminosity of neutron stars assuming steady accretion at the rate corresponding to the time average over the outburst recurrence interval . This provides a reasonable estimate of the average luminosity level of neutron star transients. The variations of the luminosity discussed in § 3.3 are excursions about this average level. As outlined in § 3.1, we survey the parameter space by considering two different strengths of core neutrino emission (standard and enhanced), and two different assumptions regarding the conductivity of the crust.
The average core temperature and luminosity of the NS are set by the balance between the heat input due to non-equilibrium reactions in the crust (at the rate ) and heat loss due to neutrino emission from the core () and photon luminosity from the surface (). At the low core temperatures characteristic of NS transients ( K) modified Urca neutrino emission (standard cooling case) is substantially suppressed by nucleon superfluidity and cannot compete with photon losses from the surface of the star, . Therefore, most of the heat deposited by the nonequilibrium reactions is radiated from the surface, i.e., the quiescent luminosity is just (BBR98)
This estimate is independent of the conductivity of the crust. The core temperature, however, depends on the crustal conductivity. If the crustal conductivity is large (i.e., set by electron-phonon scattering), the crust is nearly isothermal, and the core temperature, K yr, can be obtained by simply using the relation of Potekhin et al. [Potekhin et al. 1997]. If the crust has low thermal conductivity, then a substantial temperature gradient is needed to carry the heat from the inner crust to the surface, and the core temperature is K yr (obtained by fitting our detailed calculations).
On the other hand, if rapid cooling processes are allowed in the core, then, despite the suppression of neutrino emission by superfluidity, most of the heat deposited by non-equilibrium reactions is radiated away by neutrinos, . The core temperature is then set by balancing the energy input from the crustal reactions with neutrino-luminosity. Except at very low accretion rates ( yr-1), where superfluid suppression of neutrino emission makes comparable to , a good fit to the results of our calculations for the particular case of enhanced neutrino emission from a pion condensate is K yr, regardless of the conductivity of the crust. The thermal luminosity, however, depends on the relation between the core temperature and that at the top of the crust. When the conductivity is determined by electron-phonon scattering (i.e., is large), the crust is nearly isothermal, and, using the relation of Potekhin et al. [Potekhin et al. 1997], we find
| (4) |
which agrees well with our detailed calculations. On the other hand, if the crustal conductivity is low, the relation between the core and the surface temperature is nontrivial, since an appreciable temperature gradient between neutron drip and the core is needed to carry the flux from the non-equilibrium reactions into the core. In this case, the crust is warmer than in the electron-phonon scattering case, and the thermal luminosity is
| (5) |
(which we obtained by fitting the results of our detailed calculations). Comparing equation (3.2) with (4) and (5), we see that when enhanced neutrino cooling processes are allowed in the NS core, only less than 10% of the non-equilibrium energy release is radiated from the surface, while the remaining % of the heat is emitted in neutrinos. Regardless of the crustal conductivity, the core temperature in the rapid cooling case is set entirely by the core neutrino emission. However, depending on the conductivity of the crust, a temperature gradient between the core and the surface may or may not be present, resulting in different surface temperatures and photon luminosities (cf. Eqs. (4) and (5)). Thus, neutron stars with rapid cooling processes active in the core appear dimmer than those with just standard cooling, and, when their cores are very cold due to rapid neutrino cooling, NSs with high conductivity crusts will appear dimmer than those with lower conductivity crusts.
3.3 Time-Variable Emission
As we now describe, the approximate steady-state luminosity is only a part of the story. Depending on the microphysics of the crust and core, the time-dependent thermal luminosity of the neutron star may either always be very close to the steady-state estimate ( 1%), or vary wildly around it (1).
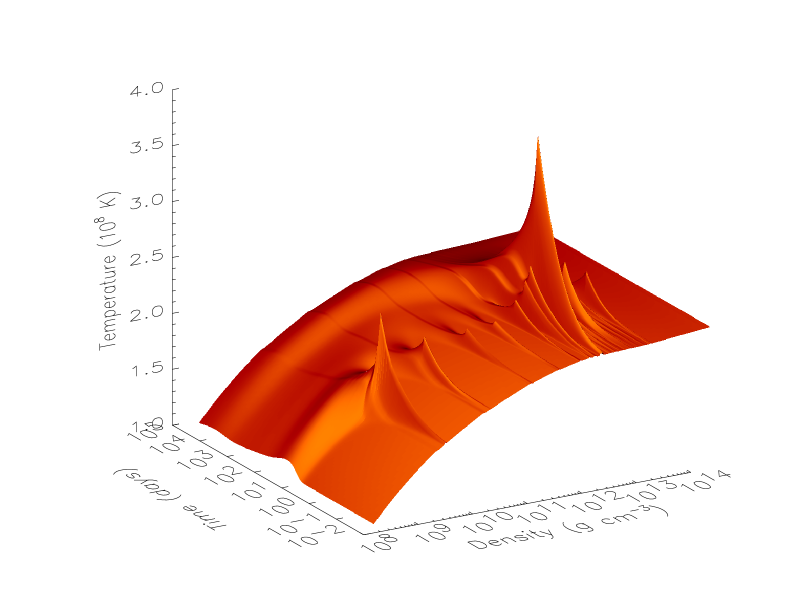
In Figure 1 we display the time evolution of the temperature in the NS crust for a model with low thermal conductivity, standard neutrino emission, yr-1, and =30 yrs. Other models are similar qualitatively, but, of course, differ in the magnitude of variability. The slices of the figure in the plane represent the temperature in the crust as a function of density, and the axis is the time (in days) since the beginning of a 1-day outburst. At the early times, the temperature rises locally at the densities where the energy is deposited. It reaches the maximum after 1 day (i.e., at the end of the outburst). In the ensuing cooling period, the heights of the temperature peaks decrease, and their widths increase due to heat diffusion. After days the “heat wave” due to the very first reaction, at g cm-3 reaches the top of the crust. This temperature increase at the top of the crust is then directly translated into the increase in the thermal luminosity of the NS [Potekhin et al. 1997]. At much later time ( days after the outburst) the heat wave due to the reactions in the inner crust, at g cm-3 reaches the surface. Even though the energy release in these reactions is much larger, the change in the outer boundary temperature and, hence, the variation of the thermal luminosity is much smaller, because the temperature peak spreads out to a width corresponding to roughly the thermal time at the deposition depth as it travels towards the surface of the star, and because some of the heat is conducted into the core of the star. Moreover, while the temperature peaks in the crust due to individual reactions are well-separated at the early times, they become blended together by the time they reach the surface.
Figure 1 clearly suggests that, in order to produce appreciable variability in the thermal emission from the surface, the energy deposition by the non-equilibrium reactions should be sufficient to heat the crust locally by . The typical outburst fluences indicate that only grams of material is accreted during an outburst, and hence erg of energy is deposited in the crust. This amount is rather small, which allows us to place some interesting constraints on the heat capacity of NS crust. The thermal time at the depths where this energy is deposited is at least comparable to and usually much greater than a typical outburst duration. Thus, during the outburst, the heat is not conducted away, but primarily heats the crust locally. Neglecting heat diffusion, the nuclear energy deposited in the region near neutron drip will heat this region by an amount
| (6) | |||
where is the heat capactiy in units of (Boltzmann constant) per baryon and is the pressure at which the energy is deposited. As outlined in § 3.1, the typical crustal temperature is K. Therefore, if the heat capacity of the neutron star crust is per baryon, the crust relaxation luminosity is only a small perturbation on the overall cooling of the core. In order to produce observable variability of quiescent thermal emission, the NS crust must have per baryon.

Figure 2 shows contributions to the heat capacity in the crust, for a representative case of yr-1. In the outer crust, the heat capacity of the ionic latice, per baryon (dotted line, [Shapiro & Teukolsky 1983, van Riper 1991, Chong & Cheng 1994]), dominates. Strongly degenerate, relativistic electrons (dashed line) contribute a negligible amount to the heat capacity everywhere except in the deep inner crust ( g cm). At densities above neutron drip, free neutrons, if not superfluid, would have appreciable heat capacity, approaching per baryon (dot-dashed line). Thus, if the neutrons in the inner crust are not superfluid, their heat capacity is so large that the energy release of erg characteristic of the heating during an outburst is not sufficient to heat the crust substantially. However, it is commonly believed that the neutrons in the inner crust form a superfluid, and their heat capacity is greatly reduced [Maxwell 1979, Yakovlev et al. 1999]. Superfluidity completely suppresses free neutron heat capacity at densities g cm3 (solid line in Figure 2). In this case, the ions dominate the heat capacity in the inner crust, and per baryon. Therefore, observing the evolution of quiescent luminosity provides a test of superfluidity of neutrons: if late-time evolution is observed (), then the neutrons must be superfluid. While this may not be a controversial conclusion, it is worth noting that the only existing observational evidence for superfluidity of crustal neutron gas is the interpretation of pulsar glitches as being initiated in the crust. Variability of quiescent thermal emission from NS transients, if disentangled from accretion in quiescence or other sources of variability outlined in § 1, would be a completely separate direct observational confirmation of this view.

The spreading and blending of the temperature peaks due to different reactions, clearly evident in Figure 1, as well as the relative magnitude of heat diffusion towards the surface and the core can be easily understood in terms of the thermal time at the place where the heat is deposited. To make the discussion more precise, we define the thermal diffusion timescale ([Henyey & L’Ecuyer 1969]; BBR98)
| (7) |
Roughly speaking, is the time it takes a heat impulse to diffuse from to . In Figure 3, we plot the thermal diffusion timescales as a function of density in the crust to the NS surface (solid line) and the core (dotted lines). The top panel is for the model with electron-impurity scattering conductivity in the limit of very impure crust, while the bottom panel is for the model with electron-phonon conductivity.444The thermal times are shorter for the enhanced cooling models (not shown here) owing to the lower crustal temperatures. Black vertical bars in the top panel show the locations of the energy deposition due to non-equilibrium reactions, with the height of the bars proportional to the energy deposited. Clearly, the energy depositions in the inner crust happen at very similar depths, such that the differences between the thermal times of the reactions are much smaller than the thermal times themselves. By the time the heat from these reactions diffuses to the surface, the differences between them are blended. It is also clear from this figure that if the thermal diffusion time to the core is smaller than that to the surface, then most of the heat will flow to the core, rather than to the surface.
In Figures 4 and 5 we survey the dependence of the transient emission following an accretion outburst on various model parameters. Figure 4 shows results for a crust with low thermal conductivity (electron-impurity scattering with ), while Figure 5 shows results for high thermal conductivity (electron-phonon scattering). These figures are plotted with luminosity normalized by the thermal luminosity just prior to the outburst, which is the lowest luminosity of the outburst cycle. This tends to exaggerate visually the range of luminosities. It also does not display the absolute differences in the luminosities due to different , which are discussed in § 3.2. However, it does make clear the relevant factors of variability which can be produced over a recurrence cycle due to this mechanism, and that is our goal here.
As is clear from the figures, the variability is the smallest (%) for models with standard cooling and short (1 year, in our case) outburst recurrence times. The variability is largest for models with rapid core cooling and long (30 year) outburst recurrence time. Under the same conditions, the variability of the models with high crustal thermal conductivity (Figure 5) is always larger than that of the low conductivity models (Figure 4). All of these features are straightforward to understand in light of the above discussion. Since the energy deposited into the crust is not large ( erg), the colder the crust, the larger the transient thermal response. Models with rapid core cooling and high thermal conductivity have systematically lower crust temperatures (see § 3.2), and hence have larger amplitude of variability.
As discussed above, the first hump in the light curve is due to reactions in the outer crust, while the second hump is due to those in the inner crust. This is a generic feature of all models except for the low-, short-recurrence ones (left column of Figure 4). As is evident from the top panel of Figure 3, the thermal diffusion time from the inner crust to the surface is days, i.e., longer than the recurrence time. Thus, the second peak in the lightcurve does not make it to the NS surface before the next outburst, and only one peak is observed in the quiescence lightcurve. This mismatch between the thermal diffusion timescale and the outburst recurrence timescale explains why only one light-curve peak is observed in the =1 yr, low thermal conductivity simulations (Figures 4a & b) while two peaks are observed in all other simulations. For long sources, the time between the outburst and the second peak in the lightcurve is an excellent observational indicator of the thermal time in the inner crust.
As we see in Figure 3, the thermal time of the inner crust in low- models is days, while it is only days for the high- models. As a result, for low- models with =1 yr, the crust does not completely cool down, and therefore remains at a roughly constant temperature. On the other hand, for =30 yr, the crust does have enough time to cool down, and hence the variability is much greater (tens of per cent to factors of few). In addition, it is clear from Eq. (6) that it is , rather than or individually that is important for the overall magnitude of variability. For a given , models with larger exhibit larger variability, simply because the amount of energy deposited into the crust is larger. This explains why the =1 yr light curves are (relatively) less variable than the =30 yr light curves. In general, one therefore expects a greater magnitude of (relative) intensity variability in quiescence from systems with longer recurrence timescales (10 yr).


4 Comparison with Observations
Is the phenomenon we describe here observed in transient NSs in quiescence? If so, both the time-averaged luminosity level, and the variability around it need to be self-consistently accounted for. This constraint provides an observational discriminant for the various core cooling scenarios in NS transients.
The observed magnitude of variability (factors of ) cannot be achieved in models with standard neutrino cooling, which vary by less than 50% in all cases we investigate here. On the other hand, rapid neutrino cooling models are capable of producing intensity variability by factors of up to 20 on timescales of months-years; this may be invoked for the observed variability of 4U 2129+37 (a factor of 3.4 over months), and the longer time-scale variability of Cen X4 (factor of 2-5 over 6 years, an additional factor of 3 over 10 years). The factor of 2-3 variability in Aql X1 over months-years can be similarly explained, again requiring rapid cooling to be operative in its core. However, to explain the factor of 3 variation over a period of 4-8 days in the quiescent X-ray flux of Cen X4 observed by Campana et al. [Campana et al. 1997], one must invoke an unobserved, short ( 1 day) outburst, preceeding those observations by only few days, which seems unlikely, although it cannot be excluded due to the lack of X-ray coverage.
However, as argued by BBR98, the inferred quiescent luminosity of Aql X1 can be naturally understood if the neutrino losses from its core are negligible, i.e. if only standard cooling processes operate (cf. our Eq. [3.2]). Time-averaged of Aql X1 is inconsistent with rapid cooling, regardless of the assumed crustal conductivity (cf. Eq. [4] and [5]). This is also the case for 4U 1608-52. For these sources, variability in quiescence must be due to processes other than thermal relaxation of the crust (outlined in § 1).
Of the observed recurrent NS transients, only Cen X4 has time-averaged much lower than given by Eq. (3.2). BBR98 conjectured that this discrepancy is due to the fact that only MeV, rather than MeV is deposited in its crust,555The low quiescent luminosity could also potentially be explained by an overestimation of the time-average accretion rate of Cen X4, due to the small number of outbursts observed. while Colpi et al. [Colpi et al. 2001] argued that MeV, but rapid neutrino cooling is operating in Cen X4. Clearly, analysis of variability of Cen X4 in quiescence (or other transients with long recurrence times) provides a discriminant between the various core cooling mechanisms. If enhanced neutrino cooling is responsible for the relatevely low of Cen X4, then its quiescent luminosity must vary in a well-defined way (see panels d of Figures 4 and 5). In the contrary case of standard cooling with low , the baseline thermal luminosity of Cen X4 should be constant to better than 50%, and any variability must be accounted for by the processes outside the NS crust. Finally, it is difficult to reliably predict the expected quiescent luminosity of 4U 2129+47, due to its unusual accretion history [Pietsch et al. 1986], and so we draw no additional conclusions for this source.
If transiently accreting pulsars in quiescence fully exclude accretion onto the NS surface due to the propeller effect, then observations of the thermal pulse during quiescence will be due only to crustal and core emission. Moreover, optical observations can indicate when the accretion disk is absent in these sources [Negueruela et al. 2000], and observations which follow the pulsed intensity profile of such an object over several years following an outburst can readily constrain the NS atmospheric luminosity. The quiescent emission of transient pulsars, such as the pulsed emission recently detected from A0535+35 [Negueruela et al. 2000] and the persistent emission from SAX J1808.43658 [Stella et al. 2000, Dotani et al. 2000], can potentially be used for measuring the late-time emission predicted here. However, theoretical modeling of the quiescent emission in this case is complicated by the need to understand the effects of the magnetic field, transverse heat flow in the crust, and whether or not the crust is replaced by accretion in these systems.
5 Conclusions
We have investigated the time-variable luminosity of a transiently accreting NS, following a “delta-function”-like accretion outburst (one day in duration), for three different values of , for NS cores with both standard and rapid core cooling (specifically, for emissivity from modified Urca and from pion condensate), and for high crustal thermal conductivity dominated by electron-phonon scattering (for the case of a pure crystal crust) or for low conductivity due to electron-impurity scattering with large impurity fraction (for the more likely case of very impure crust expected in an accreting NS).
The magnitude and time-dependence of late-time emission due to heat deposited by non-equilibrium reactions in the crust depends intimately on the microphysics active in the crust and the core, the time-average accretion rate (and thus the time-average quiescent luminosity itself) and – most importantly – on the recurrence timescale of the transient system. In the case of standard core cooling, the magnitude of the luminosity swings (peak-to-peak) is 1% for =1 yr, and up to 15-40% for =30 yr, independent of the crust conductivity and . For rapid core cooling, the magnitude of the luminosity swings varies between few percent, to as much as a factor of 20, and is largest for long and high crustal thermal conductivity.
It is possible to observe either one peak in the lightcurve (due to the blended emission from the several reactions in the outer crust) or two peaks (the second is due to blended emission from reactions in the inner crust). Observing the second peak requires a recurrence time long enough to permit the inner-crust emission to reach the surface. For low crustal thermal conductivity, this thermal time is yr, so the second peak is only observed in transients with longer recurrence times. In the electron-phonon scattering dominated crust, with thermal time of yr, the second peak may be observed in short sources. In general, only the energy deposited at depths where the thermal time is smaller than the outburst recurrence interval will produce observable variability in the quiescent thermal emission.
The changes in luminosity which would permit one to follow the time-variable emission due to deep-crustal heating at the few per cent level are (=5 ), which is detectable with Chandra, XMM and Con-X in , 5, and sec, respectively. Complicating such observations is the contribution of accretion onto the NS, which could add a stochastic variability component to the thermal spectrum which may not easily be distinguished. If accretion only occurs at the magnetosphere, this contributes to the power-law component, which can be separated spectrally.
Our comparisons between these results and previously reported observations of transiently accreting NSs in quiescence indicate that the observed magnitude of intensity variability is much greater than we predict for standard neutron star core cooling and crust conductivity (factors of few for the former vs. % for the latter). Hence, for the recurrent transients Aql X1, 4U 1608-52, and SAX J1808-36, whose time-averaged luminosity agrees well with the predictions of standard neutrino cooling (BBR98; cf. our § 3.2), it seems likely that some other process – such as continued, variable accretion in quiescence – is required to explain the majority of the observed variability.
In the case of Cen X4, however, the observed quiescent luminosity is consistent with rapid core cooling ([Colpi et al. 2001], cf. our § 3.2), and hence its long-timescale (months to years) variability could be accounted for by crustal relaxation.666But the short timescale of variability (few days) requires that a short outburst (days) would have had to occur only a few days prior to the observation; this seems unlikely, but cannot be excluded. On the other hand, if Cen X4 appears too dim because its time-averaged accretion rate has been overestimated or non-equilibrium reactions deposit an unusually small amount of energy into its crust (BBR98), then the majority of its quiescent variability must be due to stochastic sources external to the NS. Disentangling the true thermal emission from Cen X4 from the contamination due to continued accretion in quiescence (or other sources) would allow one to discriminate these two hypotheses.
Finally, we note that the observations are low quality (S/Nfew); there are only two instances of repeated observation with the same instrument, and in those cases the number of observations were only 2-3 (not densely sampled light curves); and the infered time-average accretion rate (and, hence, the predicted quiescent luminosity) of Cen X-4 is highly uncertain due to the small number of outbursts observed. Therefore, a definitive statment on this subject requires greater observational scrutiny, with higher S/N data than presently available, and with densely sampled lightcurve following an outburst, which would be capable of distinguishing between the temporal variability predicted here and more stochastic variability which likely accompanies a variable accretion rate.
RR gratefully acknowledges useful conversations with Ed Brown and Lars Bildsten, with whom this idea was initially discussed, and whose comments improved this paper. The authors also thank Dimitri Yakovlev for his extensive comments on this paper. This work was supported in part by NASA Grants NAG5-3239 and NGC5-7034 and NSF Grant AST-9618537. GU acknowledges support as a Lee A. DuBridge postdoctoral scholar.
References
- Asai et al. 1996a Asai, K., Dotani, T., Kunieda, H., & Kawai, N., 1996a, PASJ 48, L27
- Asai et al. 1996b Asai, K., Dotani, T., Mitsuda, K., Hoshi, R., Vaughan, B., Tanaka, Y., & Inoue, H., 1996b, PASJ 48, 257
- Baiko & Yakovlev 1995 Baiko, D. A. & Yakovlev, D. G., 1995, Astr. Letters 21, 702
- Blandford et al. 1983 Blandford, R. D., Applegate, J. H., & Hernquist, L., 1983, MNRAS 204, 1025
- Brown 2000 Brown, E. F., 2000, ApJ 531, 988
- Brown et al. 1998 Brown, E. F., Bildsten, L., & Rutledge, R. E., 1998, ApJ 504, L95, [BBR98]
- Campana et al. 1998a Campana, S., Colpi, M., Mereghetti, S., Stella, L., & Tavani, M., 1998a, A&A Rev. 8, 279
- Campana et al. 1997 Campana, S., Mereghetti, S., Stella, L., & Colpi, M., 1997, A&A 324, 941
- Campana et al. 1998b Campana, S., Stella, L., Mereghetti, S., Colpi, M., Tavani, M., Ricci, D., Fiume, D. D., & Belloni, T., 1998b, ApJ 499, L65
- Campana et al. 2000 Campana, S., Stella, L., Mereghetti, S., & Cremonesi, D., 2000, A&A 358, 583
- Chen et al. 1997 Chen, W., Shrader, C. R., & Livio, M., 1997, ApJ 491, 312
- Cheng et al. 1998 Cheng, K. S., Li, Y., & Suen, W. M., 1998, ApJ 499, L45
- Chong & Cheng 1994 Chong, N. & Cheng, K. S., 1994, ApJ 425, 210
- Colpi et al. 2001 Colpi, M., Geppert, U., Page, D., & Possenti, A., 2001, ApJ, accepted, astro-ph/001572
- Dotani et al. 2000 Dotani, T., Asai, K., & Wijnands, R., 2000, ApJ 543, L145
- Eichler & Cheng 1989 Eichler, D. & Cheng, A. F., 1989, ApJ 336, 360
- Friman & Maxwell 1979 Friman, B. L. & Maxwell, O. V., 1979, ApJ 232, 541
- Garcia & Callanan 1999 Garcia, M. R. & Callanan, P. J., 1999, AJ 118, 1390
- Gudmundsson et al. 1983 Gudmundsson, E. H., Pethick, C. J., & Epstein, R. I., 1983, ApJ 272, 286
- Haensel & Zdunik 1990a Haensel, P. & Zdunik, J. L., 1990a, A&A 229, 117
- Haensel & Zdunik 1990b Haensel, P. & Zdunik, J. L., 1990b, A&A 227, 431
- Henyey & L’Ecuyer 1969 Henyey, L. & L’Ecuyer, J. L., 1969, ApJ 156, 549
- Hirano et al. 1997 Hirano, S., Shibazaki, N., Umeda, H., & Nomoto, K. I., 1997, ApJ 491, 286
- Illarionov & Sunyaev 1975 Illarionov, A. F. & Sunyaev, R. A., 1975, A&A 39, 185
- Kaminker & Haensel 1999 Kaminker, A. D. & Haensel, P., 1999, Acta Physica Polonica B 30, 1125, Preprint available, astro-ph/9908249
- Levenfish & Yakovlev 1994 Levenfish, K. P. & Yakovlev, D. G., 1994, Astonomy Reports 38(2), 247
- Maxwell 1979 Maxwell, O. V., 1979, ApJ 231, 201
- Menou et al. 1999 Menou, K., Esin, A. A., Narayan, R., Garcia, M. R., Lasota, J. P., & McClintock, J. E., 1999, ApJ 520, 276
- Narayan et al. 1997 Narayan, R., Garcia, M. R., & McClintock, J. E., 1997, ApJ 478, L79
- Negele & Vautherin 1973 Negele, J. W. & Vautherin, D., 1973, Nucl. Phys. A 207, 298
- Negueruela et al. 2000 Negueruela, I., Reig, P., Finger, M. H., & Roche, P., 2000, A&A 356, 1003
- Pietsch et al. 1986 Pietsch, W., Steinle, H., Gottwald, M., & Graser, U., 1986, A&A 157, 23
- Potekhin et al. 1997 Potekhin, A. Y., Chabrier, G., & Yakovlev, D. G., 1997, A&A 323, 415
- Rutledge et al. 1999 Rutledge, R. E., Bildsten, L., Brown, E. F., Pavlov, G. G., & Zavlin, V. E., 1999, ApJ 514, 945
- Rutledge et al. 2000 Rutledge, R. E., Bildsten, L., Brown, E. F., Pavlov, G. G., & Zavlin, V. E., 2000, ApJ 529, 985
- Rutledge et al. 2001 Rutledge, R. E., Bildsten, L., Brown, E. F., Pavlov, G. G., & Zavlin, V. E., 2001, ApJ, accepted, astro-ph/0012400
- Schatz et al. 1999 Schatz, H., Bildsten, L., Cumming, A., & Wiescher, M., 1999, ApJ 524, 1014
- Shapiro & Teukolsky 1983 Shapiro, S. L. & Teukolsky, S. A., 1983, Black Holes, White Dwarfs, and Neutron Stars, John Wiley & Sons, Inc., New York
- Stella et al. 2000 Stella, l., Campana, S., Mereghetti, S., Ricci, D., & Israel, G., 2000, ApJ, accepted, astro-ph/0005429
- Stella et al. 1986 Stella, L., White, N. E., & Rosner, R., 1986, ApJ 308, 669
- Tanaka & Shibazaki 1996 Tanaka, Y. & Shibazaki, N., 1996, ARA&A 34, 607
- Ushomirsky et al. 2000 Ushomirsky, G., Cutler, C., & Bildsten, L., 2000, MNRAS 319, 902
- Van Paradijs 1996 Van Paradijs, J., 1996, ApJ 464, L139
- Van Paradijs et al. 1987 Van Paradijs, J., Verbunt, F., Shafer, R. A., & Arnaud, K. A., 1987, A&A 182, 47
- van Riper 1991 van Riper, K. A., 1991, ApJS 75, 449
- Verbunt et al. 1994 Verbunt, F., Belloni, T., Johnston, H. M., Van der Klis, M., & Lewin, W. H. G., 1994, A&A 285, 903
- Yakovlev & Levenfish 1995 Yakovlev, D. G. & Levenfish, K. P., 1995, A&A 297, 717
- Yakovlev et al. 1999 Yakovlev, D. G., Levenfish, K. P., & Shibanov, Y. A., 1999, Phys.-Uspekhi, 42, 737, Preprint available: astro-ph/9906456
- Yakovlev & Urpin 1980 Yakovlev, D. G. & Urpin, V. A., 1980, Soviet Ast. 24(3), 303
- Zampieri et al. 1995 Zampieri, L., Turolla, R., Zane, S., & Treves, A., 1995, ApJ 439, 849