Faint X-ray sources resolved in the ASCA Galactic plane survey and their contribution to the Galactic ridge X-ray emission
Abstract
The X-ray emission from the central region of the Galactic plane, and , was studied in the 0.7–10 keV energy band with a spatial resolution of with the ASCA observatory. We developed a new analysis method for the ASCA data to resolve discrete sources from the extended Galactic ridge X-ray emission (GRXE). We successfully resolved 163 discrete sources with an X-ray flux down to ergs cm-2 s-1 and determined the intensity variations of the GRXE as a function of the Galactic longitude with a spatial resolution of about a degree. The longitudinal intensity variation in the energy band above 4 keV, for which there is little absorption in the Galactic plane, shows a large enhanced feature within . This suggests a strong enhancement of X-ray emissivity of the GRXE inside the 4 kpc arm of the Galaxy. Searches for identifications of the resolved X-ray sources with cataloged X-ray sources and optical stars show that the are unidentified. Spectral analysis of each source shows that a large number of the unidentified sources have hard X-ray spectra obscured by the Galactic interstellar medium. We classified the sources into several groups by the flux, the hardness and the softness of the spectra, and performed further detailed analysis for the spectra summed within each group. Possible candidates of X-ray origins of these unidentified sources are discussed based on the grouping spectral analysis. Also, we derived the LogN-LogS relations of the resolved sources in the energy bands below and above 2 keV separately. The LogN-LogS relation of the Galactic X-ray sources above 2 keV was obtained for the first time with this study. It is represented by a power-law with an index of after correction for the contribution of extragalactic X-ray sources. This flat power-law relation suggests that the spatial distribution of the X-ray sources should have an arm-like structure in which the Solar system is included. The integrated surface brightness of the resolved sources is about 10% of the total GRXE in both energy bands. The approximately 90% of the emission remaining is still unresolved.
1 Introduction
From the first detection of Sco X-1, the brightest X-ray star in the Galaxy, many bright X-ray sources have been discovered and classified into various categories. These categories include young stellar objects, flaring stars, compact degenerate stars, supernova remnants (SNRs), and diffuse hot plasma in the interstellar medium (ISM). However, since imaging observations with high sensitivity have always been limited to the soft X-ray band below 3 keV, the comprehensive view of these X-ray sources throughout the Galaxy is far from understood. The soft X-rays whose energy is below 3 keV are substantially absorbed with the ISM in the Galaxy; thus the coverage of soft X-ray observations is limited to near the Solar system. The ISM is almost transparent to X-ray photons above 3 keV throughout the Galaxy. However, imaging instruments with good efficiency for hard ( keV) X-rays are difficult to construct because of the limits of the reflection and the diffraction of the hard X-rays. For this reason, unrecognized high energy phenomena could be hiding in hard X-ray regions.
The Galactic ridge X-ray emission (hereafter GRXE) is one of those open questions. The GRXE is unresolved X-ray emission extended along the Galactic plane. The existence of the excess X-ray emission along the Galactic plane was first suggested by the pioneering rocket experiments Bleach et al. (1972) and clearly confirmed by succeeding observations of X-ray astronomical satellites (e.g. Worrall et al. 1982; Warwick et al. 1985). After this, K-shell line emission from He-like iron ions was discovered along the Galactic plane Koyama et al. (1986); Yamauchi & Koyama (1993). On the other hand, above 10 keV, a power-law component extended up to -ray regime with a photon index , was clearly detected (Yamasaki et al. 1997; Valinia & Marshall 1998).
However, the origin of the total emission of the GRXE still remains unresolved. The X-ray spectrum with the ionized iron K-line in the energy band below 10 keV is in good agreement with emission from hot plasma with a temperature of about K. However, there are some critical problems to be known in the purely diffuse plasma emission model. If such a hot plasma is extended in the Galactic plane, it should be free from the gravitational confinement of the Galaxy and escape from the Galactic plane (e.g., Koyama et al. 1986). Also, the plasma pressure should be higher by an order of magnitude than that of the ISM in the Galaxy (e.g., Kaneda et al. 1997). Hence, a great deal of energy must be continuously supplied to maintain this plasma unless an unidentified plasma confinement mechanism exists. Tanuma et al. (1999) suggest that the energetics can be explained by magnetic reconnection if the magnetic field in the Galactic plane is locally as high as G. However, any convincing evidence of such a localization of the Galactic magnetic field has not been obtained so far.
Another hypothesis is that the GRXE is a superposition of discrete X-ray sources. From the similarity of the energy spectra, Cataclysmic Variable (CV) and RS CVn systems have been considered as candidates (e.g., Worrall & Marshall 1983). However, a huge number of discrete sources are required to satisfy the uniformity of the surface brightness observed on the Galactic plane Yamauchi et al. (1996). The number density of the CVs estimated near the Solar system is smaller by two orders of magnitude than that to explain the total flux of the GRXE (Worrall et al. 1982). Also, Ottmann & Schmitt (1991) estimated the contributions of RS CVn systems to the GRXE at 27% based on the optical and the X-ray data and showed that their X-ray spectra can not completely account for that of the GRXE. However, we have not ever known accurately how many faint discrete X-ray sources exist in the Galaxy.
ASCA has a spatial resolution of (HPD: half power diameter) in a field-of-view (FOV) of (diameter) in a broad energy range of 0.5–10 keV by utilizing two kinds of detector: SIS (Solid Imaging Spectrometer) and GIS (Gas Imaging Spectrometer) combined with XRT (X-ray telescope) (Tanaka, Inoue, & Holt 1994). It is capable of imaging observations in the energy band above 3 keV for the first time, thus making it possible to obtain crucial observational results for understanding the Galactic X-ray sources and the origin of the GRXE. Thus, we planned the ASCA Galactic plane survey and performed it.
In this paper, studies of faint Galactic X-ray sources and their contribution to the GRXE based on the ASCA Galactic plane survey are reported. We developed a new method of imaging analysis for data of the ASCA Galactic plane survey and successfully resolved X-ray sources with a flux down to ergs cm-2 s-1. We investigated the identification of the faint unidentified sources based on the spectral analysis, in which we classified the sources into several groups due to the flux, the hardness and the softness, and analyzed the spectra summed within each group in order to overcome the poor photon statistics of each source. We also derived their LogN-LogS relation and the large-scale intensity profile of the unresolved GRXE averaged on a scale of a degree. In the following, we describe the observations of the ASCA Galactic plane survey and the data reduction in 2, and present the analysis method and the results in 3. We discuss implications of the obtained results, which include longitude intensity variations of the GRXE, unidentified faint X-ray sources resolved in this ASCA survey, and their LogN-LogS relations, in 4. Finally we state our conclusions in 5.
2 Observations and Data reduction
2.1 Observations
The ASCA Galactic Plane Survey is a collaborative project of the ASCA team, aimed at the systematic study of the Galactic X-ray sources. It was planned to cover the area of the Galactic inner disk of and with successive pointing observations, each of 10 ks exposure time. The observations were carried out from 1996 March 13 in the 4-th guest observation cycle (AO-4) to 1999 April 28 with a total of 173 pointings and the total exposure time of 1,370 ks after data screening. All the observations were performed with the PH-nominal mode for the GIS and the 4CCD faint mode at high bit rate and the 4CCD bright mode at medium bit-rate for the SIS.
In addition to the Galactic plane survey, we utilized data from observations of the Galactic ridge edge, which were proposed for the purpose of obtaining information on the edge of the GRXE. They cover the area on the Galactic plane from to with eight successive pointing observations, each with 10 ks exposure time. The observations were carried out from 1997 November 5 to 1997 November 9 with the PH-nominal mode for the GIS and the 2CCD faint mode at high bit rate and the 2CCD bright mode at medium bit-rate for the SIS.
Figure 1 shows the exposure map with the GIS FOVs. The total area covered by the GIS is 63.04 deg2
2.2 Reduction of the GIS data
In this Galactic plane survey, the SIS was not so useful because (1) the coverage of the area, which is most important for survey observations, was about a half that of the GIS and (2) the energy resolution and the efficiency of the SIS were gradually degraded in orbit due to the radiation damage Yamashita et al. (1997). Thus, the SIS had only a slight advantage over the GIS. In this paper, the analysis of the GIS data is mainly described. All the data reduction was performed on the ASCA_ANL Kubo et al. (1997), which is a software framework for ASCA data analysis developed for event-by-event analysis Takahashi et al. (1995).
In the analysis of searches for unidentified faint sources, careful event screenings are required in order not to extract fake ones. For a low background condition and reproducibility of the non X-ray background (NXB), we adopted the “flare-cut” screening criteria for the geographical condition of the satellite Ishisaki et al. (1997). We used standard values for the other parameters such as elevation from the dark earth rim, elevation from the sunlight earth rim and attitude jittering. The correction of the data such as position linearization, gain correction and strict rise-time mask were also carried out in this step, according to the standard procedure. In addition, the dead time correction was performed based on the hard-wired event counts recorded in the GIS monitor data Makishima et al. (1996); Ohashi et al. (1996).
Since the coordinate system employed in the standard data processing cannot be applied to the analysis of multi-pointing observations, we adopted a new coordinate system described in Appendix A to handle all the data of the Galactic plane survey. The conversion of the coordinates was performed for each photon according to the position coordinates on the detector and the Euler angle of the satellite axis.
3 Analysis and Results
3.1 Basic scheme of the GIS image analysis
Some of the difficulties of extended emission analysis of the ASCA data come from the complicated image response which includes vignetting effects and the position dependent PSF (point spread function), and from contamination by stray light. Therefore, we have to carefully interpret raw X-ray image obtained with ASCA. Since the effects of these instrumental response functions on the raw image are coupled to each other in complicated ways, it is impossible to deconvolve the original image from the response functions uniquely. We thus utilized model fitting rather than image deconvolution.
From previous observations of the GRXE (e.g., Kaneda 1997), we know that the surface brightness of the GRXE shows substantial intensity variations on length scales of a few degrees; however, the variation amplitude decreases rapidly on shorter scales. Thus, as a first approximation, we can consider spatial variations on length scales longer and shorter than the size of the FOV of the GIS ( 1 degree) separately.
We first constructed a model in which the surface brightness of the GRXE is uniform over length scales of about a degree, and fitted it to the raw data. Later, we examined the model parameters and the residuals of the fits to investigate the systematic errors of the analysis and the spatial fluctuation of the GRXE which were not included in the model. The image analysis was performed according to the following steps.
-
Step-1:
Estimation of large scale intensity profile of the GRXE
The brightness of the GRXE averaged over a FOV of the GIS was evaluated, excluding pixels with high counting rates which are expected to be largely contaminated by bright X-ray sources. The average surface brightness obtained for each pointing was utilized to construct a uniform brightness model for the GRXE, which was required for the source survey in the next step. The value of the average brightness was reevaluated, masking all the X-ray sources resolved in the source survey. -
Step-2:
Peak finding
Peaks of the image which have a significantly higher count-rate than the uniform brightness GRXE model were extracted as source candidates. -
Step-3:
Image fitting
Image fitting by a surface brightness model that consists of source candidates and the uniform brightness GRXE model was carried out to estimate the significance and the flux of the discrete sources.
In the image fitting, precise 2-dimensional response functions must be known. However, the pattern of stray light, which comes from outside the FOV through anomalous reflection paths such as single reflection and/or backside reflection by the mirror foils, is too complicated to be calibrated sufficiently for the fitting analysis Tsusaka et al. (1995). Thus, we estimated the contribution of the stray light from the nearby bright X-ray sources based on the data of the adjacent fields containing the bright sources and on previous observations. We eliminated data of which more than 5% are contaminated by stray light from the bright X-ray sources. After the data selection, the area covered was reduced to 39.75 deg2 from the total 63.04 deg2 area surveyed. The resulting coverage is shown in Figure 1.
3.2 Estimation of large scale intensity profile of GRXE
The large-scale intensity profile of the GRXE was obtained from the background X-ray intensity averaged within each FOV of the GIS, which was determined for all pointings separately. We employed the fitting method because the expected number of photons for each pixel in a FOV is different due to the position dependence of the effective area even if the observed surface brightness is uniform. The image fitting in this step was performed for the image composed of the GIS2 and the GIS3 data of the multi-pointing observation and binned by 1212 pixels (3′3′) in order to obtain appropriate statistical accuracy for the background GRXE.
We used the model for the averaged CXB (cosmic X-ray background) image accumulating large blank-sky area as the standard response for the uniform surface emission (Appendix B). Utilizing the model for the averaged CXB image, cnts bin-1 s-1, where denotes a position on the GIS image, the model of the observed image for GRXE which is assumed to have uniform surface brightness, cnts bin-1, is represented by the following equation:
| (1) |
where is a parameter representing the intensity normalized to that of the CXB, is the exposure time and is the image of the non X-ray background not originated from X-rays, defined for each pointing ID, . The model of the non X-ray background image can be calculated as a function of the geographical condition of the satellite with a systematic error of 5% Ishisaki et al. (1997).
We determined the values of by fitting the model of to the raw observed image . Here, since the raw image contains a considerable number of photons from discrete X-ray sources in the same FOV, we need to eliminate those pixels with anomalously high count-rates compared to the average. Thus, the value of was evaluated by a fit excluding the pixels with count-rates higher than average2 of the distribution in the first step. After the source survey in the following steps, it was reevaluated by a fit masking all the resolved X-ray sources.
These analyses were carried out in each different energy band individually. Figure 2 shows the obtained large scale intensity variations in the three energy bands of 0.7–2 keV, 2–4 keV and 4–10 keV, where the intensity is represented by surface brightness in units of (ergs cm-2s-1deg-2) calculated from the photon counting rate using the ARF file for extended surface emission Kaneda et al. (1997). We also calculated the inclusive contributions of the CXB coming through the Galactic ISM accounting for the average CXB spectrum Ishisaki (1996) and the ISM column density expected from the HI Burton (1985); Kerr et al. (1986) and CO-line Dame et al. (1987) intensities with the CO-H2 conversion factor Hunter et al. (1997), which are shown together in Figure 2.
3.3 Peak finding
We searched for peaks in the image, which we used as source candidates in the next step.
On the Galactic plane, the bright background of the unresolved GRXE makes a convex structure at the center of each FOV because of the vignetting of the XRT (see Figure 3). This artificial structure needs to be subtracted before peak finding. To subtract the background component properly, the 2-dimensional profile of the unresolved GRXE must be known. Here, we assumed as a first approximation that the surface brightness of the GRXE is uniform on the scale of a FOV of the GIS. The profile for the uniform GRXE model can be obtained from equation (1). Even if the model is not statistically acceptable, the artificial structure of the vignetting and the stray light should be appropriately removed in this procedure. Therefore, it is thought to be an appropriate method.
To avoid picking false peaks as much as possible, after subtracting the background, the following processes were performed on the raw image beforehand.
-
1.
Smoothing by cross-correlation with the PSF.
To improve photon statistics without degrading position resolution, the image was smoothed by cross-correlation with the PSF. -
2.
Compositing multi-pointing observation.
Overlapping regions of the multi-pointing observation with GIS2 and GIS3 were summed to improve photon statistics. -
3.
Correction of effective exposure time.
The correction was required not only for the exposure time of multi-pointing overlapping observations but also for the vignetting effect, which causes differences in the effective area within a FOV.
The smoothed image on which peak finding was carried out is represented by the following equation,
| (2) |
where represents the point spread function for the X-rays coming from the direction on the sky and represents the selected region on the detector. The region near the edge of the GIS FOV, more than 20′ from the detector center, is usually not used because of the large background ratio and the large calibration uncertainty. Here, considering the following step, the region within a radius of 22′ from the detector center was selected for the peak finding.
We chose peaks exceeding a certain threshold as source candidates. The proper threshold value depends on the averaged intensity of the trial field. We found after some trials that 3 of the distribution of the smoothed image, , is appropriate for the threshold, where the is the best-fit value obtained from fitting the distribution to a Gaussian function. Since the average intensity of a FOV is different from pointing to pointing, the threshold was determined for each pointing by performing the Gaussian fitting separately. These procedures are illustrated in Figure 3.
The procedures of peak finding were carried out for the three energy bands of 0.7–2 keV, 2–10 keV and 0.7–7 keV, each of which the CXB image model of the 0.7–2 keV, 2–7 keV and 0.7–7 keV band (Appendix B) were respectively used.
3.4 Image fitting
To estimate the significance of the source detection and the flux, we employed image fitting. A model which consists of source candidates and background was fitted to the raw data. The detection significance of the source was estimated from the fitting error of the flux.
The peaks detected in the previous step were used as the source candidates. As the background, the uniform model represented by equation (1) was employed. The model is represented by
| (3) | |||||
| (4) |
where , are the flux and the sky coordinates, respectively, of the -th source candidate and is the effective area for the sky coordinates, . In this model, parameters to be fitted are source fluxes and a normalization factor of GRXE, , which was reevaluated here. The fits were performed for the image composed of the GIS2 and the GIS3 data from the multi-pointing observation and binned by 44 pixels (1′1′) to improve statistics and speed up the calculation time. Since the HPD of the PSF is , this bin size is reasonable.
The flux of the source was defined with the count rate measured as if the source was at the GIS nominal position. Its units are (cnts GIS-1 ks-1). Then, is a correction factor of the effective area against that of the GIS nominal position. It is slightly dependent on the energy spectrum of the source; however, the dependence is not important as far as the spectrum is that of a typical X-ray source. The was derived by jbldarf, which is a program to build an ARF file in the standard analysis procedure. The energy flux (ergs cm-2 s-1) is easily calculated from the the GIS count rate utilizing the ARF file at the GIS nominal position and assuming an appropriate spectrum for the target source. As an example, the conversion factors for typical power-law spectra with the typical ISM absorption densities in each energy band are shown in Table 1.
To cover a survey area as large as possible, we extended the image fitting region to a 20′ radius from the detector center. Since the PSF of the XRT+GIS system was not calibrated outside of a 17′ radius Takahashi et al. (1995), we approximated the PSF outside 17′ radius by that at the 17′ radius. Thus, the reproducibility of the fitting model was not good for these regions compared to the inner regions. Also, we included source candidates within a 22′ radius in the model of the image fitting because X-ray photons from those sources can contribute to the flux at a 20′ radius through the extended PSF.
The fits were performed by the maximum likelihood method based on the Poisson distribution of photon counts. This method is valid even when counting statistics are too poor to use the method. The likelihood is defined as
| (5) |
where [cnts] represents observed photon counts and [cnts] represents predicted counts from the model at the position on the detector, .
The errors of the flux were estimated by the statistic. Since the bins around the detected sources have enough photon statistics, the statistic is appropriate for the error estimation.
The significance of the source detection is defined as
| (6) |
where the 1 error is a fitting error of 1(68%) confidence level based on the statistics. Here, is defined by
| (7) |
| (8) |
where represents the systematic error of the model. In this analysis, 5% of was set to which represents the systematic errors of the PSF, CXB and NXB models and the small-scale fluctuation of GRXE. The adequacy of this systematic error was verified later in 3.8.
From the definition of the statistic, a total of 25 photons gives a significance of 5 in an ideal observation where there is no background and the PSF is represented only by a single pixel peak. In the practical situation of the extended PSF and the background emission on the Galactic plane, the threshold flux of 4 detection was typically about 50 cnts GIS-1 (10ks)-1.
3.5 Source list
As a result of the image analysis, we detected a total of 207 sources with a significance above 4 in at least one of the 0.7–2, 2–10 and 0.7–7 keV energy bands. We recognized sources which are detected in more than two energy bands and less than 1′ apart to be identical. After that, we investigated the position and the profile of the image around all the detected sources and excluded apparent fake sources such as peaks of stray light patterns located at the edge of the survey fields near to the bright X-ray sources and fractional parts of diffuse emission. Subtracting the fake ones, the total number of the detected sources with a significance above 4 becomes 163. The numbers of sources detected in each energy band are summarized in Table 3. The obtained source list is presented in Table 2 with the parameters of position, flux and detection significance, excluding the sources recognized as fake ones. Figure 4 shows the position of all the sources in the list on the 0.7–7 keV image.
We compared the obtained ASCA Galactic source catalog with the known X-ray source catalogs, which are Einstein IPC Catalog and ROSAT Bright Source Catalog Voges et al. (1999), in order to search for the past X-ray identifications. We next investigated identifications with the Galactic SNRs Green (1998), which are most promising candidates as the origins of diffuse X-ray emission. The number of these cataloged sources involved in the survey area and that of the detected sources in the ASCA survey are summarized in Table 4. We also examined the position coincidence with optical stars in SIMBAD database. Here, note that their position coincidence does not necessarily indicate the identification of the origins, since the visibility limit in optical band ( 1 kpc) is much smaller than that in the ASCA-GIS 0.7–10 keV band ( 5 kpc) in the Galactic plane and the ASCA position determination error inaccuracy ( in radius) is relatively large against the density of optical stars. The number of the ASCA sources coincident with the SIMBAD stars is 22, which is shown together in Table 4.
After all, of the resolved sources were unidentified with any of these source catalogs.
3.6 Spectral analysis of the resolved sources and their grouping analysis
In order to investigate the origins of X-ray emission of the resolved sources, we performed spectral analysis. However, photon statistics of faint X-ray sources with a significance as low as 4–5 are too poor to obtain any spectral information other than the position and the total flux. Then, we took a method to select samples for the spectral analysis and classify them into several groups according to the flux and the simple spectral parameters such as the hardness and the softness. As for samples with photon statistics unsatisfactory for a detail analysis, we inquired further spectral information for source groups and analyzed the spectra summed within each group. Here, we utilized a photon index and an absorption column density obtained from a spectral fitting with a power-law model as the hardness and the softness because simple photon counts in each energy band reflect not only the shapes of original X-ray spectra but also the effective area whose energy dependence varies within a FOV of the GIS.
All the spectral analysis was performed according to the standard analysis procedure supported by the ASCA Guest Observer Facility of NASA/GSFC. The X-ray spectrum of each source was extracted within from the source center and the background spectrum is extracted from the the same off-axis region within the FOV of the GIS masking the detected sources. To gain the statistical accuracy, we utilized the spectra summed of the GIS-2 and the GIS-3 for the model fitting. Also, we eliminated the sources more than 18′ apart from the optical center on the GIS beforehand, since the response function near the edge of the FOV is not calibrated.
We first collected the sources with a significance larger than 5 as samples for the spectral analysis and fitted these spectra with a simple power-law with an absorption model. The fluxes of 5 sources are approximately ergs cm-2 s-1 in this survey condition. The fits were accepted in most sources within a 90% confidence level of the relatively large statistical errors although there are a few sources not to accept that simple model. The parameters of the best-fit power-law models are shown for each sample sources in Table 2. Also, relation between the absorption column densities and the photon indices of all the sources is shown in Figure 5, where the sources identified with the cataloged sources are distinguished by different marks. We see in Figure 5 that the sources identified with the ROSAT and the SIMBAD-star catalogs are distributed near the lower boundary of the absorption column density, cm-2. It is naturally expected from the fact that the optical and the soft X-ray photons are easily absorbed by the Galactic ISM.
We next extracted ten relatively-bright sources with a flux above ergs cm-2 s-1 based on the flux of the best-fit power-law model. These sources were excluded from the grouping spectral analysis in the below, since such bright sources dominate the summed spectra within each group if they are added to the group members. These sources have enough photon statistics to investigate each source properties individually. We also examined flux variabilities for these sources by fitting a constant flux model to the light curves summed of the GIS-2 and the GIS-3 with 256-s and 1024-s bins. We recognized a source to be variable if the constant model was unacceptable within a 99% confidence limit. Obtained spectral parameters, flux variabilities, and known identifications of these sources are summarized in Table 5. We can easily see in Table 5 that these sources can be distinguished into two groups: Some with soft X-ray spectra, exhibiting a large power-law index of , are identified with SNRs, and the others with hard X-ray spectra, exhibiting a small power-law index of , show flux variabilities.
After that, we classified the residual 93 faint sources into six groups by the best-fit power-law index, , and the absorption column density, , and analyzed spectra summed within each group. The fluxes of the sources utilized here are within ergs cm-2 s-1. Considering possible shapes of X-ray spectra expected from those of known X-ray sources and the scatter of the relation in Figure 5, we adopted the grouping criteria described in Table 6. The boundaries of the groups on relation are illustrated in Figure 5. The number of sources belonging to each group and the numbers of the members identified with SNRs and SIMBAD optical stars are shown in Table 6. Figure 6 shows the summed spectra within each group. It is remarkable that iron K-shell line emission is apparently seen at the energy 6.5 keV in the spectra of the groups (b-ii) and (c-ii), however the other group have no apparent iron-line features. Also, the spectra of the groups (b-ii), (c-i), and (c-ii) show silicon K-shell line at the energy 1.8 keV. The coexistence of the silicon and the iron lines in the groups (b-ii) and (c-ii) implies that the plasma of the emission origin does not reach the thermal equilibrium state. Then, we tried to fit those spectra to some spectral models including power-law, thin-thermal plasma emission coded by Raymond& Smith (1977), and their two-component combinations. Here, we used the sum of the response functions for all the group members as the response for the summed spectra. Thus, the flux obtained from the fitting model represents the averaged flux within the group. We first assumed the plasma metal abundance, , as 1 solar and next floated it if any 1-solar plasma models are unacceptable. Results of these spectral fits are summarized in Table 7 and the best-fit models are shown in Figure 6 together with the data.
3.7 Completeness map and LogN-LogS relation
Sensitivity of the source survey depends on the image response functions of the instruments, the background and the exposure time. These factors vary from pixel to pixel in the area surveyed. To study the population of the discrete sources (for example, the LogN-LogS relation), correction for the difference in sensitivity is required.
From the definitions of in equation (7) and the significance in equation (6), we can calculate the significance of a trial point source with any flux at any position in the area surveyed if we know the profile of the background GRXE image, . The completeness area, , which is the area surveyed with a certain significance limit of for a given flux , can be easily obtained from the significance map. Here, we employed the best-fit model for the GRXE image in the image fitting of the source survey and calculated the completeness area for the significance limits of 4 and 5. Figure 7 shows the obtained completeness area in each energy band of 0.7–2, 2–10 and 0.7–7 keV. The adequacy of the background model is discussed in the next section.
The number density of X-ray sources with a flux larger than a given value , so called ’LogN-LogS relation’, gives important clues about the spatial distribution and the luminosity function. The LogN-LogS relation can be derived from the raw number of resolved X-ray sources and the completeness area. We calculated the LogN-LogS relation from the differential number density, which is represented by
| (9) |
where is the raw number of detected sources with a flux larger than and a significance above . The LogN-LogS relation was derived by integrating the above equation. Figure 7 shows the obtained LogN-LogS relations for significance limits of 4 and 5 and in the 0.7–2, 2–10 and 0.7–7 keV energy bands.
3.8 Verification of the image fitting analysis
In this section, we verify the adequacy of the methods of the image fitting analysis and the error estimation.
In this image fitting analysis, we assumed that the surface brightness of the GRXE can be approximated by the composition of two components: discrete point sources and uniform background emission.
For the model of the discrete sources, the PSF and the effective area are calibrated well by observational data within a systematic error smaller than 5% Takahashi et al. (1995). Those errors were included in estimating the fitting errors as the 5% systematic errors. If a source is spatially extended more than the HPD of the PSF, the discrepancy of the real response from the PSF should be large. However, extended X-ray sources are fairly restricted to only a few kinds of sources such as SNRs, which are expected to be known from the catalog of the Galactic SNRs observed in radio Green (1998). Also, the fraction of SNRs in the resolved X-ray sources was as small as 10% (Table 4). Thus, systematic error in the model for discrete sources is not severe.
The adequacy of the uniform background emission model had not been confirmed for the GRXE. To verify the background model, we fitted the raw observed image to the background model without systematic errors, masking the resolved sources. The residuals of the fit should imply the systematic errors of the model and the fluctuation of the background emission in a scale smaller than that of the GIS FOV (). The fit was performed for the image composed of the GIS2 and the GIS3 data and binned by 1212 pixels (3′3′) in order to obtain good enough photon statistics for the background GRXE image. In the 1212-bin image, 40–50 photons were typically expected in each bin under the conditions of this survey observation. Also, since the bin size of 12 pixel is similar to the HPD of the PSF, event counts of each bin can be considered to be independent throughout the observed field. The fit resulted in a significant detection of the residual fluctuation. However, the amplitude of the residual fluctuation was evaluated to be at most 11% of the Poisson errors in the 1212-bin image Sugizaki (1999). If we assume that the residuals of the fluctuation is scaled by a bin size, the ratio of the residual fluctuation to the Poisson error is reduced to 3.5% in the 44-bin image. That assumption is reasonable because the fluctuation on scales smaller than the HPD of the PSF should be smoothed by the PSF in the observed image. The obtained value of 3.5% is in reasonable agreement with the 5% systematic errors included in the model fitting of source survey. Thus, the discrepancy of the background model from the real surface brightness was appropriately accounted for in the source survey.
From these verifications, the results of the image fitting analysis are confidently confirmed. The origin of the residual fluctuation in the background GRXE image detected in this verification procedure will be discussed in a separate paper.
4 Discussion
As a result of image analysis, we succeeded in resolving 163 faint X-ray sources with a flux down to ergs cm-2 s-1 and determined large-scale longitude intensity variations of the GRXE, eliminating a contamination of the resolved discrete X-ray sources. We analyzed spectra of the resolved sources and classified due to the spectral properties in order to search for their identifications. We also derived the LogN-LogS relations of these sources. Particularly, in the energy band above 2 keV, the LogN-LogS relation of the Galactic X-ray sources down to ergs cm-2 s-1 was obtained for the first time in this ASCA survey.
In the follwing, we consider the implications of these results; (1) longitude intensity profiles of the GRXE, (2) spectral properties and identifications of the resolved sources, and (3) LogN-LogS relations of the resolved sources. We discuss in the soft and the hard band separately since the influence of the obscuration by the ISM on the Galactic plane is quite different between the X-ray bands below and above 2 keV.
4.1 Longitude profile of the Galactic ridge X-ray emission
4.1.1 Soft band
We can see from Figure 2 that the large-scale longitude profile of the GRXE in the soft X-ray band below 2 keV is fairly variable and asymmetric across the Galactic center with an enhancement on the side. The large-scale profile of soft X-ray on the Galactic plane has been observed in the past X-ray sky surveys such as the HEAO-1 Garmire et al. (1992) and the ROSAT Snowden et al. (1997) surveys. The result of the ASCA survey is consistent with the past observations although there are slight differences in detail because of the differences of the spatial resolution and the energy dependence of effective area among those surveys.
The observed large variability of the profile is reasonably expected from the fact that the soft X-ray band below 2 keV is heavily obscured by the ISM on the Galactic plane. Thus, the profile of the surface brightness reflects the both distributions of emission sources and absorbing matters located less than kpc from the Solar system. From the all-sky map obtained in the past sky survey Garmire et al. (1992); Snowden et al. (1997), it is suggested the the large-area emission comes from hot plasma with a temperature of about K associated with local hot bubbles such as the Loop I and the Local Hot Bubble (LHB) (e.g., Egger & Ashenbach 1995). The longitude profile obtained in the ASCA survey also confirmed this picture approximately although the profile on the Galactic plane is rather complicated because of the coexistence of the emission region and the thick obscuring ISM. The large enhancement of the emission in the direction towards corresponds to the direction to the Loop I and the peaks in the direction towards and correspond to the interacting rims of the Loop I with the LHB.
Also, it is suggested from the energy spectra of the scutum arm obtained by ASCA that the origin of the soft X-ray component in the GRXE can be explained by hot plasma produced in SNRs Kaneda et al. (1997). These spectral properties are also consistent with the picture of local hot bubbles.
4.1.2 Hard band
The large-scale profile of the GRXE in the X-ray band above 2 keV has previously estimated by the EXOSAT survey in the 2–6 keV band Warwick et al. (1985), by the Ginga survey in the 1–20 keV band Yamauchi & Koyama (1993) and by the RXTE survey in the 2–60 keV band Valinia & Marshall (1998). However, since the previous observations had no imaging capability, their sensitivities for discrete sources were seriously affected by the confusion of bright Galactic X-ray sources. Thus, inclusive contribution of faint discrete sources has been difficult to be estimated. In this ASCA survey, we successfully determined the profile, eliminating the contamination of resolved discrete sources with a flux down to ergs cm-2 s-1.
If the energy band is limited to above 4 keV, the obscuration by the ISM is negligible and also confusion of the soft X-ray component of the GRXE may be neglected Kaneda et al. (1997). We can see from Figure 2 that the obtained longitude profile in the energy band above 4 keV is relatively symmetrical and that the emission is strongly enhanced within the area of if the CXB component is subtracted. The area of corresponds to the Galactic inner disk with a radius of 4 kpc. Thus, it reveals that the emissivity of the GRXE is considerably concentrated within the Galactic inner disk.
Also, in addition to the symmetrical component, large peaks are apparently seen in the directions to , which correspond to the tangential direction of the 4 kpc arm. Then, we next compared the fine longitude variation of the GRXE in the 4–10 keV band with the profiles of radio emission at 408-MHz Haslam et al. (1982) and 115-GHz CO-line Dame et al. (1987). These radio bands are almost transparent in the Galactic ISM and the both spatial resolutions are , which is sufficient for comparison with the obtained GRXE profile. The 408-MHz radio emission is mainly originated by synchrotron radiation of relativistic cosmic-ray electrons with an energy of GeV under the G magnetic field in the Galaxy, thus the profile is expected to be associated with high-energy phenomena such as SN explosions in the Galaxy. On the other hand, the CO-line emission is associated with dense molecular clouds, which should be good tracer of the Galactic arm structures.
Figure 8 shows the longitude intensity profiles of radio emission at 408-MHz and CO-line, superposing the profile of the GRXE in the 4–10 keV band, where the profile at 408-MHz is averaged within and the profile at CO-line is averaged within in the direction to the Galactic latitude. Also, the inclusive CXB component is subtracted in the 4–10 keV profie. We see in Figure 8 that the correlation between the 4–10 keV X-ray and the 408-MHz radio is fairly good and apparently better than the correlation with the CO-line. These relationships might imply the connections of the GRXE with the cosmic-ray electrons suggested by Valinia et al. (2000), and/or with the magnetic field suggested by Tanuma et al. (1999), although the electrons contributing to the GRXE should be different from those responsible for the 408-MHz synchrotron radiation (Skibo, Ramaty & Purcell 1996).
4.2 Identification of the resolved X-ray sources
The of the resolved X-ray sources in this ASCA survey have been unidentified with cataloged X-ray sources, SNRs, and optical stars in the SIMBAD database. Thus, they might represent a new aspect of X-ray sources in the Galaxy. Here, we consider the origins of the unidentified sources resolved in the ASCA survey based on the results of the spectral analysis in 3.6.
4.2.1 Relatively bright X-ray sources with ergs cm-2 s-1
As for the ten relatively bright sources with a flux above ergs cm-2 s-1, we analyzed the spectra individually and also investigated the flux variabilities. These results are clearly distinguished into two groups. Some with soft X-ray spectra showing a power-law index of , are identified with SNRs. These soft X-ray spectra are agreed with the typical SNR spectra, which show hot plasma emission with a temperature of 0.1–2 keV. Results of these detailed spectral analyses have been already reported (see references in Table 5). On the other hand, the others with hard X-ray spectra showing a power-law index of , are unidentified with the cataloged X-ray sources and found to show flux variabilities. These variable sources are considered to be binary X-ray systems embodying compact degenerate stars such as white dwarfs, neutron stars, and black holes. Since the absorption column density is larger than cm-2 for any of these sources, it is reasonable that no optical counterparts are identified for these sources. Comparing with the spectra of the known Galactic X-ray sources, one of these, AX J1538185541, which shows the power-law index of , is likely to be a low-mass X-ray binary (LMXB) (e.g. Mitsuda et al. 1984) and the others with the indices of is likely to be high-mass X-ray binaries (HMXBs) (e.g. Nagase 1989). Magnetic CVs are also considered as anther possible candidates for the latter harder X-ray sources since the spectra can be explained by a multi-absorption hot plasma emission model, too. As one example, AX J1832210840, which shows a 1549-s coherent pulsation, are considered to be probably a magnetic CV because a significant iron K-line emission with a line center energy of 6.7 keV are detected with a follow-up observation Sugizaki et al. (2000).
These identifications are summarized in Table 5.
4.2.2 Faint X-ray sources with ergs cm-2 s-1
As for the faint sources with a flux below ergs cm-2 s-1, we collected source samples with a significance above 5, and classified them into the six groups due to the power-law index and the absorption column density obtained from the fitting with a power-law model. We analyzed the spectra summed within each source group. Since the sources belonging to the same group share common spectral properties, they are considered to be a similar kind of X-ray sources. In the following, we estimate the typical luminosity and the space number density for each source group taking account of the grouping criteria and the observation condition in this ASCA survey, and discuss about the origins.
Assuming the limit of the source visibility from the solar system as pc for all the area surveyed, the number density of the detected sources, pc-3, is represented by
| (10) |
where is the number of detected sources and is the solid angle of the area surveyed, here 39.8 deg str. We can estimate the number density from equation (10) if we know the limit of the visibility. Here, we estimate the limit of the visibility to each source group from the constraint to the ISM column density, assuming the averaged ISM density on the Galactic plane to be cm-3 as a canonical value. Since the area surveyed is fairly restricted to the low Galactic latitude area of , the visibility determined by the ISM absorption should be almost same within the area surveyed.
The group (a) is classified with a hard spectral index of . Assuming that all the sources are belonging to the Galaxy, is approximated by the distance to the edge of the Galaxy, 18 kpc. Thus, the number density of this group is estimated at pc-3 as the lower limit. Also, assuming that the distance to the sources is 8 kpc as the typical Galactic sources, the luminosity is estimated at ergs s-1 from the averaged flux in table 7. Comparing the summed spectrum with those of the known X-ray sources, the property of the flat spectrum is good agreed with that of HMXB pulsars (e.g. Nagase 1989). As one evidence, a 715-s periodic pulsation is discovered from one of these sources, AX J1700064157, using data taken in the observation for another target (Torii et al., 1999). In this survey observation, pulsation is hard to be recognized because the exposure time of 10 ks in each pointing is not enough for pulse search analysis. The obtained luminosity of ergs s-1 is by one order of magnitude smaller than that of the known faintest X-ray pulsar. Thus, unidentified sources in this group are considered to be HMXB pulsars which have ever been unrecognized under the sensitivity limit. Another possibility to explain the flat spectrum is a multi-component spectrum with different absorption column densities. In fact, the summed spectrum is also fitted with a multi-absorption thin-thermal plasma model with a temperature of keV. Such spectra are observed in some magnetic CVs (Ezuka & Ishida, 1999) and the obtained average luminosity in this group is also agreed with that of the typical magnetic CVs.
The group (b-i) is classified with a photon index of and an absorption column density of cm-2. The summed spectrum is represented by a single power-law and shows no significant emission line. From the upper-limit of cm-2 to the ISM column density, the distance to the sources is restricted to be less than 2.6 kpc. Then, the luminosity is estimated to be below ergs s-1 from the observed flux and the number density is estimated at pc-3. Six of a total of 23 sources in this group are identified with optical stars in the SIMBAD database. However, the summed spectrum in this group, represented by a single power-law of , is not agreed with typical X-ray spectra of stars, which show thin-thermal plasma emission with a temperature of 0.1–3 keV even if they are late-type Singh et al. (1999) or early-type (Cohen, Cassinelli & Waldron 1997). If the observed spectrum is fitted with thermal models, it is derived that the plasma temperature should be as high as keV and the plasma abundance should be as low as . Although such a low abundance plasma is observed in some active coronae Singh et al. (1999), the plasma temperature of keV seems to be too high. Thus, emission from optical stars should not occupy a dominant fraction of this group. The spectral property of a power-law of rather resembles that of bright Low Mass X-ray Binaries (LMXBs) (e.g. Mitsuda et al. 1984). However, the luminosities of bright LMXBs are within – ergs s-1. When the LMXBs are in quiescence with a luminosity as low as ergs s-1, they likely show very soft spectra represented by a thermal bremsstrahlung with a temperature of keV (Asai et al., 1998), which should be classified in the group (c-i). However, some of quiescent LMXBs exhibit hard tails with a photon index of (Asai et al., 1996). They are agreed with this group. Thus, this type of LMXBs in quiescent state is one of possible candidates. Another possibility is a rotation powered pulsar such as the Crab pulsar. Some of rotation powered pulsars and their pulsar nebula are found to have non-thermal hard spectra represented by a power-law of (Kawai, Tamura & Shibata 1998). Since the photon statistics of each source is very poor and the time resolution is not so good in this survey observation, evidence of pulsation is hard to be recognized even if they show periodic pulsation. Considering those facts, the sources in this group might be quiescent LMXBs or faint Crab-like pulsars which come to be observed in this survey.
The group (b-ii) is classified with a photon index of and an absorption column density of cm-2. Assuming that the absorption column density is responsible for the ISM, the distances to the sources are in kpc range. Thus, the typical luminosity and the number density of the sources in this group are estimated at ergs s-1 and pc-3, respectively. The summed spectrum shows strong iron and silicon K-line emissions. The coexistence of the iron and the silicon lines implies that the emission comes from hot plasma in multi-temperature and/or ionization nonequilibrium state. The spectrum can be fitted with a two-temperature thin-thermal plasma model with best-fit temperatures of 6.7 keV and 0.28 keV. The most promising candidates of the origins of this group are considered to be magnetic CVs from the high plasma-temperature of 6.7 keV and the strong iron K-line. Magnetic CVs exhibit spectra of multi-temperature plasma due to temperature gradient in the accretion column Fujimoto & Ishida (1997). X-ray emission from hot plasma at the bottom of the accretion column is expected to be absorbed by the outer cool part. Thus, it is possible that the observed value includes intrinsic absorption to some content, and that we choose magnetic CVs by source selection with a medium absorption column density in this group.
The group (b-iii) is classified with a photon index of and an absorption column density of cm-2. The column density of cm-2 is near to that of the interstellar medium integrated all over the Galaxy. Thus, if the emission source has no intrinsic absorption, it should be outside of the Galaxy. The X-ray spectrum of the power-law with the photon index is agreed with that of typical active galactic nuclei (AGNs). Estimating the number of extragalactic sources included in this source sample from the LogN-LogS relation of the extragalactic sources (Ueda et al., 1999) and this survey condition, it is derived to be 12, which occupy % in this group. Thus, the major part of this group is considered to be extragalactic sources observed through the Galactic ISM. On the other hand, three sources in this group are identified with SNRs. The two of these are classified into center-filled type SNRs, including G10.00.3 which is also identified as soft gamma-ray repeater, SGR180620 Sonobe et al. (1994); Kouveliotou et al. (1998). Thus, some of this group might be compact X-ray sources involved in SNRs.
The group (c-i) is classified with a photon index of and an absorption column density of cm-2. From the upper-limit of cm-2 to the ISM column density, the distance to the sources is constrained to be less than 9.7 kpc in this group. Thus, the typical luminosity is estimated at ergs s-1 and the number density of the sources is estimated at pc-3. The X-ray spectrum summed in this group shows strong silicon K-line emission and is represented by two-component thin-thermal plasma model with temperatures of 0.4 keV and keV. The model of the hard component is not determined here since the relative intensity of the hard component is very small and an iron K-line emission is not significantly observed. Six of a total of 12 sources in this group are cross-identified with the ROSAT all-sky survey and three of these are also identified with SNRs. Also, other three sources are identified with optical stars in the SIMBAD database. The most of the ROSAT sources on the Galactic plane are identified with stellar active coronae and the rest are identified with OB stars and CVs (Motch et al., 1997). The obtained summed X-ray spectrum, exhibiting plasma emission with a temperature of keV, are good agreed with these sources. Thus, the majority of the sources in this group is considered to be active coronae and some of OB stars, CVs, and SNRs are expected to be contained. LMXBs in quiescence are also considered as another minor candidate for this group, which is described in the group (b-i).
The group (c-ii) is classified with a photon index of and an absorption column density of cm-2. We cannot estimate the distance to the sources from the ISM absorption. Thus, we approximate it by the distance to the edge of the Galaxy, 18 kpc, assuming that all the sources in this group are in the Galaxy. The number density of this group is estimated at pc-3 as the lower limit. Also, assuming the distance to the typical Galactic sources as 10 kpc, the typical luminosity is estimated at ergs s-1 from the averaged flux. The X-ray spectrum summed within this group, exhibiting strong silicon and iron K-line emissions and fitted with a two-temperature thin-thermal plasma model, resembles that of the group (b-ii). The difference is in the temperature of the hard component: keV in this group is lower than keV in the the group (b-ii). Thus, these identifications can be discussed similarly and magnetic CVs are considered to be the most promising candidates. However, since the plasma temperature of keV is relatively low, active coronae with a highest plasma temperature are considered as another possible candidates. Also, the three sources are identified with the SNRs. However, since the plasma temperature of the typical SNR is not so high to exhibit strong iron K-shell line, the fraction of SNRs in this group should be little if unidentified SNRs are contained.
The estimated number densities, the typical luminosities, and the identifications of the grouped faint X-ray sources are summarized in Table 8.
4.3 LogN-LogS relations of the faint Galactic X-ray sources
The LogN-LogS relation is one of the most important sources of information about the spatial distribution and the luminosity function. However, in the case of Galactic sources, simple approximation of an infinite Euclidean distribution is not appropriate because of the finite scale of the Galaxy, local irregularities such as arm structures, obscuration of the thick ISM on the Galactic plane, and contamination from the extragalactic sources coming through the ISM. Moreover, we need to take account of the limited area coverage to the low latitude region of in this ASCA survey. We discuss the implications of the LogN-LogS relations considering those conditions.
4.4 Soft band
4.4.1 Contamination by extragalactic sources and the LogN-LogS relation of the Galactic sources
The obtained LogN-LogS relation might contain some extragalactic sources. Here, we estimate the LogN-LogS relation of the extragalactic sources observed through the Galactic plane.
The LogN-LogS relation of the extragalactic X-ray sources below 2keV have already been measured by Einstein (e.g., Gioia et al. 1990), ROSAT (e.g., Hasinger et al. 1993) and ASCA Ueda et al. (1999) and the consistency of these results was confirmed. We utilized the LogN-LogS relation obtained in the Einstein survey here, which is expressed by
| (11) |
where is the flux of the 0.3–3.5 keV band.
On the Galactic plane, soft X-rays from extragalactic sources are heavily absorbed by the ISM. These fluxes need to be corrected for the absorption of the ISM in order to estimate the contamination from extragalactic sources. We estimated the averaged column density for the extragalactic sources in the area surveyed at 51022 cm-2 from Figure 2. Assuming a power-law photon index of as a typical spectrum of extragalactic sources, photons coming through the Galactic plane with cm-2 are reduced by a factor of in the GIS 0.7–2 keV band. Converting the energy flux of the 0.3–3.5 keV band to the photon flux of the GIS 0.7–2 keV band and taking the Galactic absorption into account for the typical power-law spectrum, the LogN-LogS relation of the extragalactic sources observed through the Galactic plane is estimated to be
| (12) |
This is shown in Figure 9 together with the LogN-LogS relation of the Galactic X-ray sources resolved in this survey. We see that the contamination from extragalactic sources is negligible in the soft X-ray band. Thus, all the sources detected in the soft X-ray band are considered to be Galactic sources located near to the Solar system without large interstellar absorption.
4.4.2 Comparison with previous work and the implications of the LogN-LogS relation
The obtained LogN-LogS relation of the Galactic X-ray sources in the soft X-ray band is shown in Figure 9. The profile is rather flat and far from a simple single power-law which is expected for a uniform infinite spatial source distribution. In the soft X-ray band, the LogN-LogS relation of Galactic X-ray sources has previously been measured with Einstein Hertz & Grindlay (1984) and ROSAT Motch et al. (1997) surveys although the survey areas are different from each other. The LogN-LogS relations of the Einstein and the ROSAT surveys are shown in Figure 9 together with the ASCA result. Here, notice that the fluxes measured with different instruments should depend slightly on the assumed spectral model. We assume a power-law spectrum with a photon index of and an absorption column density of cm-2 for the Galactic X-ray sources and use the PIMMS software Mukai (1993) to convert energy flux.
We can see that the LogN-LogS relations in the soft X-ray band obtained by the Einstein, the ROSAT, and ASCA surveys are slightly different. It can be reasonably expected from the fact that the kinds and the populations of X-ray sources in these source samples are quite different from each other due to the differences of the energy dependence of effective area and the direction of the area surveyed. The Einstein survey in Hertz & Grindlay (1984) is based on a serendipitous source survey within in the IPC field, eliminating a primary target. The total covering area of 275.7 deg2 takes 2.6% of the region. The 46% of the Einstein sources are identified with stellar coronae and the contamination of extragalactic sources is estimated at 23%. Such a significant contamination of extragalactic sources is quite different from the other surveys. It is owing to the relatively large scale height of of the area surveyed, where the column density of the ISM is cm-2, smaller by two orders of magnitude than that on . Also, the ROSAT survey in Motch et al. (1997) used the data of the low diffuse-background Cygnus area observed in the ROSAT all sky survey, which covers 64.5 deg2 of a rectangular region centered at . The majority about 85% of the ROSAT sources are identified with stellar active coronae. On the other hand, we know from the spectral analysis of the resolved sources in 3.6 and the discussion in 4.2 that the ASCA sources include several kinds of X-ray sources with various X-ray spectra and the ratio of candidates of active coronae with soft X-ray spectra is not so large. It is considered to be due to the energy dependence of the effective area of the ASCA-GIS increasing toward higher energy in the 0.7–2 keV band, which is contrary to the ROSAT-PSPC. Thus, the LogN-LogS relation of the ASCA Galactic X-ray sources obtained here in the soft X-ray band is considered to reflect the complex mixtures of various X-ray sources located near the Solar system.
4.4.3 Contribution to the GRXE
We estimate the contribution of the resolved faint X-ray sources to the GRXE based on the LogN-LogS relation obtained. The average surface brightness within the central emission region of in the 0.7–2 keV band is derived to be ergs cm-2 s-1 deg-2 from the large-scale profile in Figure 2. The total flux of the resolved X-ray sources, , is calculated from the LogN-LogS relation by
| (13) |
where and are the minimum and the maximum fluxes of the contributing X-ray sources. Here, we adopt cnts GIS-1 ks-1 from the minimum flux of the resolved X-ray sources and cnts GIS-1 ks-1 corresponding to ergs cm-2 s-1, the lower-limit of bright sources excluded from the analysis. Calculating equation (13) and converting the unit of flux to ergs cm-2 s-1 deg-2, the accumulated surface brightness, , is derived to be ergs cm-2 s-1 deg-2. Therefore, the contribution of the resolved faint X-ray sources to GRXE is . Although we do not know the number density of the sources with a flux smaller than the detection limit, such a small value for the contribution of the resolved sources to the GRXE in this soft X-ray band is reasonable based on the hypothesis that the origin of the Galactic soft X-ray emission is diffuse hot plasma in local hot bubbles (e.g., Kaneda at al. 1997).
4.5 Hard band
4.5.1 Contamination by extragalactic sources and the LogN-LogS relation of the Galactic sources
Since the ISM on the Galactic plane is almost transparent in the X-ray band above 3 keV, the extragalactic X-ray sources should contribute to the LogN-LogS relation obtained in the 2–10 keV band. The LogN-LogS relation of the extragalactic sources in the band above 2 keV has been measured with HEAO-1 A2 Piccinotti et al. (1982), Ginga (Hayashida, Inoue & Kii 1990) and ASCA Ueda et al. (1999). These results are consistent within the errors. Here, we adopt the ASCA result, which is represented by
| (14) |
The flux in the 2–10 keV band is reduced by a factor of 0.78 for a typical power-law spectrum with a photon index of due to the absorption of the ISM with cm-2. Correcting this effect of the absorption and converting the energy flux in the units of ergs cm-2 s-1 to the count flux in the units of cnts GIS-1ks-1, the LogN-LogS relation of the extragalactic sources observed through the Galactic plane is estimated to be
| (15) |
This relation is shown in Figure 10, together with that of the Galactic X-ray sources resolved in this survey. We see that the LogN-LogS relation must be corrected for extragalactic sources.
The LogN-LogS relation of the Galactic X-ray sources in the 2–10 keV band, subtracting the contribution of extragalactic sources, is shown with the solid circles in Figure 10. Fitting a power-law model to the LogN-LogS relation of the Galactic sources, it is represented by
| (16) |
where the error of the power-law index represents the 90% confidence level. The slope of the power-law model is significantly flatter than , the value expected for a uniform infinite-plane source distribution. Also, note that it is consistent with the slope of the LogN-LogS relation of the bright Galactic X-ray sources measured by the previous non-miller instrument on Ariel-V Warwick et al. (1981) although these flux ranges are not overlapped.
4.5.2 Comparison with simulated LogN-LogS relations for typical source distributions
In the 2–10 keV band, we can observe almost throughout the Galaxy, escaping from the obscuration of the ISM. Thus, we can obtain information about the spatial source distribution in the Galaxy from the LogN-LogS relation. However, since the observed LogN-LogS relation is biased by the limited area coverage in this survey, it is not so easy to derive the implications. Thus, we take a method to calculate LogN-LogS relations to be observed for typical source distributions taking account of the area surveyed, and compare those with the observed relation. We examine the following simple axisymmetrical source distributions to confirm effects of scale height, Galactocentric radius and an arm structure:
-
(a)
uniform finite disk within kpc and with an exponential scale height of 100 pc
-
(b)
uniform finite disk within kpc and with an exponential scale height of 10 pc
-
(c)
uniform finite disk within kpc and with an exponential scale height of 1 pc
-
(d)
uniform finite disk within kpc and with an exponential scale height of 100 pc
-
(e)
circular arms at 4, 6, 8 kpc with an exponential scale height of pc,
where represents the Galactocentric radius. The distance from the Galactic center to the Solar system is assumed to be 8 kpc and the absorption of the ISM is neglected, which is adequate for the 2–10 keV band. The luminosity and the number density of the sources are assumed to be ergs s-1 and pc-3, however those do not affect the slope of the LogN-LogS relation. We here concentrate only on the slope of the LogN-LogS relation and do not care for the normalization. The scale height of 100 pc agrees with that of the GRXE (e.g., Warwick et al. 1985). Figure 11 shows results of calculation for spatial source distributions (a)–(e), together.
We can see from the profile of (a) that the slope of the LogN-LogS relation becomes for the simple finite disk distribution with an exponential scale height of 100 pc. The slope of is consistent with that for an infinite uniform 3-dimensional Euclidean distribution. This is because the area of the ASCA Galactic plane survey is limited to the low latitude of . The scale height subtending a FOV of radius reaches 100 pc at a distance of 14 kpc from the Solar system, which is comparable with the size of the Galaxy. Thus, the effect of the 2-dimensional distribution in the Galactic disk does not appear and the volume surveyed increases 3-dimensionally until the distance reaches 14 kpc. This geometrical configuration is illustrated in Figure 12. Comparing the profiles of (a), (b) and (c), it is found that the slope of the LogN-LogS relation becomes about if the scale height of the source distribution is as low as 10 pc.
The difference between models of (a) and (d) is in the radius of the distribution. The difference of the LogN-LogS relations is only in the lower limit of the power-law relation and has little influence on the slope of the LogN-LogS relation. Therefore, we need not care about the Galactocentric radius of the uniform finite disk distribution when we consider the slope of the LogN-LogS relation.
From comparison of the profiles of (b) and (e), we find that the LogN-LogS relation becomes flat for the arm distribution. This is because the spatial distribution of each arm is 1-dimensional.
4.5.3 Implications of the observed LogN-LogS relation
We consider possible source distributions in the Galaxy to satisfy the observed LogN-LogS relation, comparing with the calculated LogN-LogS relations for the typical source distributions taking account of the area surveyed.
First, we consider the situation where the luminosity of major X-ray sources contributing to the LogN-LogS relation is approximately the same and uniform spatially. The uniform finite disk model with a scale height of 100 pc cannot explain the slope of the observed LogN-LogS relation. If the scale height of the source distribution is restricted to be as low as 10 pc, the slope of the LogN-LogS relation comes near to . However the observed LogN-LogS relation in the 2–10 keV is even flatter.
One possible explanation is that 1-dimensional distributions of the sources in the Galactic plane, i.e. arm structures, are contributing. The calculated profile for model (e) approximately shows a flatter LogN-LogS relation than without arm structures. In order to make the LogN-LogS relation still flatter, the source density needs to decrease with increasing distance. This implies that the Solar system belongs to a spiral arm where the source density is high Matilsky (1979) and/or that the spiral arm structure has a small pitch angle Johnson (1978). If an appropriate model of the Galactic arm is assumed, a flat LogN-LogS relation consistent with the observation is possibly produced. However, this is beyond the scope at present discussion.
Another possibility is that the observed LogN-LogS relation reflects the luminosity function rather than the spatial distribution, like the soft X-ray band. However it is very unlikely considering that the obscuration of the ISM is almost negligible in this hard X-ray band. If the LogN-LogS relation represents the luminosity function of some dominant Galactic X-ray sources, all of the dominant sources in the Galaxy must be detected. For this, their luminosity should be higher than ergs s-1. It differs from the obtained properties of the resolved faint sources, of which a half shows little absorption column density, thus should have a luminosity much smaller than ergs s-1. Thus, the observed LogN-LogS relation should truly represent the spatial distribution.
4.5.4 Contribution of the resolved sources to the GRXE
We found from the grouping spectral analysis in 3.6 that there are groups of X-ray sources showing strong iron K-line emission, which have a possibility to satisfy the spectrum of the unresolved GRXE. These group members occupy of the total groups of the Galactic X-ray sources in a flux range of ergs cm-2 s-1. If such kinds of X-ray sources still remain unresolved in the flux range smaller than the detection limit, they should contribute to the GRXE in some degree.
Then, we estimate the contribution of the resolved faint X-ray sources to GRXE based on the obtained LogN-LogS relation. The calculation is the same as that for the 0.7–2 keV band. The average surface brightness within the central emission region of in the 2–10 keV band is derived to be ergs cm-2 s-1 deg-2 from the large-scale profile in Figure 2. The minimum flux of the resolved X-ray sources is cnts GIS-1 ks-1. The maximum flux of the integration is adopted as cnts GIS-1 ks-1 corresponding to ergs cm-2 s-1, the lower limit of the X-ray sources excluded from the faint source analysis. The integrated flux of the resolved X-ray sources is calculated by equation (13), which becomes ergs cm-2 s-1 deg-2. Therefore, the contribution of the resolved faint X-ray sources to the GRXE is . Moreover, even if we extrapolate the LogN-LogS relation in the flux range lower than the detection limit from the power-law relation of the resolved sources, the integrated flux increases at most by a factor of 1.3 because of the flat slope of the relation. Thus, we can explain only approximately 10% of the GRXE in the hard band by accumulation of discrete X-ray sources. The main origin of the GRXE is still unresolved.
5 Conclusion
We analyzed all the data of the ASCA Galactic plane survey covering the area of and almost completely, taking careful account of the complicated image response function. We derived the following observational results about the Galactic ridge X-ray emission (GRXE) and the resolved X-ray sources:
-
1.
The longitude intensity profile of the GRXE in a scale of a degree is determined in the energy bands of 0.7–2 keV, 2–4 keV, and 4–10 keV eliminating the resolved discrete sources. It is revealed from the profile in the energy band above 4 keV that the emissivity of the GRXE is strongly enhanced within the 4 kpc arm. The combined analysis of multi-wavelength data such as the correlation between the X-ray and the radio emission profiles might give a important clue to solve the unidentified origin of the GRXE.
-
2.
We resolved 163 X-ray sources by image analysis and investigated these identifications by catalog searches and spectral analyses. In order to overcome too poor photon counts of each faint source, we classified the sources into some groups due to the fluxes, the spectral indices and the absorption column densities, and analyzed the spectra summed within each group. We found the groups possibly identified with Cataclysmic Variables, high-mass X-ray binaries, quiescent low-mass X-ray binaries, and Crab-like X-ray pulsars which have not ever been recognized because of the low flux and the large absorption column density. However, since the observation condition is not enough to clarify the properties of each source individually, confident evidences such as periodic variations have not been obtained. Thus, we highly recommend following observations to confirm those facts by next generation X-ray satellites with a high sensitivity such as XMM-Newton.
-
3.
The LogN-LogS relations of the Galactic X-ray sources are obtained in the energy bands below and above 2 keV as the results of the source survey. In the band below 2 keV, the LogN-LogS relation has a flat slope with a power-law index larger than and shows a complex profile far from a single power-law relation. The relation is considered to reflect the complex mixtures of various X-ray sources located near the Solar system, taking account of the various spectra of the resolved X-ray sources and the visibility limit below 1 kpc in the 0.7–2 keV band. On the other hand, in the energy band above 2 keV, the LogN-LogS relation was obtained for the first time in the flux down to ergs cm-2 s-1. It is well-approximated by a single power-law with a slope of , which is also flatter than a slope of . Taking account of the good visibility in the energy band above 2 keV and the low-latitude area coverage of the ASCA survey, it implies that the spatial source distribution has a 1-dimensional arm structure in which the Solar system is included.
-
4.
The integrated fluxes of resolved X-ray sources contribute to the surface brightness of GRXE only by 10% in both energy bands below and above 2 keV. The flux of the unresolved GRXE in the below 2 keV is considered to come from hot bubbles near the Solar system. However, as for the origin of the GRXE in the energy band above 2 keV, no proper candidate can be recognized in this ASCA survey. This problem is left to future missions. As to resolving discrete sources, much more progress is expected from Chandra with a spatial resolution higher by three orders of magnitude than that of the ASCA.
Appendix A Coordinate system
The coordinate system employed in the standard data processing cannot be applied to the analysis of multi-pointing observations, because of large distortion when the image is larger than one GIS FOV. Also, the ’SKYXY’ coordinates adopted in the analysis of the LSS (Large Sky Survey, e.g., Ishisaki 1996, Ueda et al. 1999) are not appropriate for the analysis of the Galactic plane survey. Because it contains the tangential projection of the spherical image, the discrepancies of the celestial areas per pixel on the projected plane become severe for the long area map over . Thus, a new coordinate system, namely ’GALXY’, is utilized to handle all the data of the Galactic plane survey. ’GALXY’ is a coordinate system based on the Galactic coordinate system adopting a Cartesian projection defined in FITS format (e.g., Harten et al. 1988). In this coordinate, the celestial area per pixel is kept constant on the Galactic plane. The size of the pixel agrees with that of the other coordinates at the center of the focal plane. The origin is assigned to the Galactic center. The value of (GALX, GALY) is easily calculated from the Galactic coordinates by the equation:
| (A1) |
where is the pixel size of the DETXY coordinates at the detector center; for the GIS. The values of the GALXY coordinates are labeled in Figure 1 throughout all the observed fields of the Galactic plane survey.
Appendix B Response functions for extended uniform surface emission
In the case where the emission region is uniformly extended over more than the FOV of the GIS, 45% of all the detected photons in the 0.7–2 keV band and 30% in the 2–10 keV band are stray light coming from outside the FOV Ishisaki (1996). Although the probability that a photon is reflected as stray light is very low, we have a large amount of stray light, as mentioned above, because the solid angle of the sky which can contribute is large.
We derive an image response to a uniform emission from observation. For that purpose, we can use CXB (cosmic X-ray background) images obtained from large blank sky observations Ueda et al. (1999). However, since the counting statistics of the CXB image are still not good enough even if we sum up all blank sky observations (8 cnts pixel-1) and since some CXB data contain spatial structure due to discrete sources, we decide to utilize day-earth images. The day-earth is the bright earth surface exposed to sunlight and can be regarded as having uniform surface brightness. The day-earth data accumulated from various observations with 4,120-ks exposure time have very high statistics of about 50 cnts pixel-1, therefore their statistical error is very small. The spectrum of the day-earth is extremely soft, so the energy dependence of the response needs to be corrected for. Since the energy dependence of the response function approximately depends only on the off-axis angle, the difference of the energy spectrum is corrected by the radial profile. The radial profile of the CXB image averaged over azimuthal angle has sufficient statistics. The detailed procedure to construct the template CXB model is described by Ishisaki (1996).
The CXB image models for the uniform emission are constructed in the three energy bands of 0.7–2 keV (soft), 2–7 keV (hard) and 0.7–7 keV (total). Then, the CXB image model of the appropriate energy band is adopted in the energy-sorted analysis. The image response depends on the energy spectrum; however, the differences of the integrated image for uniform surface emission are expected to be small within each energy band. The differences of the 0.7–7 keV image from both the image of the 0.7–2 keV and the 2–7 keV are less than 5% in RMS.
References
- Asai et al. (1996) Asai, K., Dotani, T., Mitsuda, K., Hoshi, R., Vaughan, B., Tanaka, Y. & Inoue, H. 1996, PASJ, 48, 257
- Asai et al. (1998) Asai, K., et al. 1998, PASJ, 50, 611
- Blanton & Helfand (1996) Blanton, E. L. & Helfand, D. J. 1996, ApJ, 470, 961
- Bleach et al. (1972) Bleach, E. A., Holt, S. S., Schwartz, D. A., & Serlemitsos, P. J. 1972, ApJ, 174, L101
- Burton (1985) Burton, W. B. 1985, A&AS, 62, 365
- Chen et al. (1999) Chen, Y., Sun, M., Wang, Z., & Yin, Q. F. 1999, ApJ, 520, 737
- Cohen, Cassinelli & Waldron (1997) Cohen, D. H., Cassinelli, J. P. & Waldron, W. L. 1997, ApJ, 488, 397
- Dame et al. (1987) Dame, T. M., et al. 1987, ApJ, 322, 706
- Egger & Ashenbach (1995) Egger, R., J., & Ashenbach, B. 1995, A&A, 294, L25
- Ezuka & Ishida (1999) Ezuka, H. & Ishida, M., 1999, ApJS, 120, 277
- Fujimoto et al. (1995) Fujimoto, R., et al. 1995, PASJ, 47, L31
- Fujimoto & Ishida (1997) Fujimto, R. & Ishida, M. 1997, ApJ, 474, 774
- Garmire et al. (1992) Garmire, G. P., Nousek, J. A., Apparao, K. M. V., Burrows, D. N., Fink, R. L., & Kraft, R. P. 1992, ApJ, 399, 694
- Gioia et al. (1990) Gioia, I. M., Maccacaro, T., Schild, R. E., Wolter, A., Stocke, J. T., Morris, S. L., & Henry, J. P. 1990, ApJS, 72, 567
- Green (1998) Green D. A. 1998, ‘A Catalogue of Galactic Supernova Remnants (1998 September version)’, Mullard Radio Astronomy Observatory, Cambridge, United Kingdom
- Haslam et al. (1982) Haslam, C. G. T., Stoffel, H., Salter, C. J. & Wilson, W. E. 1982, A&AS, 47, 1
- Harten et al. (1988) Harten, R. H., Grosbol, P., Greisen, E. W., & Wells, D. C. 1988, A&AS, 73, 365
- Hasinger (1993) Hasinger, G., Burg, R., Giacconi, R., Hartner, G., Schmidt, M., Trumper, J., & Zamorani, G. 1993, A&A, 275, 1
- Hayashida et al. (1990) Hayashida, K., Inoue, H., & Kii, T. 1990, in Frontier of X-ray Astronomy, ed. Y. Tanaka & K. Koyama (Tokyo: Universal Academy Press), 653,
- Hertz & Grindlay (1984) Hertz, P., & Grindlay, J. E. 1984, ApJ, 278, 137
- Hunter et al. (1997) Hunter, S. D., et al. 1997, ApJ, 481, 205
- Hwang et al. (2000) Hwang, U., Petre, R., & Hughes, J. P. 2000, ApJ, 532, 970
- Ishisaki (1996) Ishisaki, Y. 1996, PhD thesis, Univ. of Tokyo
- Ishisaki et al. (1997) Ishisaki, Y., et al. 1997, ASCA News, 5, 26
- Johnson (1978) Johnson, H. M. 1978, ApJ, 224, 381
- Kaneda (1997) Kaneda, H. 1997, PhD thesis, Univ. of Tokyo
- Kaneda et al. (1997) Kaneda, H., Makishima, K., Yamauchi, S., Koyama, K., Matsuzaki, K., & Yamasaki, N. 1997, ApJ, 491, 638
- Kawai, Tamura & Shibata (1998) Kawai, N., Tamura, K. & Shibata, S. 1998, in Neutron Stars and Pulsars: Thirty Years after the Discovery, ed. N. Shibazaki, N. Kawai, S. Shibata & T. Kifune (Tokyo: Universal Academy Press), 449
- Kerr et al. (1986) Kerr, F. J., Bowers, P. F., Kerr, M., & Jackson, P. D. 1986, A&AS, 66, 373
- Kouveliotou et al. (1998) Kouveliotou, C., et al. 1998, Nature, 393, 235
- Koyama et al. (1986) Koyama, K., Makishima, K., Tanaka, Y., & Tsunemi, H. 1986, PASJ, 38, 121
- Kubo et al. (1997) Kubo, H., et al. 1997, Guide to ASCA_ANL v2.00 by ASCA_ANL Working group
- Makishima et al. (1996) Makishima, K., et al. 1996, PASJ, 48, 171
- Matilsky (1979) Matilsky, T. 1979, Nature, 280, 298
- Mitsuda et al. (1984) Mitsuda, K. et al. 1984, PASJ, 36, 741
- Motch et al. (1997) Motch, C., Guillout, P., Haberl, F., Pakull, M., Pietsch, W., & Reinsch, K. 1997, A&A, 318, 111
- Mukai (1993) Mukai, K. 1993, Legacy, 3, 21
- Nagase (1989) Nagase, F. 1989, PASJ, 41, 1
- Ohashi et al. (1996) Ohashi, T. et al. 1996, PASJ, 48, 157
- Ottomann & Schmitt (1992) Ottomann, R., & Schmitt, J. H. M. M. 1992, å, 256, 421
- Piccinotti et al. (1982) Piccinotti, G., Mushotzky, R. F., Boldt, E. A., Holt, S. S., Marshall, F. E., Serlemitsos, P. J., & Shafer, R. A. 1982 ApJ, 253, 485
- Raymond & Smith (1977) Raymond, J. C. & Smith, B. W. 1977, ApJS, 35, 419
- Singh et al. (1999) Singh, K. P., Drake, S. A., Gotthelf, E. V. & White, N. E. 1999, ApJ, 512, 874
- Skibo, Ramaty & Purcell (1996) Skibo, J. G., Ramaty, R. & Purcell, W. R. 1996, A&AS, 120, C403
- Snowden et al. (1997) Snowden, S. L., et al. 1997, ApJ, 485, 125
- Sonobe et al. (1994) Sonobe, T., Murakami, T., Kulkarni, S. R., Aoki, T., & Yoshida, A. 1994, Nature, 436, L23
- Sugizaki (1999) Sugizaki, M. 1999, Ph.D. thesis, Univ. of Tokyo
- Sugizaki et al. (2000) Sugizaki, M. et al. 2000, ApJ, 534, L181
- Takahashi et al. (1995) Takahashi, T., et al. 1995, ASCA News, Vol.3, 34
- Tanaka et al. (1994) Tanaka, Y., Inoue, H., & Holt, S. S. 1994, PASJ, 46, L37
- Tanuma et al. (1999) Tanuma, S., Yokoyama, T., Kudoh, T., Matsumoto, R., Shibata, K. & Makishima, K. 1999, PASJ, 51, 161
- Torii et al. (1999) Torii, K., Sugizaki, M., Kohmura, T., Endo, T., & Nagase, F. 1999. ApJ, 523, 65
- Tsusaka et al. (1995) Tsusaka, Y., et al. 1995, Appl. Opt., 34, 4848
- Ueda et al. (1999) Ueda, Y., et al. 1999, ApJ, 518, 656
- Valinia & Marshall (1998) Va1inia, A., & Marshall, F. E. 1998, ApJ, 505, 134
- Valinia et al. (2000) Va1inia, A., Tatischeff, V., Arnaud, K., Ebisawa, K., & Ramaty, R. 2000, ApJ, 543, 733
- Vasist & Gotthelf (1997) Vasisht, G. & Gotthelf, E. V. 1997, ApJ, 486, L129
- Voges et al. (1999) Voges, W., et al. 1999, A&A, 349, 389
- Warwick et al. (1981) Warwick, R. S. et al. 1981, MNRAS, 197, 865
- Warwick et al. (1985) Warwick, R. S., Turner, M. J. L., Watson, M., G., & Willingale, R. 1985, Nature, 317, 218
- Worrall et al. (1982) Worrall, D. M., Marshall. F. E., Boldt, E. A., & Swank, J. H. 1982, ApJ, 255, 111
- Worrall & Marshall (1983) Worrall, D. M., & Marshall, F. E., 1983, ApJ, 267, 691
- Yamasaki et al. (1997) Yamasaki, N., et al. 1997, ApJ, 481, 821
- Yamashita et al. (1997) Yamashita, A., et al. 1997, IEEE Trans. Nucl. Shci., NS-44, 847
- Yamauchi et al. (1996) Yamauchi, S., et al. 1996, PASJ, 48, L15
- Yamauchi & Koyama (1993) Yamauchi, S., & Koyama, K. 1993, ApJ, 404, 620
- Yamauchi et al. (1998) Yamauchi, S., Koyama, K., Kinugasa, K., Torii, K., Nishiuchi, M., Kosuga, T., & Kamata, Y. 1998, Astronomische Nachrichten, 319, 111


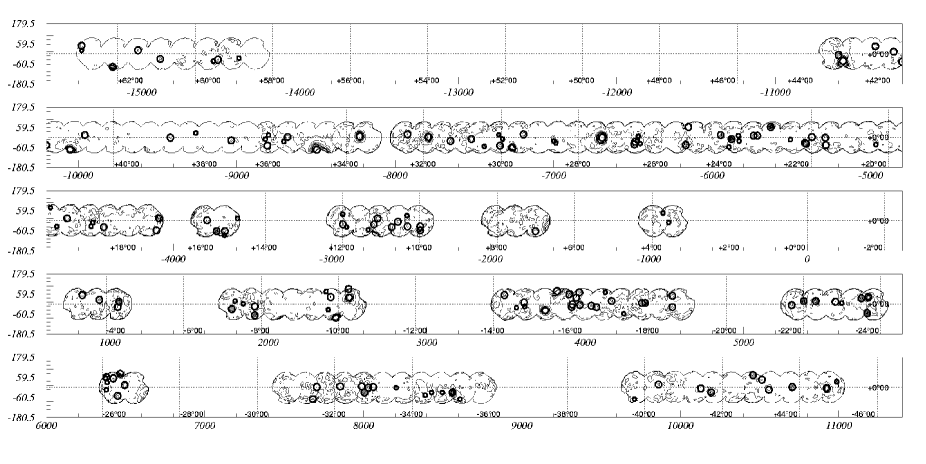


| Energy band | 0.7–2 keV | 2–10 keV | 0.7–7 keV | ||||||
|---|---|---|---|---|---|---|---|---|---|
| 1.0 | 2.0 | 4.0 | 1.0 | 2.0 | 4.0 | 1.0 | 2.0 | 4.0 | |
| 0.0 | 0.430 | 0.499 | 0.729 | 1.430 | 1.021 | 0.638 | 0.776 | 0.639 | 0.716 |
| 1.0 | 0.334 | 0.352 | 0.394 | 1.521 | 1.096 | 0.682 | 0.875 | 0.680 | 0.476 |
| 5.0 | 0.235 | 0.277 | 0.312 | 1.825 | 1.368 | 0.857 | 1.126 | 0.971 | 0.692 |
| ASCA namea | Positionb[∘] | Flux/Significancec | PL parametersd | Identificatione | |||
|---|---|---|---|---|---|---|---|
| 0.7–2 keV | 0.7–7 keV | Flux | |||||
| 2–10 keV | |||||||
| AX J1431486021 | 44.958 | 217.954 | —/— | 10.5/4.2 | |||
| 0.137 | 60.353 | 9.5/4.1 | |||||
| AX J1434166024 | 44.696 | 218.570 | 116.0/26.8 | 168.0/31.8 | 3.78 | 1RXSJ143415.0602438 | |
| 0.027 | 60.404 | 53.8/17.5 | 2.76 | SIM: HD127535 – Variable of RS CVn type(K1IV/Ve) | |||
| AX J1440426001 | 43.812 | 220.177 | 15.4/15.2 | 20.2/16.1 | 0.22 | 1RXSJ144037.9600138 | |
| 0.006 | 60.023 | 4.5/6.1 | 1.46 | G316.30.0, SIM: HD128696 – Star(G5) | |||
| AX J1445195949 | 43.207 | 221.330 | 0.6/1.1 | 12.4/10.3 | 0.90 | ||
| 0.059 | 59.830 | 10.5/10.0 | 0.35 | ||||
| AX J1445475931 | 43.026 | 221.446 | 6.1/4.0 | 15.6/6.3 | 0.34 | ||
| 0.186 | 59.532 | 9.7/4.8 | 0.89 | ||||
| AX J1447015919 | 42.797 | 221.757 | 8.2/4.5 | 19.7/7.3 | 0.54 | ||
| 0.301 | 59.330 | 12.9/5.8 | 0.89 | ||||
| AX J1456055913 | 41.717 | 224.022 | —/— | 34.3/17.3 | 5.61 | 1RXSJ145540.4591320 | |
| 0.125 | 59.230 | 31.6/17.5 | 3.14 | ||||
| AX J1457325901 | 41.455 | 224.386 | —/— | 6.0/5.5 | 0.69 | ||
| 0.027 | 59.022 | 4.8/4.7 | 1.89 | ||||
| AX J1504365824 | 40.358 | 226.152 | —/— | 6.3/5.3 | 0.58 | ||
| 0.072 | 58.412 | 5.7/5.9 | 1.25 | ||||
| AX J1510055824 | 39.736 | 227.524 | —/— | 7.4/2.4 | |||
| 0.288 | 58.415 | 8.5/4.8 | |||||
| AX J1537515556 | 35.234 | 234.466 | —/— | 8.5/4.9 | |||
| 0.288 | 55.938 | 7.4/4.2 | |||||
| AX J1538185541 | 35.038 | 234.576 | 4.5/4.6 | 124.8/38.9 | 21.92 | ||
| 0.125 | 55.690 | 130.8/40.6 | 0.91 | ||||
| AX J1539475532 | 34.776 | 234.949 | 1.8/3.4 | 3.9/4.6 | |||
| 0.125 | 55.534 | —/— | |||||
| AX J1541225522 | 34.498 | 235.342 | 4.2/4.3 | —/— | |||
| 0.125 | 55.367 | —/— | |||||
| AX J1542335519 | 34.334 | 235.641 | —/— | 5.5/4.2 | |||
| 0.190 | 55.321 | 4.3/3.9 | |||||
| AX J1545575443 | 33.581 | 236.491 | —/— | —/— | |||
| 0.010 | 54.719 | 3.1/4.2 | |||||
| AX J1549055420 | 32.992 | 237.272 | —/— | 5.1/5.0 | |||
| 0.006 | 54.342 | 4.1/4.6 | |||||
| AX J1549515416 | 32.861 | 237.465 | 3.7/5.2 | 13.8/10.7 | 1.51 | 2E1545.95407 | |
| 0.010 | 54.273 | 11.4/10.0 | 0.70 | ||||
| AX J1550355408 | 32.697 | 237.648 | 2.0/3.0 | 5.1/5.0 | 0.24 | ||
| 0.022 | 54.145 | 3.3/3.9 | 0.73 | ||||
| AX J1550525418 | 32.763 | 237.719 | 9.4/9.3 | 35.3/19.1 | 2.11 | 2E1547.05408(9) | |
| 0.125 | 54.301 | 25.9/16.6 | 0.80 | ||||
| AX J1553315347 | 32.140 | 238.382 | 2.5/3.6 | 6.8/5.9 | 0.27 | ||
| 0.022 | 53.794 | 3.9/4.2 | 0.80 | ||||
| AX J1556445325 | 31.535 | 239.185 | 3.8/5.5 | 5.0/5.2 | 0.06 | 1RXSJ155644.7532441 | |
| 0.006 | 53.419 | —/— | 1.05 | 2E1552.85316 | |||
| ASCA namea | Positionb[∘] | Flux/Significancec | PL parametersd | Identificatione | |||
|---|---|---|---|---|---|---|---|
| 0.7–2 keV | 0.7–7 keV | Flux | |||||
| 2–10 keV | |||||||
| AX J1558315334 | 31.436 | 239.631 | 5.9/5.5 | 13.4/7.7 | 1.11 | SIM: GSC08697-01180 – Star | |
| 0.288 | 53.581 | 8.2/5.8 | 1.41 | ||||
| AX J1619294945 | 26.460 | 244.871 | —/— | 125.7/8.2 | SIM: HD146628 – Star(B1/B2Ia) | ||
| 0.334 | 49.758 | 136.9/8.8 | |||||
| AX J1620115002 | 26.575 | 245.048 | —/— | 7.9/5.0 | 0.23 | ||
| 0.055 | 50.036 | 5.8/5.0 | 2.58 | ||||
| AX J1620464942 | 26.280 | 245.194 | 5.3/4.6 | 9.4/5.8 | 0.27 | SIM: EM* VRMF 1 – Emission-line Star | |
| 0.219 | 49.713 | 4.1/3.6 | 0.91 | ||||
| AX J1621254933 | 26.100 | 245.356 | 7.2/3.4 | 19.1/6.1 | 0.02 | ||
| 0.252 | 49.562 | —/— | 1.69 | ||||
| AX J1621384934 | 26.084 | 245.409 | —/— | —/— | SIM: CD-49 10572 – Star in double system(B) | ||
| 0.219 | 49.574 | 9.5/4.2 | |||||
| AX J1621554939 | 26.116 | 245.480 | —/— | 9.0/4.9 | SIM: HD147070 – Star(K3III) | ||
| 0.121 | 49.667 | 5.5/4.0 | |||||
| AX J1622085005 | 26.395 | 245.535 | —/— | 15.0/7.3 | 0.79 | ||
| 0.207 | 50.095 | 13.7/6.5 | 0.96 | ||||
| AX J1622464946 | 26.100 | 245.696 | —/— | 9.3/4.9 | |||
| 0.059 | 49.782 | 6.1/4.1 | |||||
| AX J1631594752 | 23.677 | 248.000 | —/— | 124.6/37.3 | 48.52 | ||
| 0.170 | 47.879 | 149.2/42.1 | 1.31 | ||||
| AX J1632524746 | 23.497 | 248.218 | 4.5/4.9 | 41.6/18.9 | 5.05 | 2E1629.14738 | |
| 0.137 | 47.769 | 43.8/19.2 | 1.61 | ||||
| AX J1633514807 | 23.644 | 248.463 | 43.5/17.0 | 60.1/18.3 | 1.12 | 1RXSJ163352.2480643, 2E1630.14800 | |
| 0.223 | 48.122 | 18.4/8.8 | 1.19 | SIM: HD148937 – Variable Star(O+) | |||
| AX J1635244728 | 22.990 | 248.854 | —/— | 5.8/4.2 | |||
| 0.022 | 47.474 | 5.4/4.5 | |||||
| AX J1635554719 | 22.826 | 248.981 | —/— | 8.8/6.7 | 1.21 | ||
| 0.055 | 47.331 | 9.5/7.6 | 0.91 | ||||
| AX J1637514656 | 22.318 | 249.464 | 14.2/13.3 | 35.3/20.5 | 2.02 | ||
| 0.072 | 46.944 | 21.2/15.7 | 0.99 | ||||
| AX J1639044642 | 22.007 | 249.768 | —/— | 38.9/18.2 | 19.18 | ||
| 0.072 | 46.713 | 47.8/21.7 | 0.86 | ||||
| AX J1640424632 | 21.696 | 250.176 | —/— | 10.4/6.9 | 1.21 | G338.30.0 | |
| 0.027 | 46.545 | 10.1/7.3 | 0.60 | ||||
| AX J1651054403 | 18.619 | 252.774 | 5.8/5.4 | 13.3/7.5 | 1.45 | ||
| 0.203 | 44.058 | 9.2/6.1 | 1.92 | ||||
| AX J1652174414 | 18.619 | 253.073 | 3.7/4.7 | 9.0/7.6 | 0.50 | ||
| 0.076 | 44.235 | 5.5/5.7 | 0.49 | ||||
| AX J1654204337 | 17.915 | 253.585 | 11.9/12.0 | 30.2/19.3 | 1.59 | 1RXSJ165424.6433758 | |
| 0.022 | 43.628 | 17.6/14.6 | 1.54 | SIM: HD326426 – Star(K5) | |||
| AX J1654374333 | 17.833 | 253.657 | 6.9/9.4 | —/— | 0.06 | 1RXSJ165442.5433346 | |
| 0.022 | 43.564 | —/— | 1.34 | SIM: HD152335 – Double or multiple star(F7V) | |||
| AX J1656464239 | 16.884 | 254.193 | 9.0/4.5 | 9.7/4.6 | 1RXSJ165650.0423906 | ||
| 0.284 | 42.660 | —/— | |||||
| AX J1657074255 | 17.047 | 254.280 | 10.2/5.9 | 16.9/6.9 | 0.90 | ||
| 0.072 | 42.921 | 7.2/5.9 | 0.38 | ||||
| AX J1657234321 | 17.358 | 254.348 | —/— | 3.5/2.0 | |||
| 0.239 | 43.358 | 6.9/4.2 | |||||
| AX J1659014208 | 16.212 | 254.758 | —/— | 18.4/8.4 | 6.40 | SIM: V* V921 Sco – Emission-line Star(Bpe) | |
| 0.284 | 42.135 | 20.3/9.3 | 1.05 | ||||
| AX J1659044242 | 16.654 | 254.770 | —/— | 12.7/8.3 | 1.13 | ||
| 0.076 | 42.705 | 12.4/8.6 | 1.33 | ||||
| AX J1659224234 | 16.523 | 254.846 | —/— | 6.0/5.4 | 0.20 | ||
| 0.043 | 42.582 | 5.5/5.6 | 1.96 | ||||
| AX J1659514209 | 16.131 | 254.965 | —/— | 4.4/2.7 | 4.04 | ||
| 0.153 | 42.152 | 8.6/5.3 | 0.28 | ||||
| ASCA namea | Positionb[∘] | Flux/Significancec | PL parametersd | Identificatione | |||
|---|---|---|---|---|---|---|---|
| 0.7–2 keV | 0.7–7 keV | Flux | |||||
| 2–10 keV | |||||||
| AX J1700064157 | 15.950 | 255.028 | 5.8/3.0 | 26.9/7.4 | 5.06 | ||
| 0.235 | 41.959 | 35.8/8.1 | 3.98 | ||||
| AX J1700174220 | 16.229 | 255.075 | —/— | 13.2/10.3 | 2.69 | ||
| 0.027 | 42.340 | 14.5/11.8 | 1.70 | ||||
| ∗AX J1700474139 | 15.639 | 255.199 | 11.1/1.9 | 1427.3/54.7 | 2E1657.24134 | ||
| 0.317 | 41.664 | 1751.0/62.2 | SIM: EXO 1657-419 – High Mass X-ray Binary | ||||
| AX J1700524210 | 16.032 | 255.221 | 4.6/5.2 | —/— | 0.24 | 2E1657.34204 | |
| 0.010 | 42.175 | —/— | 0.60 | ||||
| AX J1701124212 | 16.016 | 255.304 | —/— | —/— | 5.15 | ||
| 0.076 | 42.203 | 10.3/6.9 | 1.01 | ||||
| AX J1703494142 | 15.329 | 255.956 | 61.6/23.7 | 175.9/39.9 | 4.83 | G344.70.1 | |
| 0.158 | 41.709 | 110.1/31.0 | 6.57 | ||||
| AX J1704444109 | 14.788 | 256.186 | —/— | 4.4/5.6 | 0.79 | ||
| 0.039 | 41.160 | 4.2/6.0 | 0.46 | ||||
| AX J1705064113 | 14.805 | 256.276 | 2.8/4.9 | 3.1/4.1 | |||
| 0.059 | 41.233 | —/— | |||||
| AX J1705364038 | 14.281 | 256.403 | 8.0/6.1 | 12.8/7.0 | 0.23 | 1RXSJ170541.0403850 | |
| 0.219 | 40.647 | 4.8/3.7 | 1.91 | ||||
| AX J1705554104 | 14.592 | 256.482 | 3.8/4.3 | —/— | |||
| 0.092 | 41.083 | —/— | |||||
| ∗AX J1717153718 | 10.254 | 259.312 | —/— | 32.5/4.9 | |||
| 0.366 | 37.312 | 41.4/6.2 | |||||
| AX J1718043726 | 10.270 | 259.519 | 38.9/22.4 | 189.3/52.7 | 13.32 | G349.70.2 | |
| 0.153 | 37.448 | 150.1/47.6 | 4.13 | ||||
| AX J1719103652 | 9.681 | 259.793 | 7.2/3.9 | 10.4/4.7 | 1RXSJ171913.1365144 | ||
| 0.301 | 36.881 | —/— | |||||
| AX J1719223703 | 9.795 | 259.846 | —/— | 4.0/3.8 | 0.98 | ||
| 0.170 | 37.050 | 5.4/5.3 | 2.49 | ||||
| AX J1720503710 | 9.730 | 260.212 | 4.0/4.4 | 5.8/4.3 | |||
| 0.141 | 37.174 | —/— | |||||
| AX J1721053726 | 9.926 | 260.274 | 306.4/13.5 | 366.8/16.7 | 1RXSJ172106.9372639 | ||
| 0.338 | 37.448 | 161.6/10.5 | |||||
| AX J1725503533 | 7.831 | 261.461 | —/— | 5.5/6.0 | 0.65 | ||
| 0.059 | 35.561 | 4.6/5.7 | 2.21 | ||||
| AX J1726233516 | 7.536 | 261.597 | 4.0/4.9 | —/— | SIM: HD319810 – Star(G0) | ||
| 0.006 | 35.280 | —/— | |||||
| AX J1726423504 | 7.324 | 261.676 | —/— | 5.2/4.1 | |||
| 0.072 | 35.067 | 4.9/4.3 | |||||
| AX J1726423540 | 7.831 | 261.678 | 22.7/12.3 | 35.8/14.1 | 1.69 | 1RXSJ172641.7354030 | |
| 0.272 | 35.680 | 14.3/7.9 | 0.88 | ||||
| AX J1727433506 | 7.242 | 261.931 | 18.0/10.8 | 34.8/13.7 | 0.80 | G352.70.1 | |
| 0.125 | 35.109 | 16.7/8.8 | 2.39 | ||||
| AX J1734413234 | 4.328 | 263.675 | 49.0/20.1 | 58.6/20.3 | 0.60 | 1RXSJ173442.6323449, 2E1731.43232 | |
| 0.055 | 32.574 | 10.6/7.0 | 1.00 | SIM: NGC 6383 – Cluster of Stars | |||
| AX J1735183237 | 4.295 | 263.826 | —/— | 11.3/6.4 | 0.57 | G355.60.0 | |
| 0.076 | 32.617 | 3.9/2.9 | 0.34 | ||||
| AX J1735483207 | 3.820 | 263.950 | 4.0/5.4 | 12.2/9.4 | 0.69 | ||
| 0.104 | 32.120 | 8.5/7.7 | 0.63 | ||||
| AX J1736283141 | 3.378 | 264.117 | —/— | 10.3/4.7 | 1.64 | ||
| 0.219 | 31.686 | 10.8/5.2 | 0.35 | ||||
| ASCA namea | Positionb[∘] | Flux/Significancec | PL parametersd | Identificatione | |||
|---|---|---|---|---|---|---|---|
| 0.7–2 keV | 0.7–7 keV | Flux | |||||
| 2–10 keV | |||||||
| AX J1753312538 | 3.726 | 268.381 | 7.0/2.9 | 12.6/4.7 | |||
| 0.186 | 25.644 | —/— | |||||
| AX J1754042553 | 3.579 | 268.518 | —/— | 5.6/4.6 | |||
| 0.043 | 25.887 | 3.9/3.8 | |||||
| AX J1802252300 | 7.017 | 270.608 | 8.2/5.0 | 13.2/5.8 | 0.44 | ||
| 0.256 | 23.016 | 4.2/2.8 | 0.81 | ||||
| AX J1808001956 | 10.340 | 272.004 | 4.3/4.0 | —/— | |||
| 0.121 | 19.934 | —/— | |||||
| AX J1808162021 | 9.996 | 272.070 | —/— | 7.1/5.8 | 0.81 | ||
| 0.141 | 20.362 | 7.8/6.8 | 2.38 | ||||
| AX J1808382024 | 9.996 | 272.161 | —/— | 37.6/14.8 | 6.90 | G10.00.3 | |
| 0.239 | 20.410 | 39.6/16.2 | 1.02 | ||||
| AX J1808572004 | 10.323 | 272.239 | —/— | —/— | 0.00 | ||
| 0.141 | 20.076 | 7.1/5.3 | 0.67 | ||||
| AX J1809021948 | 10.569 | 272.259 | —/— | 4.3/4.8 | 0.56 | ||
| 0.027 | 19.805 | 5.0/6.0 | 1.13 | ||||
| AX J1809481918 | 11.093 | 272.452 | 6.9/7.2 | 17.0/11.2 | 1.05 | SIM: HD166077 – Star(A2/A3II/III) | |
| 0.055 | 19.308 | 11.4/9.3 | 0.47 | ||||
| AX J1809511943 | 10.733 | 272.465 | 18.2/12.2 | 20.6/11.2 | 0.10 | 1RXSJ180951.5194345 | |
| 0.158 | 19.726 | —/— | 0.80 | ||||
| AX J1810331917 | 11.191 | 272.639 | 12.3/10.4 | 20.9/12.9 | 0.99 | ||
| 0.092 | 19.293 | 8.3/6.8 | 0.62 | ||||
| AX J1811161828 | 11.993 | 272.820 | —/— | —/— | |||
| 0.153 | 18.471 | 6.3/4.7 | |||||
| AX J1811201913 | 11.338 | 272.836 | —/— | —/— | SIM: HD166441 – Star(G8/K0) | ||
| 0.223 | 19.227 | 7.5/4.5 | |||||
| AX J1812111835 | 11.993 | 273.048 | —/— | 6.7/5.4 | 0.89 | G12.00.1 | |
| 0.092 | 18.590 | 4.5/4.1 | 1.22 | ||||
| AX J1812131842 | 11.895 | 273.058 | —/— | 8.4/4.7 | |||
| 0.158 | 18.707 | 5.4/4.2 | |||||
| AX J1817051607 | 14.710 | 274.272 | —/— | —/— | |||
| 0.055 | 16.132 | 6.6/4.0 | |||||
| AX J1818481527 | 15.496 | 274.704 | 4.0/5.3 | 3.7/3.9 | 0.01 | ||
| 0.006 | 15.463 | —/— | 1.14 | ||||
| AX J1818521559 | 15.038 | 274.719 | —/— | 16.8/8.2 | 2.20 | ||
| 0.256 | 15.991 | 15.7/8.9 | 1.51 | ||||
| AX J1819151601 | 15.054 | 274.817 | —/— | 19.5/4.3 | SIM: V* V1962 Sgr – Variable Star | ||
| 0.354 | 16.023 | 17.5/4.6 | |||||
| AX J1819171548 | 15.251 | 274.823 | 54.9/6.8 | 52.0/5.4 | |||
| 0.256 | 15.804 | 7.5/1.4 | |||||
| AX J1821041420 | 16.740 | 275.267 | —/— | 34.5/12.8 | 3.72 | G16.70.1 | |
| 0.055 | 14.343 | 33.4/13.6 | 0.88 | ||||
| AX J1822161425 | 16.806 | 275.567 | 20.7/8.1 | 24.0/7.3 | 0.25 | ||
| 0.239 | 14.424 | —/— | 1.81 | ||||
| AX J1824351311 | 18.165 | 276.149 | 7.6/4.5 | 15.4/6.0 | 0.54 | ||
| 0.158 | 13.186 | 6.3/3.3 | 0.60 | ||||
| AX J1824421253 | 18.443 | 276.178 | 2.0/3.3 | 4.0/4.4 | |||
| 0.043 | 12.886 | —/— | |||||
| AX J1825091253 | 18.492 | 276.291 | —/— | 4.5/4.3 | |||
| 0.141 | 12.889 | —/— | |||||
| ASCA namea | Positionb[∘] | Flux/Significancec | PL parametersd | Identificatione | |||
|---|---|---|---|---|---|---|---|
| 0.7–2 keV | 0.7–7 keV | Flux | |||||
| 2–10 keV | |||||||
| AX J1825301144 | 19.540 | 276.377 | —/— | 6.5/2.9 | |||
| 0.317 | 11.748 | 8.1/4.0 | |||||
| AX J1825381214 | 19.114 | 276.411 | 4.0/4.8 | 7.0/5.8 | 0.14 | ||
| 0.055 | 12.247 | 2.6/2.9 | 2.20 | ||||
| AX J1826511206 | 19.376 | 276.713 | 5.2/4.4 | 6.5/3.6 | |||
| 0.141 | 12.107 | —/— | |||||
| AX J1828461116 | 20.325 | 277.194 | 6.9/4.8 | 8.9/4.5 | |||
| 0.174 | 11.281 | —/— | |||||
| AX J1830391002 | 21.635 | 277.664 | —/— | 7.0/5.2 | 2.27 | ||
| 0.010 | 10.045 | 9.8/7.2 | 0.49 | ||||
| AX J1831140943 | 21.979 | 277.811 | 2.5/4.1 | 6.8/6.4 | 0.33 | ||
| 0.006 | 9.733 | 2.2/2.6 | 1.35 | ||||
| AX J1831161008 | 21.619 | 277.818 | —/— | 11.5/5.2 | 1.11 | ||
| 0.190 | 10.143 | 8.8/4.6 | 0.71 | ||||
| AX J1832060938 | 22.159 | 278.028 | 4.4/4.1 | 17.2/6.7 | 1.97 | ||
| 0.141 | 9.641 | 15.5/6.6 | 0.63 | ||||
| AX J1832060940 | 22.126 | 278.027 | —/— | 13.4/5.0 | |||
| 0.158 | 9.678 | 11.7/4.8 | |||||
| AX J1832210840 | 23.043 | 278.089 | 9.6/7.2 | 60.2/20.1 | 11.34 | ||
| 0.252 | 8.676 | 56.8/20.0 | 1.51 | ||||
| AX J1832310916 | 22.535 | 278.130 | —/— | 3.4/4.3 | |||
| 0.059 | 9.270 | 1.7/2.5 | |||||
| AX J1833450828 | 23.387 | 278.440 | —/— | 5.2/5.1 | 0.43 | SIM: PSR B1830-08 – Pulsars | |
| 0.039 | 8.469 | 4.8/5.2 | 1.90 | ||||
| AX J1833560822 | 23.485 | 278.486 | —/— | 5.6/5.8 | 0.48 | ||
| 0.039 | 8.382 | 5.3/6.1 | 0.81 | ||||
| AX J1834400801 | 23.878 | 278.669 | —/— | —/— | |||
| 0.039 | 8.033 | 2.7/4.2 | |||||
| AX J1835060806 | 23.861 | 278.778 | —/— | 4.0/4.0 | 2E1832.40812 | ||
| 0.092 | 8.108 | —/— | |||||
| AX J1835180754 | 24.058 | 278.826 | 3.7/6.3 | 49.1/29.7 | 5.41 | ||
| 0.043 | 7.911 | 48.4/30.5 | 1.23 | ||||
| AX J1835280737 | 24.336 | 278.867 | —/— | 26.9/18.5 | 4.30 | ||
| 0.055 | 7.619 | 30.6/21.0 | 1.74 | ||||
| AX J1836070756 | 24.123 | 279.032 | 7.6/4.9 | 9.9/4.7 | |||
| 0.239 | 7.943 | —/— | |||||
| AX J1836180647 | 25.171 | 279.078 | 6.6/4.1 | 13.1/5.2 | 0.82 | 2E1833.60649 | |
| 0.252 | 6.787 | 3.9/1.8 | 0.63 | ||||
| AX J1838000655 | 25.236 | 279.504 | 4.9/3.8 | 55.1/14.7 | 10.88 | 2E1835.30658 | |
| 0.190 | 6.932 | 59.2/15.5 | 1.73 | ||||
| AX J1839310544 | 26.464 | 279.880 | —/— | 4.8/3.9 | |||
| 0.022 | 5.743 | 4.4/4.8 | |||||
| AX J1839570546 | 26.480 | 279.990 | —/— | 6.0/4.6 | |||
| 0.092 | 5.781 | —/— | |||||
| AX J1840040552 | 26.415 | 280.019 | 3.4/3.2 | 6.6/4.1 | |||
| 0.158 | 5.870 | —/— | |||||
| AX J1840080543 | 26.546 | 280.035 | —/— | 6.5/5.1 | 1.00 | SIM: GSC 05125-01818 – Star(B5) | |
| 0.108 | 5.731 | 5.3/5.2 | 1.28 | ||||
| AX J1840240544 | 26.562 | 280.101 | —/— | 12.2/7.0 | 1.65 | ||
| 0.174 | 5.746 | 9.9/6.6 | 1.37 | ||||
| ASCA namea | Positionb[∘] | Flux/Significancec | PL parametersd | Identificatione | |||
|---|---|---|---|---|---|---|---|
| 0.7–2 keV | 0.7–7 keV | Flux | |||||
| 2–10 keV | |||||||
| AX J1841210455 | 27.397 | 280.339 | 496.0/96.9 | 924.5/118.5 | 28.61 | 1RXSJ184120.8045612 | |
| 0.010 | 4.929 | 437.6/81.5 | 15.69 | 2E1838.60459 G27.40.0 | |||
| AX J1843550351 | 28.641 | 280.982 | —/— | 6.9/4.6 | |||
| 0.092 | 3.860 | 40.5/3.6 | |||||
| AX J1844000355 | 28.592 | 281.004 | —/— | —/— | |||
| 0.141 | 3.926 | 5.2/4.2 | |||||
| AX J1844470305 | 29.427 | 281.196 | 1.7/2.5 | 7.5/5.9 | 0.98 | ||
| 0.072 | 3.086 | 7.2/6.2 | 1.22 | ||||
| AX J1846000231 | 30.066 | 281.502 | —/— | 4.0/4.5 | |||
| 0.055 | 2.526 | 3.6/4.6 | |||||
| AX J1846100239 | 29.967 | 281.545 | —/— | 3.6/4.1 | |||
| 0.043 | 2.658 | 4.1/4.6 | |||||
| AX J1846290258 | 29.722 | 281.622 | 67.3/11.5 | 308.3/26.0 | 27.23 | 1RXSJ184624.7025854 | |
| 0.256 | 2.973 | 254.8/23.8 | 1.04 | 2E1843.80301 G29.70.3 | |||
| AX J1846520240 | 30.033 | 281.721 | 3.4/4.2 | 7.8/5.9 | 0.36 | 2E1844.10244 | |
| 0.207 | 2.674 | 4.1/3.9 | 0.64 | ||||
| AX J1847380156 | 30.770 | 281.911 | —/— | 15.2/9.3 | 2.03 | ||
| 0.043 | 1.944 | 14.3/9.6 | 0.96 | ||||
| AX J1847410219 | 30.442 | 281.922 | —/— | 6.9/4.6 | |||
| 0.223 | 2.317 | 6.5/4.8 | |||||
| AX J1848480129 | 31.310 | 282.202 | —/— | 25.0/10.8 | 1.62 | ||
| 0.092 | 1.486 | 21.3/10.1 | 1.31 | ||||
| AX J1849300055 | 31.883 | 282.375 | 104.9/35.4 | 146.8/40.1 | 2.34 | 1RXSJ184931.1005625 | |
| 0.006 | 0.931 | 42.6/20.2 | 2.08 | G31.90.0 | |||
| AX J1850150025 | 32.423 | 282.564 | —/— | 5.4/4.0 | 0.66 | ||
| 0.072 | 0.420 | 8.0/6.1 | 1.41 | ||||
| AX J1852400038 | 33.651 | 283.167 | 191.6/57.3 | 231.7/60.3 | 2.40 | 1RXSJ185238.8003949 | |
| 0.022 | 0.650 | 44.9/23.8 | 3.49 | 2E1850.00036 G33.60.1 | |||
| ∗AX J1855510129 | 34.764 | 283.966 | 1704.9/35.2 | 1955.1/25.9 | 1RXSJ185602.3011854 | ||
| 0.305 | 1.491 | 426.0/6.2 | 2E1853.00114(7,9) | ||||
| AX J1856080218 | 35.517 | 284.033 | 7.0/8.7 | 11.9/10.3 | 0.40 | 1RXSJ185609.2021744 | |
| 0.006 | 2.303 | 5.4/6.4 | 1.81 | SIM: GSC 00453-00136 – Star | |||
| AX J1856430220 | 35.615 | 284.180 | —/— | —/— | |||
| 0.108 | 2.338 | 4.7/4.2 | |||||
| AX J1856510245 | 36.008 | 284.214 | —/— | 2.5/3.8 | |||
| 0.055 | 2.763 | 2.6/4.3 | |||||
| AX J1857210247 | 36.090 | 284.339 | —/— | 3.0/4.2 | |||
| 0.043 | 2.791 | —/— | |||||
| AX J1857500240 | 36.041 | 284.462 | —/— | 6.1/5.5 | 0.99 | ||
| 0.207 | 2.672 | 5.1/5.1 | 1.13 | ||||
| AX J1859050333 | 36.974 | 284.772 | —/— | 10.5/8.8 | 1.51 | ||
| 0.076 | 3.562 | 10.8/9.3 | 0.72 | ||||
| AX J1900070427 | 37.890 | 285.032 | —/— | 3.7/4.0 | |||
| 0.104 | 4.460 | 2.9/3.3 | |||||
| AX J1901440459 | 38.545 | 285.435 | —/— | 3.8/5.5 | 0.32 | ||
| 0.010 | 4.989 | 3.6/6.0 | 2.28 | ||||
| AX J1905340659 | 40.755 | 286.395 | —/— | 5.1/5.2 | 0.43 | ||
| 0.055 | 6.984 | 3.4/4.2 | 1.13 | ||||
| AX J1907340709 | 41.132 | 286.892 | 355.2/37.3 | 505.8/43.7 | 11.39 | 1RXSJ190732.6070817 | |
| 0.305 | 7.152 | 191.0/21.6 | 8.16 | 2E1905.00704 G41.10.3 | |||
| ASCA namea | Positionb[∘] | Flux/Significancec | PL parametersd | Identificatione | |||
|---|---|---|---|---|---|---|---|
| 0.7–2 keV | 0.7–7 keV | Flux | |||||
| 2–10 keV | |||||||
| AX J1907490803 | 41.967 | 286.957 | —/— | 6.7/6.8 | 0.90 | ||
| 0.055 | 8.059 | 7.4/7.7 | 0.89 | ||||
| AX J1908140832 | 42.441 | 287.060 | 3.1/3.6 | 6.8/5.3 | 0.15 | ||
| 0.186 | 8.541 | 3.1/3.1 | 0.65 | ||||
| AX J1908180745 | 41.754 | 287.078 | 6.3/4.5 | 12.9/5.4 | 1.61 | ||
| 0.190 | 7.757 | 7.5/3.9 | 0.79 | ||||
| AX J1910460917 | 43.391 | 287.695 | —/— | 14.6/11.5 | 2.43 | 2E1908.30911 | |
| 0.027 | 9.285 | 14.9/12.2 | 0.72 | ||||
| AX J1911050906 | 43.276 | 287.773 | 178.9/38.4 | 756.0/75.3 | 51.00 | 1RXSJ191107.4090623 | |
| 0.174 | 9.115 | 604.0/66.3 | 15.64 | 2E1908.70901 G43.30.2 | |||
| AX J1941522251 | 58.877 | 295.471 | —/— | 9.2/4.3 | |||
| 0.108 | 22.862 | 7.3/3.9 | |||||
| AX J1943102318 | 59.417 | 295.793 | 9.4/5.7 | 17.6/7.5 | 0.42 | SIM: NGC 6823 – Star in Cluster | |
| 0.141 | 23.314 | 8.8/4.9 | 0.71 | ||||
| AX J1943322323 | 59.532 | 295.886 | 4.7/4.6 | 6.3/4.5 | SIM: NGC 6823 – Star in Cluster | ||
| 0.174 | 23.398 | —/— | |||||
| AX J1946222436 | 60.907 | 296.593 | 7.7/6.8 | 15.5/9.2 | 0.58 | SIM: BWE 1944+2427 – Star | |
| 0.125 | 24.613 | 7.5/6.2 | 1.65 | ||||
| AX J1946492512 | 61.480 | 296.708 | 4.7/7.7 | 12.0/12.4 | 0.57 | SIM: EM* VES 52 – Emission-line Star | |
| 0.088 | 25.215 | 7.4/9.6 | 1.43 | ||||
| AX J1949392631 | 62.937 | 297.416 | —/— | 12.4/5.4 | 0.97 | ||
| 0.203 | 26.530 | 11.2/5.2 | 1.51 | ||||
| AX J1949512534 | 62.134 | 297.465 | 5.7/3.6 | 106.3/20.9 | |||
| 0.321 | 25.573 | 107.5/21.6 | |||||
| AX J1950062628 | 62.937 | 297.527 | 3.0/3.0 | 7.2/4.5 | |||
| 0.088 | 26.472 | 5.2/4.0 | |||||
| Significance | Energy band | |||
|---|---|---|---|---|
| 0.7–2 keV | 2–10 keV | 0.7–7 keV | Total | |
| 49(9)∗ | 95(12)∗ | 115(14)∗ | 132(20)∗ | |
| 88(24)∗ | 115(15)∗ | 137(30)∗ | 207(44)∗ | |
| Catalog | AGS | IPCa | RASSb | SNRc | SIM-Stard |
|---|---|---|---|---|---|
| Identified | 56 | 19 | 22 | 16 | 22 |
| UnID. | 107∗ | 7 | 3 | 16 | — |
| Total | 163 | 26 | 25 | 32 | — |
. ASCA name Fluxa Vb Identification and References AX J1538185541 21.9 Unidentified AX J1631594752 48.5 Unidentified AX J1639044642 19.2 Unidentified AX J1718043726 13.3 SNR:G349.70.2 Yamauchi et al. (1998) AX J1832210840 11.3 1549-s pulsation Sugizaki et al. (2000) AX J1838000655 10.9 2E1835.30658 AX J1841210455 28.6 SNR:G27.40.0, Kes73, 1E1841-045Vasist & Gotthelf (1997) AX J1846290258 27.2 SNR:G29.70.3, Kes75 Blanton & Helfand (1996) AX J1907340709 11.4 SNR:G41.10.3, 3C397 Chen et al. (1999) AX J1911050906 51.0 SNR:G43.30.2, W49B Fujimoto et al. (1995); Hwang et al. (2000) aafootnotetext: Best-fit values of power-law model, extracted from Table 2 (photon index , absorption column density [1022 cm-2], and flux [10-12 ergs cm-2 s-1] in the 0.7–10 keV band). bbfootnotetext: Flux variability with a confidence above 99%.
| Group ID | Condition | Number | |||
| [cm-2] | Total | SNR | SIM-Star | ||
| (a) | any | 11 | 0 | 1 | |
| (b-i) | 23 | 0 | 6 | ||
| (b-ii) | 10 | 0 | 1 | ||
| (b-iii) | 17 | 3 | 0 | ||
| (c-i) | 11 | 3 | 3 | ||
| (c-ii) | 21 | 3 | 0 | ||
| Group ID | Fitting Modela | Best-fit Parametersb | |||||||
| or | |||||||||
| (a) | Abs1PL | — | 2.8 | — | — | — | 1.83/36 | ||
| Abs1RS1 | 1.0:fixed | 2.2 | — | — | — | 3.48/36 | |||
| Abs1RS1Abs2RS2 | 1.0:fixed | 1.9 | 0.6 | 1.28/34 | |||||
| (b-i) | Abs1PL | — | 1.1 | — | — | — | 1.62/36 | ||
| Abs1RS1 | 1.0:fixed | 1.1 | — | — | — | 2.24/36 | |||
| Abs1RS | 1.1 | — | — | — | 1.89/35 | ||||
| Abs1(RSRS) | 0.9 | — | 0.23 | 1.21/33 | |||||
| (b-ii) | Abs1PL | — | 1.0 | — | — | — | 1.86/36 | ||
| Abs1RS1 | 1.0:fixed | 0.96 | — | — | — | 1.65/36 | |||
| Abs1(RS1RS2) | 1.0:fixed | 0.90 | — | 0.08 | 1.47/34 | ||||
| (b-iii) | Abs1PL | — | 2.1 | — | — | — | 1.47/36 | ||
| (c-i) | Abs1PL | — | 1.7 | — | — | — | 4.12/36 | ||
| Abs1RS1 | 1.0:fixed | 1.6 | — | — | — | 1.74/36 | |||
| Abs1(RS1RS2) | 1.0:fixed | 1.4 | — | 0.3 | 1.34/34 | ||||
| (c-ii) | Abs1PL | — | 1.3 | — | — | — | 2.08/36 | ||
| Abs1RS1 | 1.0:fixed | 1.3 | — | — | — | 2.40/36 | |||
| Abs1(RS1RS2) | 1.0:fixed | 1.0 | — | 0.3 | 1.52/34 | ||||
| Abs1(RSRS) | 1.0 | — | 0.4 | 1.35/33 | |||||
| Source | Grouping | Properties of | Number density | Identifications |
| Group | criteria | X-ray spectrum | & Luminosity | |
| , | [pc-3] | Number of cataloged sources | ||
| [1022cm-2] | [ergs s-1] | & Candidates | ||
| (a) | Power-law | SNRs:0/11, Stars:1/11 | ||
| HMXB pulsars | ||||
| (b-i) | , | Power-law | SNRs:0/23, Stars:6/23 | |
| Quiescent LMXBs, Crab-like pulsars | ||||
| (b-ii) | , | Thin-tharmal plasma | SNRs:0/10, Stars:1/10 | |
| Two-temp. (7 keV, 0.3 keV) | CVs | |||
| (b-iii) | , | Power-law | — | SNRs:3/17, Stars:0/17 |
| — | Extragalactic sources (AGNs):12/17 | |||
| (c-i) | , | Thin-thermal plasma | SNRs:3/11, Stars:3/11 | |
| 0.6 keV plus hard tail | Active coronae, OB stars, Quiescent LMXBs | |||
| (c-ii) | , | Thin-thermal plasma | SNRs:3/21, Stars:0/21 | |
| Two-temp. (2 keV, 0.4 keV) | CVs, Active coronae |