Nuclear Reaction Rate Uncertainties and their effects on Nova Nucleosynthesis Modeling
Abstract
The nucleosynthesis and other observable consequences of a nova outburst depend sensitively on the details of the thermonuclear runaway which initiates the outburst. One important source of uncertainty in our current models is the nuclear reaction data used as input for the evolutionary calculations. We present preliminary results of the first analyses of the impact on nova nucleosynthesis of all reaction rate uncertainties considered simultaneously.
1 Nuclear Uncertainties in Novae
Observations of nova outbursts have revealed an elemental composition that differs markedly from solar. Theoretical studies indicate that these differences are caused by the combination of convection with explosive hydrogen burning which results in a unique nucleosynthesis that is rich in odd-numbered nuclei such as , , and . Such nuclei are difficult to form in other astrophysical hosts. Many of the proton-rich nuclei produced in nova outbursts are radioactive, offering the possibility of direct observation with -ray instruments. Potentially important -ray sources include , , , and .
The observable consequences of a nova outburst depend sensitively on the details of the thermonuclear runaway which initiates the outburst. One important source of uncertainty is the nuclear reaction data used as input for the evolutionary calculations (Starrfield et al., 1998). A number of features conspire to magnify the effects of nuclear uncertainties on nova nucleosynthesis. First, the similarity of the nuclear burning and convective timescales in novae results in nuclear burning which is far from the steady state which typifies quiescent burning. Further, many reactions of relevance to novae involve unstable proton-rich nuclei, making experimental rate determinations difficult. Finally, for hydrodynamic conditions typical of novae, many rates depend critically on the properties of a few individual resonances, resulting in wide variation between different rate determinations. As a result, statistical model (Hauser-Feshbach) calculations, which are employed with great success in other venues for a large number of reactions (Rauscher et al., 1997), are unreliable for many rates under nova conditions. As we will demonstrate, these factors greatly restrict our ability to make precise predictions of the nucleosynthesis of novae.
2 Monte Carlo Estimates of Uncertainties
Though analysis of the impact of variations in the rates of a few individual reactions has recently been performed using one-dimensional hydrodynamic models (José et al., 1999), analysis of the impact of the complete set of possible reaction rate variations in such hydrodynamic models remains computationally prohibitive. We therefore begin by examining in detail the nucleosynthesis of individual zones, using hydrodynamic trajectories (temperature and density as a function of time) drawn from nova outburst models. Such post-processing nucleosynthesis simulations have been a common means of estimating nova nucleosynthesis (see e.g., Hillebrandt & Thielemann, 1982; Wiescher et al., 1986). For this presentation we are using a hydrodynamic trajectory for an inner zone of a ONeMg WD, similar to that described by Politano et al. (1995). These calculations were performed using a nuclear network with 87 species, composed of elements from n and H to S, including all isotopes between the proton drip line and the most massive stable isotope.
To investigate the extent to which nuclear reaction uncertainties translate into abundance differences, we use a Monte Carlo technique which simultaneously assigns a random enhancement factor to each reaction rate in the nuclear network. Monte Carlo methods have been employed with success in the analysis of Big Bang nucleosynthesis (Smith et al., 1993), but this is their first application to other thermonuclear burning environments. This is also the first analysis of nova nucleosythesis to examine the impact of all the reaction uncertainties simultaneously. The reaction rate enhancement factors are distributed according to the log-normal distribution, which is the correct uncertainty distribution for quantities like reaction rates which are manifestly positive (Smith, 1991). The probability density function is given by
| (1) |
where and are the (logarithmic) mean and standard deviation. Unlike the normal (Gaussian) distribution, where confidence intervals are symmetric in the additive sense, the confidence intervals for the log-normal distribution are symmetric in a multiplicative sense. For small uncertainties , the difference between the log-normal distribution and the normal distribution is small. However, for uncertainties of larger sizes, such as those encountered in this problem, the difference is important. For example, assuming a normal distribution with a relative uncertainty of 50% implies that there is a 5% chance of a negative reaction rate.
The choice of uncertainty for each reaction rate is crucial for this analysis. For -decays, we have used the experimental uncertainties (Tuli, 2000). For many of the other rates important for nova nucleosynthesis, the uncertainties in the reaction rate are unknown or are likely to be dominated by systematic effects such as missing resonances. We have therefore assigned uncertainties by category. Rates calculated by Hauser-Feshbach methods as well as rates whose measurement require radioactive ion beams were assigned uncertainties of . For rates measured with stable beams, we have assigned . Note that relatively few reactions, especially among unstable nuclei, have measurement uncertainties this small. We have chosen these small uncertainties to obtain a conservative estimate of the impact of nuclear uncertainties on nucleosynthesis predictions.
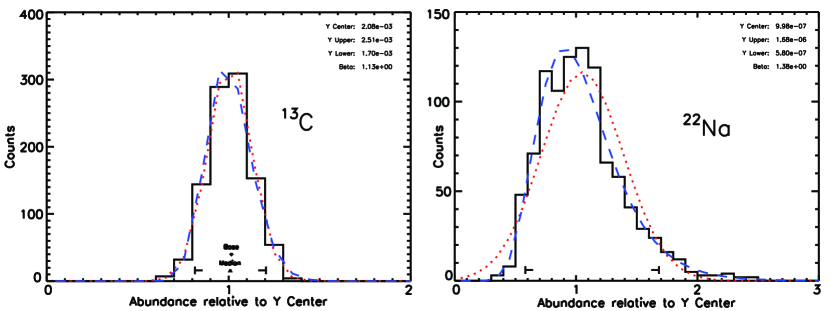
The histograms drawn in Figure 1 show the abundance distributions which result from the Monte Carlo analysis (992 trials) for two representative nuclei, and . From distributions such as these, mean values and 90% confidence limits are extracted. The normal and log-normal distributions with widths drawn from these Monte Carlo abundance distributions are also plotted in Fig. 1. Note the similarity between the normal and log-normal distributions for , which has a standard deviation of 12%, while these distributions differ markedly for , which has a standard deviation of 32%.
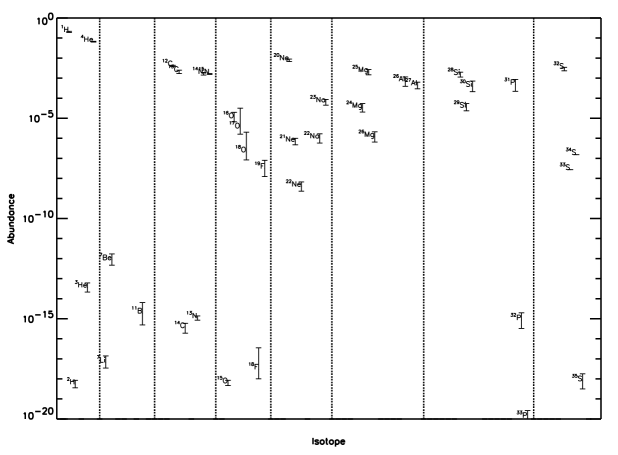
Figure 2 shows the mass fractions of each species at the end of the simulation, after peak temperature. Because of the long time which has elapsed, the unstable proton-rich nuclei have decayed, reducing their abundances to less than . The error bars displayed in Fig. 2 are the 90% confidence intervals which result from the Monte Carlo analysis. As evidenced by the error bars in Fig. 2, the impact of even our conservatively chosen variations in reaction rates on the nucleosynthesis is large. While broader conclusions will require similar analysis of an entire model, a number of interesting points can be drawn from the analysis of this single hydrodynamic trajectory. First, for reaction rate variations of the size considered here, the impact on the rate of energy production is small. At the 90% confidence level, variations in the amount of hydrogen consumed and helium produced represent variation in the thermonuclear energy released. This is essential if post-processing techniques are to prove useful. Second, for the most abundant CNO isotopes, such as and , 2 variations of 5-20% are common, though some less abundant CNO isotopes show larger variations. For example, the 90% confidence interval for the mass fraction of has a lower limit of and an upper limit of , a span of a factor of 20. Third, for many of the nuclei in the NeNa and MgAl cycles, including the -ray source nuclei and , the 90% confidence interval spans variations of a factor of 3. This represents nearly a factor of 2 difference in the distance from which novae may be observable with -ray telescopes.
3 Determining the impact of individual reactions on the nucleosynthesis of individual isotopes
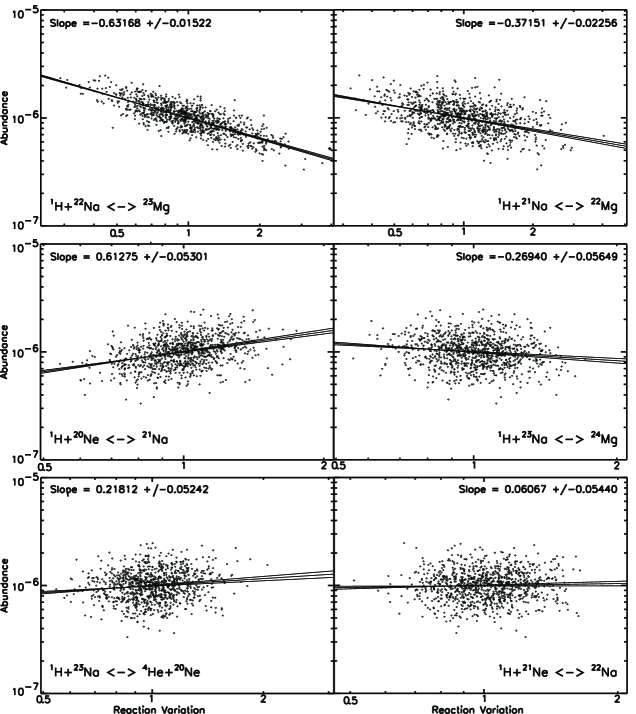
While the use of the Monte Carlo described in the previous section allows us to estimate the uncertainty in our nucleosynthetic calculations caused by nuclear reaction uncertainties, it does not indicate which reactions influence the production of an individual isotope. In order to determine this connection, we re-examine our Monte Carlo trials to find correlations between the abundance variations and the variations in all of the included reactions. Given the wide range of variations, we test for correlations in the logarithm of the abundance change with respect to the logarithm of the reaction variations. Figure 3 displays some representative correlations between reactions rates and the abundance of . Since we simultaneously vary all the included reactions rates, the resultant plots show some scatter, however statistically significant correlations are still achieved for a number of reactions. Fig. 3a, Fig. 3b, and Fig. 3d show that increases in , , and resulted in reduced abundances of , while Fig. 3c and Fig. 3e show that increases in the reaction rate of and increased the abundance of . Interestingly, Fig. 3f demonstrates that, for reaction rate variations of the size considered here, the abundance of is essentially independent of the rate of , even though this reaction in the primary production channel for . Much larger variations in the reaction rate of would necessitate reexamination of this conclusion.
José et al. (1999) have recently performed a set of spherically symmetric nova outburst simulations in which they vary individual reaction rates in order to examine the impact of these rates on the production of and . They found that variations in the rates of and produced significant variations in the abundance, with having a smaller effect. Our results confirm these conclusions, however we find that the reaction has effects similar in strength to the former two and that has an effect similar in strength to the latter. Examination of these rates within hydrodynamic simulations of novae would present an excellent test of the predictive power of the Monte Carlo analysis.
4 Conclusions
We have performed analysis of the effects of reaction rate uncertainties on nova nucleosynthesis. Our Monte Carlo analysis is the first such analysis that simultaneously examines the impact of all of the uncertainties. The large uncertainties in nova nucleosynthesis that we find constrain our ability to make detailed comparisons between theoretical models for the nova outburst and astrophysical observations to a degree which is often ignored. Further, knowledge gleaned from this analysis of which reaction rate uncertainty dominates the uncertainty in a given isotope helps prioritize new experimental measurements. Only with improved knowledge of these uncertain rates, both experimental and theoretical, can we provide tight constraints on the nova outburst from its nucleosynthetic products.
References
- Hillebrandt & Thielemann (1982) Hillebrandt, W. & Thielemann, F.-K. 1982, ApJ, 255, 617
- José et al. (1999) José, J., Coc, A., & Hernanz, M. 1999, ApJ, 520, 347
- Politano et al. (1995) Politano, M., Starrfield, S., Truran, J. W., Weiss, A., & Sparks, W. M. 1995, ApJ, 448, 807
- Rauscher et al. (1997) Rauscher, T., Thielemann, F.-K., & Kratz, K.-L. 1997, Nucl. Phys. A, 621, 331
- Smith (1991) Smith, D. L. 1991, Probability, Statistics, and Data Uncertainties in Nuclear Science and Technology (LaGrange Park: Am. Nuc. Soc.)
- Smith et al. (1993) Smith, M. S., Kawano, L. H., & Malaney, R. A. 1993, ApJS, 85, 219
- Starrfield et al. (1998) Starrfield, S., Truran, J. W., Wiescher, M. C., & Sparks, W. M. 1998, MNRAS, 296, 502
- Tuli (2000) Tuli, J. K. 2000, Nuclear Wallet Cards
- Wiescher et al. (1986) Wiescher, M., Gorres, J., Thielemann, F.-K., & Ritter, H. 1986, A&A, 160, 56