BeppoSAX spectroscopy of the luminous X-ray sources in M33
Abstract
The nearby galaxy M33 was observed by the imaging X-ray instruments on-board BeppoSAX. Two observations at different phases of the 105.9 day intensity cycle of the luminous central source X-8 failed to reveal the expected modulation, suggesting that it is probably transitory. Similar behavior has been observed from several X-ray binary sources. This strengthens somewhat the idea that M33 X-8 is a black hole accreting from a binary companion. The 0.2–10 keV spectrum of M33 X-8 can best be modeled by an absorbed power-law with a photon index, , of and a disk-blackbody with a temperature, kT, of keV and a projected inner-disk radius of km. This spectral shape is in good agreement with earlier ASCA results. The 2–10 keV spectra of M33 X-4, X-5, X-7, X-9 and X-10 are all consistent with power-law or bremsstrahlung models, whilst that of X-6 appears to be significantly more complex and may be reasonably well modeled with a disk-blackbody with kT = keV and a projected inner-disk radius of km. The spectrum of M33 X-9 is rather hard with . Compared to earlier and ROSAT observations, M33 X-7 and X-9 varied in intensity, M33 X-4, X-6, and X-10 may have varied and M33 X-5 remained constant.
Key Words.:
Galaxies: individual (M33) – Galaxies: nuclei – X-ray: galaxies1 Introduction
| Num. | Observation | Exposure | M33 X-8 count rate | ||||
|---|---|---|---|---|---|---|---|
| Start | End | LECS | MECS | LECS | MECS | ||
| (year mn dy hr:mn) | (mn dy hr:mn) | (ks) | (ks) | (0.1–2 keV; s-1) | (1.8–10 keV; s-1) | ||
| 1 | 1998 Aug 24 13:05 | Aug 25 22:26 | 32.3 | 59.9 | 0.72 | ||
| 2 | 1999 Jan 06 20:16 | Jan 07 18:38 | 0.9 | 1.1 | 0.98 | ||
| 3 | 2000 Jul 09 17:56 | Jul 13 04:33 | 7.3 | 37.4 | 0.20 | ||
M33 (NGC 598) is one of the nearest galaxies (795 kpc, van den Bergh vdb:91 (1991)) and is classified as a late-type Sc spiral. As well as containing several point X-ray sources, M33 is unique amongst the Local Group in having a very bright (1039 erg s-1) X-ray source (X-8) located at a position consistent (to within the positional error of the Einstein High Resolution Imager (HRI) of 3′′) with the optical nucleus of the galaxy (see Long et al. l:81 (1981); Markert & Rallis m:83 (1983); Gottwald et al. g:87 (1987); Trinchieri et al. t:88 (1988); Dubus et al. d:97 (1997)). This source dominates the X-ray flux from the galaxy, being responsible for 70% of the 0.15–4.5 keV emission. Another X-ray source in M33 (X-7) is an eclipsing X-ray binary pulsar (Peres et al. p:89 (1989); Schulman et al. s:93 (1993), s:94 (1994); Larson & Schulman ls:97 (1997)) with a 3.45 day orbital period and a 0.31 s pulse period (Dubus et al. d:99 (1999)). The X-ray sources in M33 have been studied by Einstein, EXOSAT, ROSAT, and ASCA, as well as by earlier non-imaging instruments. With an exposure of 50 ks ROSAT Position Sensitive Proportional Counter (PSPC) observations of M33 have detected 35 sources in the central 30′ which are brighter than 1036 erg s-1 (Long et al. l:96 (1996); see also Haberl & Pietsch hp:00 (2000)). From an examination of archival ROSAT data spanning over 6 years (a total of 387 ks of HRI time and 62 ks of PSPC time), Dubus et al. (p:97 (1997)) find that the X-ray intensity of M33 X-8 is almost certainly modulated with a period of days.
The nature of M33 X-8 is unclear. X-ray transients such as Aql X-1 and 4U-1630-47 show outbursts on timescales of hundreds of days, but are not periodic (e.g., Kuulkers et al. k:97 (1997)) while a number of persistent X-ray sources exhibit long term periodicities in their X-ray intensities. Extended observations using the All-Sky Monitor (ASM) on the Rossi X-ray Timing Explorer (R-XTE) have revealed changes in some long term periodicities (e.g., Paul et al. p:00 (2000)); Wojdowski et al. w:98 (1998); Kong et al. k:98 (1998)). The detection of a 106 day periodicity over 20 cycles implies a regularity and duty cycle incompatible with typical soft X-ray transients. M33 X-8 may instead be a moderate mass black hole. Until recently, the M33 nuclear source was frequently considered (as are many of the bright sources in normal galaxies that exceed the Eddington limit of 1038 erg s-1 for a 1M⊙ compact object) to be a “mini-” (or perhaps “micro-”) active galactic nucleus (AGN). However, the X-ray spectrum of X-8 appears to be much steeper than a classical AGN power-law and can be well fit by a multi-color disk blackbody model plus a harder power-law (Takano et al. t:94 (1994)). This spectral shape is characteristic of the galactic black hole candidates which is often ultra-soft at low-energies and ultra-hard at high-energies. The ultra-soft component may originate from an optically thick accretion disk, while the ultra-hard component may result from comptonization of soft photons by hot electrons (Sunyaev & Trümper s:79 (1979)). The accretion disk model is parameterized by only two quantities, the projected inner disk radius, , and the temperature at this inner radius, (Mitsuda et al. m:84 (1984); Makishima et al. m:86 (1986)). Using ASCA, Takano et al. (t:94 (1994)) obtain a value for of 50 km, typical of black hole candidates in their high state. At the distance of M33, this corresponds to a black hole mass of 10 M⊙.
2 Observations
Data from the coaligned Low-Energy Concentrator Spectrometer (LECS; 0.1–10 keV; Parmar et al. p:97 (1997)), Medium-Energy Concentrator Spectrometer (MECS; 1.8–10 keV; Boella et al. b:97 (1997)), and the Phoswich Detection System (PDS; 15–300 keV; Frontera et al. f:97 (1997)) on-board BeppoSAX are presented. The MECS consists of two identical grazing incidence telescopes with imaging gas scintillation proportional counters in their focal planes. The LECS uses an identical concentrator system as the MECS, but utilizes an ultra-thin entrance window and a driftless configuration to extend the low-energy response to 0.1 keV. The fields of view (FOV) of the LECS and MECS are circular with diameters of 37′ and 56′, respectively. The MECS has a 2′ thick circular window support structure which is centered 10′ from the FOV center. In addition, four 2′ thick radial spokes extend outwards from the circular support. The non-imaging PDS consists of four independent units arranged in pairs each having a separate collimator. Each collimator was alternatively rocked on- and 210′ off-source every 96 s during the observations.
M33 was observed 3 times by BeppoSAX (see Table 1). The observing times were chosen in order to study M33 X-8 near the maximum and minimum of the 105.9 day X-ray cycle. The maxima occur at MJD = 48750.3 + n 105.9, and the minima approximately 0.7 in phase later (Dubus et al. d:97 (1997)). The 1998 August observation was close to the 105.9 day minimum (), and the 1999 January observation close to the maximum (). However, this observation was curtailed due to technical problems and repeated in 2000 July at , still close to the expected maximum of the 105.9 day cycle. Good data were selected from intervals when the elevation angle above the Earth’s limb was and when the instrument configurations were nominal, using the SAXDAS 2.0.0 data analysis package.
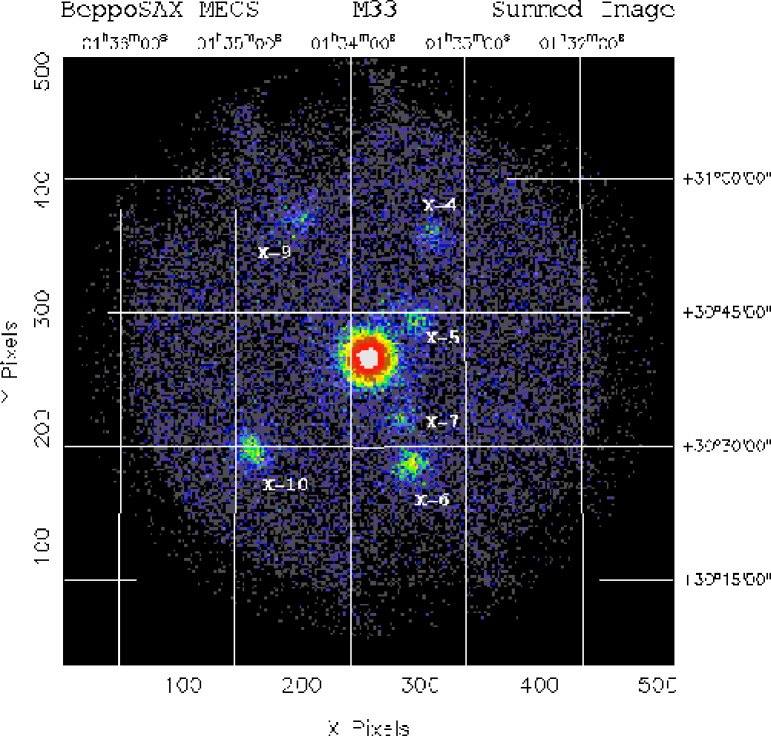
Fig. 1 shows the MECS 1.8–10 keV image obtained by summing data from all 3 observations. The total exposure is 98.3 ks. For clarity, the data have been rebinned by a factor 2 into 16′′ pixels. No corrections for vignetting or obscuration by the MECS window support structure (see above) have been applied. As well as the central M33 X-8 source which dominates the overall X-ray flux, M33 X-4, X-5, X-6, X-7, X-9 and X-10 are clearly detected. The luminous source M33 X-3 is strongly obscured by the MECS strongback and was not detected. In addition, the source identified here as M33 X-9 is resolved into 3 sources in ROSAT and Einstein observations (Long et al. l:96 (1996); Peres et al. p:89 (1989)).
| Source | R.A. (MECS) | Dec. (MECS) | R.A. (PSPC) | Dec. (PSPC) | Notes |
|---|---|---|---|---|---|
| (h m s) | (∘ ′ ′′) | (h m s) | (∘ ′ ′′) | ||
| X-4 | 01 33 17.5 | 30 54 02.0 | 01 33 14.8 | 30 53 28.5 | SNR 136+396 (L96); H ii IC133 (L81) |
| X-5 | 01 33 25.9 | 30 44 33.8 | 01 33 24.3 | 30 44 04.7 | … |
| X-6 | 01 33 27.7 | 30 28 12.5 | 01 33 27.5 | 30 27 22.7 | Globular cluster? (L81; CS82a) |
| X-7 | 01 33 31.8 | 30 33 36.4 | 01 33 33.8 | 30 32 12.8 | X-ray eclipsing binary; H ii B208 (B74; L81) |
| X-9 | 01 34 26.0 | 30 55 59.7 | 01 34 36.3 | 30 55 00.4 | position (L81) |
| X-9(a) | … | … | 01 34 38.7 | 30 55 10.3 | … |
| X-9(b) | … | … | 01 34 25.5 | 30 55 24.5 | Globular cluster? (n.3/4 in CS82b) |
| X-9(c) | … | … | 01 34 31.5 | 30 56 20.5 | Elliptical galaxy at z=0.03? (CS82a) |
| X-10 | 01 34 50.8 | 30 29 17.3 | 01 34 51.7 | 30 29 05.9 | … |
| Source | C | R | V | |
|---|---|---|---|---|
| (10-3 s | (′) | (′) | ||
| X-4 | 4 | 16 | 2.4 | |
| X-5 | 2 | 6 | 1.3 | |
| X-6 | 2 | 12 | 1.9 | |
| X-7 | 2 | 7 | 1.3 | |
| X-8 | 4 | 0 | 1.0 | |
| X-9 | 4 | 18 | 2.7 | |
| X-10 | 4 | 17 | 2.5 |
3 M33 X-8 analysis
LECS and MECS data were extracted centered on the position of M33 X-8 using radii of 6′ and 4′, respectively. This LECS extraction radius is smaller than normally used in order to minimize the contribution from nearby sources. The cosmic and internal instrument backgrounds are 5% of the source flux, and so background subtraction is not critical and was performed using source free regions of sky. Table 1 gives the 0.1–2.0 keV (LECS) and 2.0–10 keV (MECS) count rates for each observation.
The M33 X-8 spectra were investigated by simultaneously fitting data from the LECS and MECS instruments. All spectra were rebinned to oversample the full width half maximum of the energy resolution by a factor 3 and to have additionally a minimum of 20 counts per bin to allow use of the statistic. Data were selected in the energy ranges 0.2–8.0 keV (LECS) and 1.8–10 keV (MECS) where the instrument responses are well determined and sufficient counts obtained. The photoelectric absorption cross sections of Morrison & McCammon (mc:83 (1983)) are used throughout. Factors were included in the spectral fitting to allow for normalization uncertainties between the two instruments.
3.1 1998 August spectrum
| Model | NH | kT/kTin (keV) | (keV) | /dof | ||
|---|---|---|---|---|---|---|
| 1998 August observation | ||||||
| Power-law | 0.58 | … | 2.7 | … | … | 380.8/101 |
| Bremsstrahlung | … | … | … | 149.8/101 | ||
| Cutoff power-law | … | … | 118.1/100 | |||
| Power-law + blackbody | … | … | 106.0/99 | |||
| Power-law + disk-blackbody | … | 108.9/99 | ||||
| 2000 July observation | ||||||
| Power-law | … | … | … | 105.3/71 | ||
| Bremsstrahlung | … | … | … | 75.4/71 | ||
| Cutoff power-law | … | … | 75.2/70 | |||
| Power-law + blackbody | … | … | 76.9/69 | |||
| Power-law + disk-blackbody | … | 74.0/69 | ||||
| All observations | ||||||
| Power-law | 0.55 | … | 2.7 | … | … | 396.6/105 |
| Bremsstrahlung | … | … | … | 141.9/105 | ||
| Cutoff power-law | … | … | 125.4/104 | |||
| Power-law + blackbody | … | … | 122.2/103 | |||
| Power-law + disk-blackbody | … | 115.7/103 |
Initially, simple models were tried, including absorbed power-law, thermal bremsstrahlung and cutoff power-law () models. The power-law and bremsstrahlung models give unacceptable fits with of 380.8 and 149.8 for 101 degrees of freedom (dof), respectively. The cutoff power-law model fit is acceptable with a of 118.1 for 100 dof. Next, more complex models consisting of a power-law and a blackbody and a power-law and a disk-blackbody were fit. These both give acceptable fits with s of 106.0 and 108.9 for 99 dof, respectively. The best-fit inner disk radius is km for a distance of 795 kpc and a disk inclination of 0∘. The fit results are summarized in Table 4. The absorption corrected 1.0–10 keV source luminosity is erg s-1 for a distance of 795 kpc.
3.2 2000 July spectrum
The spectra were created in the same way as for the 1998 August observation and the same spectral models applied. The results are given in Table 4. The exposure times for this observation are shorter than for the 1988 August observation, and the spectrum can be successfully modeled using either bremsstrahlung, cutoff power-law, power-law and blackbody or power-law and disk-blackbody models. The derived spectral parameters are consistent with those from the earlier observation with an inner disk radius of km for the same assumptions as above. The absorption corrected 1.0–10 keV source luminosity is erg s-1 for a distance of 795 kpc.
3.3 Combined spectrum
Since the spectral fit parameters derived from the fits to the 1998 August and 2000 July data are consistent, these data were combined to produce a “summed” spectrum. Data from the short (MECS exposure of 1.1 ks) observation in 1999 January were also included. The same spectral models as above were fit and the results summarized in Table 4. As found by Takano et al. (t:94 (1994)), the best-fit model is the power-law and disk-blackbody combination with a of keV and an inner radius of km for a distance of 795 kpc and a disk inclination angle of 0∘. The mean, absorption corrected, 1.0–10 keV luminosity of M33 X-8 is erg s-1 for a distance of 795 kpc. The 90% confidence upper limit to a narrow emission line at 6.5 keV is 100 eV.
The galactic absorption in the direction of M33 X-8 is atom cm-2 (Dickey & Lockman d:90 (1990)). Using the power-law and disk-blackbody model, the best fit absorption of atom cm-2 suggests the presence of a small amount of additional absorption. The 3 upper-limit to any PDS counts in the 15–40 keV band is 0.06 s-1, consistent with the extrapolation of the best-fit power-law and disk-blackbody spectrum to this energy range which gives 0.02 count s-1. For a power-law spectrum with the upper-limit corresponds to a flux of 0.4 mCrab.


3.4 Time Variability


Fig. 3 shows 2–10 keV MECS lightcurves of M33 X-8 during 1998 August and 2000 July observations with a binning time of 1024 s. The LECS and MECS data from these observations were searched for the presence of periodic signals. None were found. During the 1998 August observation the 3 limit to any 2–10 keV (MECS) root mean square variability is 7.6% when evaluated on a timescale of 3000 s. In the energy band 0.1–2.0 keV (LECS) the upper limit evaluated in the same way is 5.3%. For the 2000 July observation the corresponding upper limits are 25% and 29%.
The mean ROSAT HRI count rate is 0.20 s-1 and the modulation appears sinusoidal-like with an amplitude of 20%. The folded 0.1–2.5 keV ROSAT lightcurve (see Fig. 4 and Fig. 3 of Dubus et al. d:97 (1997)) has a mean count rate of 0.20 s-1 with a sinusoidal-like modulation superposed with an amplitude of 20%. This implies that the count rates of the 1999 January and 2000 July observations should be 40% higher than that of 1998 August, should the 105.9 day modulation be present. However, the MECS 2.0–10.0 keV count rate at (close to the expected minimum of the cycle) is higher than at the expected maximum. In order to compare our BeppoSAX results for the two long observations with those of Dubus et al. (d:97 (1997)), we folded the best-fit BeppoSAX power-law and disk-blackbody models (see Table 4) through the HRI on-axis response matrix obtained from the HEASARC. This gives predicted HRI count rates of s-1 and s-1 for the 1998 August and 2000 July observations, respectively. These points are shown together with the HRI results of Dubus et al. (d:97 (1997)) on Fig. 4. The derived count rates do not support the continued presence of the 105.9 day modulation, although we cannot entirely exclude the possibility that the modulation is being masked by a higher than usual level of intrinsic variability.

4 Point sources
| Source | Model | kT | L | /dof | ||
| (keV) | (erg s-1) | |||||
| X-4 | Power-law | … | 13.7/12 | |||
| Power-law | 0.056 fixed | … | 15.0/13 | |||
| Bremsstrahlung | 4.9 | … | 13.2/12 | |||
| Bremsstrahlung | 0.056 fixed | … | 13.7/13 | |||
| X-5 | Power-law | 5.6 | … | 10.7/14 | ||
| Power-law | 0.056 fixed | … | 11.6/15 | |||
| Bremsstrahlung | 2.9 | … | 9.7/14 | |||
| Bremsstrahlung | 0.056 fixed | … | 9.7/13 | |||
| X-6 | Power-law | … | 51.7/28 | |||
| Power-law | 0.056 fixed | … | 56.9/29 | |||
| Bremsstrahlung | 0.69 | … | 44.2/28 | |||
| Bremsstrahlung | 0.056 fixed | … | 45.0/29 | |||
| Blackbody | 0.19 | … | 41.4/28 | |||
| Disk-blackbody | 0.29 | … | 37.2/28 | |||
| X-7 | Power-law | 9.8 | … | 6.2/9 | ||
| Power-law | 0.056 fixed | … | 7.3/10 | |||
| Bremsstrahlung | 11 | … | 6.1/9 | |||
| Bremsstrahlung | 0.056 fixed | 3.7 | … | 6.9/10 | ||
| X-9 | Power-law | 3.9 | … | 7.2/8 | ||
| Power-law | 0.056 fixed | … | 7.5/9 | |||
| Bremsstrahlung | 4.2 | 2.6 | … | 7.2/8 | ||
| Bremsstrahlung | 0.056 fixed | 5.3 | … | 7.2/9 | ||
| X-10 | Power-law | 3.3 | … | 31.2/18 | ||
| Power-law | 0.056 fixed | … | 31.9/19 | |||
| Bremsstrahlung | 2.0 | … | 31.1/18 | |||
| Bremsstrahlung | 0.056 fixed | … | 31.2/19 |
In order to investigate the properties of the other sources identified in Fig. 1 MECS data from all 3 observations were used. Except for M33 X-6 LECS data were not used since there were too few counts present. During the 1998 August observation M33 X-4 was partially obscured by a MECS strongback radial spoke (see Sect. 4.2) and these data were excluded from the analysis. For all the other sources no obscuration problems were present. Spectra were extracted centered on each source using the extraction radii listed in Table 3 and 2′ in the case of the LECS M33 X-6 data. These radii were chosen to minimize contamination from nearby sources and take into account the position of the MECS window support strongback. The spectra were rebinned in the same way as in Sect. 2 and data selected in the energy ranges where sufficient counts were obtained. Since these sources are all faint by BeppoSAX standards care was taken to reliably estimate the background. In order to properly take into account all the possible contaminating contributions, especially from the bright nuclear source M33 X-8, local backgrounds, each extracted from the same off-axis angle as the corresponding source, but at the geometrically opposite position in the FOV, were used. This is also necessary because the MECS instrument background has a component due to Mn K calibration source X-rays which are detected within the FOV. This effect is most noticeable close to the calibration sources and in particular for M33 X-9. A comparison of these local backgrounds with the average properties of background taken from high latitude pointings reveals that no strong evidence for diffuse emission is present in the MECS M33 data. A higher local background (20%) is present around M33 X-8, but this is consistent with being due to the X-ray mirror scattering wings.
Instrument response files appropriate to the off-axis positions of each source were used, except for M33 X-5 and X-7, which are close enough to the on-axis position to use the standard response files.


4.1 Spectral fit results
Absorbed power-law and bremsstrahlung models were first fit to each of the spectra and the results presented in Table LABEL:tab:pointspectra. Fits were repeated with the absorption constrained to be greater than, and equal to, the galactic value for each source. With the exception of M33 X-6 (and possibly M33 X-10) these models give reasonable fits to all the spectra and it is not possible to exclude either model. In the case of M33 X-6, the best-fit absorbed power-law and bremsstrahlung models give ’s of 51.7 and 44.2 for 28 dof, respectively. The best-fit to the M33 X-6 spectrum is instead obtained with an absorbed disk-blackbody model with keV and a normalization () of km. The 90% confidence upper limit to a narrow emission line at 6.5 keV from M33 X-6 is 540 eV. In the case of M33 X-10, a broad feature appears to be present at 4 keV. This can be modeled by the addition of a ( eV) Gaussian line to the best-fit power-law to give a of 18.6 for 15 dof. The line energy is keV and the equivalent width 440 eV.
Table LABEL:tab:pointspectra includes estimates of the source luminosities extrapolated (when necessary) to the 2–10 keV energy range. Photon spectra, deconvolved using the best-fit power-law models are shown in Fig. 5, except for M33 X-6 where the best-fit disk-blackbody model is used. With the exception of M33 X-9 and X-10, all the sources appear to be relatively soft in the 2–10 keV energy range.
4.2 Time variability


In order to investigate if any of the point sources exhibit excess variability, a Kolmogorov-Smirnov test as implemented in the FTOOLs package lcstat was performed on each of the lightcurves presented in Figs. 6 and 7. The sources M33 X-4, X-5, and X-10 show some evidence for excess variability on time scales 1024 s with probabilities for being constant of 4.8%, 4.4%, and 5.4% for M33 X-4, (obs. 1), X-5 (obs. 3), and X-10 (obs. 1), respectively. The other 3 sources do not show evidence for variability during either long observation with probabilities for being constant of 32% (X-6, obs. 1), 61% (X-7, obs. 1, 2048 s), and 19% (X-9, obs. 3). For comparison, data from source free regions of the image were also extracted and processed in the same way. No evidence for any excess variability was found.
A comparison between the 1998 August (Fig. 6), and 2000 July (Fig. 7) observations, does not show evidence for variability, except for M33 X-4, which showed a factor of 2 difference in count rate between the two observations. However, this change is almost certainly due to obscuration by one of the radial spokes of the MECS strongback during the 1998 August observation. The 2000 July observation was made at a different spacecraft roll angle, resulting in the source being well clear of the strongback. The BeppoSAX data are therefore consistent with the association of M33 X-4 with the supernova remnant SNR 136+396 discussed in Long et al. (l:96 (1996)).
Table 6 gives a comparison of the BeppoSAX source intensities with those derived from previous ROSAT PSPC (Long et al. l:96 (1996)) and IPC observations (Peres et al. p:89 (1989). For M33 X-4 only the data from the 2000 July observation is used. Unfortunately, due to the lack of good estimates of the absorbing column to most of the sources (see Table LABEL:tab:pointspectra), it is difficult to reliably extrapolate the BeppoSAX spectra to the PSPC (0.1–2.4 keV) and IPC (0.2–4.5 keV) energy ranges. Instead, we have adopted the spectral model assumed by Long et al. (l:96 (1996)) to convert ROSAT PSPC counts to fluxes. This consists of a power-law with and absorption of atom cm-2. We note that none of the spectral fits reported in Table LABEL:tab:pointspectra are in strong disagreement with such a model. We estimate that the uncertainty in the BeppoSAX fluxes is 40%, primarily due to uncertainties in instrumental calibration at large off-axis angles.
Examination of Table 6 shows that M33 X-4, X-6 ( only), X-7, X-9 and X-10 (ROSAT only) show 40% variability with respect to both the and ROSAT measurements. The source M33 X-7 shows the strongest evidence for variability being a factor 3 fainter during the BeppoSAX observations than previously observed. Since this source exhibits 0.33 day duration eclipses, we verified that the observations were not at the expected times of eclipse using the ephemeris of Larson & Schulman (ls:97 (1997)). Source X-9, not resolved in the MECS image, appears to be variable being a factor 2.5 brighter during the BeppoSAX observation than previously, if the ROSAT fluxes of the three separate sources are summed together (the X-9(c) flux is not reported in Long et al. l:96 (1996), although it is visible in their figure and appears to be as bright as the other two sources). Since the level of variability of M33 X-4, X-6, and X-10 is comparable with the (hard to quantify) systematic uncertainties, we regard the detection of variability for these sources as tentative.
Since M33 X-4 may be associated with a SNR, it is interesting to compare BeppoSAX fluxes with those obtained using and ROSAT using a bremsstrahlung model. If is again fixed at atom cm-2, we obtain kT=2.4 keV for the MECS spectrum and 0.1–2.4 keV and 0.2–4.5 keV luminosities of 1.1 ergs s-1 and 1.5 ergs s-1, respectively. These values should be compared with 9.5 ergs s-1 ( IPC, 0.2–4.5 keV) and 8.3 ergs s-1 (ROSAT, 0.1–2.4 keV), derived using this same spectral shape. Thus, there is no strong evidence for flux variability from M33 X-4.
| Source | L (0.1–2.4 keV) | L (0.2–4.5 keV) | ||
|---|---|---|---|---|
| BeppoSAX | ROSAT | BeppoSAX | ||
| X-4 | 18.9 | 11.1 | 18.6 | 12.4 |
| X-5 | 5.80 | 5.72 | 5.71 | 6.84 |
| X-6 | 14.0 | 18.2 | 8.57 | 16.4 |
| X-7 | 2.8 | 12.3 | 2.79 | 9.00 |
| X-9 | 8.6 | … | 8.57 | … |
| X-9(a) | … | 1.7 | … | 1.80 |
| X-9(b) | … | 1.9 | … | 0.67 |
| X-9(c) | … | … | 0.66 | |
| X-10 | 29.0 | 18.4 | 23.6 | 16.6 |
5 Discussion
The nearby galaxy M33 was observed by the imaging X-ray instruments on-board BeppoSAX. As well as the central M33 X-8 source which dominates the overall X-ray flux, M33 X-4, X-5, X-6, X-7, X-9 and X-10 were clearly detected. Observations close to the expected maximum and minimum of the 105.9 day intensity cycle of M33 X-8 failed to reveal the expected modulation, suggesting that it is probably transitory. No obvious spectral differences between the observations are present. The 0.2–10 keV spectrum of M33 X-8 can best be modeled by an absorbed power-law with and a disk-blackbody with kT keV and a projected inner-disk radius of km. This spectral shape is in good agreement with the ASCA results of Takano et al. (t:94 (1994)) and corresponds to a black hole mass of 10 M⊙.
The nature of M33 X-8 is intriguing. X-ray transients such as Aql X-1 and 4U 1630-47 show outbursts on timescales of hundreds of days, but are not periodic (e.g., Kuulkers et al. k:97 (1997)). A number of persistent X-ray sources exhibit long term periodicities in their X-ray intensities. Perhaps the best known of these are the pulsars Her X-1 (35 days, Giacconi et al. g:73 (1973)), LMC X-4 (30.5 days, Lang et al. l:81a (1981)) and SMC X-1 (60 days, Wojdowski et al. w:98 (1998)). In addition, the high-mass X-ray binary SS 433 thought to contain a black hole exhibits a 164 day photometric and spectroscopic modulation in the optical band (Margon et al. m:79 (1979)). Two other black hole candidates, Cyg X-1 (300 days, Priedhorsky et al. p:83 (1983) and LMC X-3, (198 or 99 days, Cowley et al. c:91 (1991)) also exhibit long term X-ray modulations. Thus, the presence of a 105.9 day X-ray intensity modulation from M33 X-8 is not particularly unusual if the source does indeed contain a 10 M⊙ black hole.
Recently, extended observations using the ASM on R-XTE have revealed that in at least four sources (Cyg X-3, LMC X-3, SMC X-1, and GX 354-0; Paul et al. p:00 (2000); Wojdowski et al. w:98 (1998); Kong et al. k:98 (1998)) the long term modulations have disappeared, or changed periods. Such unstable behavior is difficult to reconcile with the preferred model for the modulations in the high-mass sources which is obscuration by a precessing accretion disk (see e.g., Priedhorsky & Holt ph:87 (1987)). Since the detection of changes in the properties of these long term variations requires very long observing baselines, it is possible that such unstable behavior is relatively common in accreting systems. Thus, the probable cessation of the 105.9 day periodicity reported here strengthens somewhat the idea that M33 X-8 consists of a black hole accreting from a binary companion.
The 2–10 keV spectra of M33 X-4, X-5, X-7, X-9 and X-10 are all consistent with power-law or bremsstrahlung models, whilst that of X-6 appears to be significantly more complex, and may be reasonably well modeled with a disk-blackbody with kT = keV and a projected inner-disk radius of km. This normalization is in good agreement with the average of a number of low-mass X-ray binary systems known to contain neutron stars (7 km), but is smaller than the average (25 km) for black hole candidates (e.g., Tanaka & Lewin (tl:95 (1995)). This suggests that M33 X-6 may be a neutron star accreting from a low-mass companion. The spectrum of M33 X-9 is quite hard with , similar to the hard/low state in galactic black hole candidates. A comparison with earlier and ROSAT results implies that M 33 X-7 and X-9 are variable on long timescales, M33 X-4, X-6 and X-10 may be variable, whilst X-5 does not show evidence for any such variability. We cannot exclude the association of M33 X-4 with the supernova remnant SNR 136+396 discussed in Long et al. (l:96 (1996)). The lack of variability, moderate luminosity ( erg s-1), and simple (consistent with a power-law or bremsstrahlung) spectrum may indicate that M33 X-5 is a young X-ray bright supernova remnant. M33 X-6 clearly has an unusual spectrum and is worthy of further study with more sensitive instruments. It is unsurprising that M33 X-7 shows strong long term variability since it is known to be an (eclipsing) X-ray binary system (Peres et al. p:89 (1989)). Whilst M33 X-9 was a factor 2.5 brighter during the BeppoSAX observations than previously observed, it is unclear which (if any) of the 3 sources that apparently comprise X-9 had become significantly brighter.
Acknowledgements.
The BeppoSAX satellite is a joint Italian-Dutch programme. L. Sidoli acknowledges an ESA Research Fellowship. We thank the staff of the BeppoSAX Science Data Center for help with scheduling these observations and M. Corcoran for assistance with the ROSAT analysis. The referee, H.L. Marshall, is thanked for helpful comments.References
- (1) Boella G., Chiappetti L., Conti G., et al., 1997, A&AS 122, 327
- (2) Boulesteix J., Courtes G., Laval A., et al., 1974, A&A 37, 33
- (3) Christian C.A., Schommer R.A., 1982a, ApJ 253, L13
- (4) Christian C.A., Schommer R.A., 1982b, ApJS 49, 405
- (5) Cowley A.P., Schmidtke P.C., Ebisawa K., et al., 1991, ApJ 381, 526
- (6) Dickey J.M., Lockman F.J., 1990, ARA&A 28, 215
- (7) Dubus G., Charles P.A., Long K.S., Hakala P.J., 1997, ApJ 490, L47
- (8) Dubus G., Charles P.A., Long K.S., Hakala P.J., Kuulkers E., 1999, MNRAS, 302, 731
- (9) Frontera F., Costa E., Dal Fiume D., et al., 1997, A&AS 122, 371
- (10) Giacconi R., Gursky H., Kellogg E., et al., 1973, ApJ 184, 227
- (11) Gottwald M., Pietsch W., Hasinger G. 1987, A&A 175, 45
- (12) Haberl F., Pietsch W., 2000, in The Interstellar Medium in M31 and M33, eds. E.M. Berkhuijsen R. Beck and R.A.M. Walterbos (Aachen: Shaker Verlag)
- (13) Kong A.K.H., Charles P.A., Kuulkers E., 1998, New Astronomy 3, 301
- (14) Kuulkers E., Parmar A.N., Kitamoto S., Cominsky L.R., Sood R.K., 1997, MNRAS 291, 81
- (15) Lang F.L., Levine A.M., Bautz M., et al., 1981, ApJ 246, L21
- (16) Larson D.T., Schulman E., 1997, AJ 113, 618
- (17) Long K.S., D’Odorico S., Charles P.A., Dopita M.A., 1981, ApJ 246, L61
- (18) Long K.S., Charles P.A., Blair W.P., Gordon S.M., 1996, ApJ 466, 750
- (19) Makishima K., Maejima Y., Mitsuda K., et al., 1986, ApJ 285, 712
- (20) Markert T.H., Rallis A.D., 1983, ApJ 275, 571
- (21) Mitsuda K., Inoue H., Koyama K., et al., 1984, PASJ 36, 741
- (22) Margon B., Grandi S.A., Stone R.P.S., Ford H.C., 1979, ApJ 233, L63
- (23) Morrison D., McCammon D., 1983, ApJ 270, 119
- (24) Parmar A.N., Martin D.D.E., Bavdaz M., et al., 1997, A&AS 122, 309
- (25) Paul B., Kitamoto S., Makino F., 2000, ApJ 528, 410
- (26) Peres G., Reale F., Collura A., Fabbiano G., 1989, ApJ 336, 140
- (27) Priedhorsky W.C., Holt S.S., 1987, Space Sci. Rev. 45, 291
- (28) Priedhorsky W.C., Terrell J., Holt S.S., 1983, ApJ 270, 233
- (29) Schulman E., Bregman J.N., Collura A., Reale F., Peres G., 1993, ApJ 418, L67
- (30) Schulman E., Bregman J.N., Collura A., Reale F., Peres G., 1994, ApJ 426, L55
- (31) Sunyaev R.A., Trümper J., 1979, Nat 279, 506
- (32) Takano M., Mitsuda K., Fukazawa Y., Nagase F., 1994, ApJ 436, L47
- (33) Tanaka K., Lewin W.H.G., 1995, in X-ray Binaries, eds. W.H.G. Lewin J. van Paradijs and E.P.J. van den Heuvel (Cambridge: Cambridge Univ. Press), p. 121
- (34) Trinchieri G., Fabbiano G., Peres G., 1988, ApJ 325, 531
- (35) Van den Bergh S., 1991, PASP 105, 609
- (36) Wojdowski P., Clark G.W., Levine A., et al., 1998, ApJ 502, 253