Jet- and Wind-Driven Ionized Outflows in the Superbubble and Star-Forming Disk of NGC 3079111Based on observations made with the NASA/ESA Hubble Space Telescope, obtained at the Space Telescope Science Institute, which is operated by the Association of Universities for Research in Astronomy, Inc., under NASA contract NAS5-26555. These observations are associated with proposal ID GO-6674.
Abstract
HST WFPC2 images are presented that span the inner 19 kpc diameter of the edge-on galaxy NGC 3079; they are combined with optical, emission-line imaging spectrophotometry and VLA images of radio polarization vectors and rotation measures. Ionized gas filaments within 9-kpc diameter project up to 3 kpc above the disk, with the brightest forming the kpc diameter superbubble. They are often resolved into strands (25 pc) wide, which emerge from the nuclear CO ring as five distinct streams with large velocities and velocity dispersions (FWHM 450 km s-1). The brightest stream emits of the superbubble H flux and extends for 250 pc along the axis of the VLBI radio jet to one corner of the base of the superbubble. The other four streams are not connected to the jet, instead curving up to the vertical kpc above the galaxy disk, then dispersing as a spray of droplets each with of ionized gas (the volume filling factor ). Shredded clumps of disk gas form a similar structure in hydrodynamical models of a galaxy-scale wind. The pattern of magnetic fields and the gaseous kinematics also suggest that a wind of mechanical luminosity ergs s-1 has stagnated in the galaxy disk at a radius of pc, has flared to larger radii with increasing height as the balancing ISM pressure reduces above the disk, and has entrained dense clouds into a “mushroom vortex” above the disk. H emissivity of the filaments limits densities to cm-3, hence kinetic energy and momentum to ergs and dyne s, respectively; the ranges result from uncertain space velocities. A prominent star-forming complex elsewhere in the galaxy shows a striking spray of linear filaments that extend for hundreds of parsecs to end in unresolved “bullets.”
1 INTRODUCTION
An energetic outflow can inflate a “superbubble” to a size that exceeds the scale height of the interstellar medium (ISM). If the bubble ruptures, ejecta can alter chemical abundances across the galaxy. The superbubble is comprised of various shock fronts in the ISM and the outflow ejecta. The ISM and ejecta have several phases with different density, temperature, embedded magnetic fields, and dust distributions, and the shocks have different properties depending upon the phase through which they are propagating. The flow must therefore be observed across many wavebands from the radio to hard X-rays, but is often seen most clearly by imaging spectrophotometry of optical emission lines. Spatial resolutions and sensitivities of current instruments suffice to diagnose gaseous conditions for only the nearest and brightest superbubbles (e.g. M82, Shopbell & Bland-Hawthorn 1998; NGC 253, Forbes et al. 2000; NGC 4438, Kenney & Yale 2000; Kenney et al. 1995) where the angular scale is large enough to constrain dynamical models.
One of the clearest examples is the superbubble emerging from the disk of the edge-on SB-pec (de Vaucouleurs et al., 1991) galaxy NGC 3079; galaxy properties are summarized in Table Jet- and Wind-Driven Ionized Outflows in the Superbubble and Star-Forming Disk of NGC 3079111Based on observations made with the NASA/ESA Hubble Space Telescope, obtained at the Space Telescope Science Institute, which is operated by the Association of Universities for Research in Astronomy, Inc., under NASA contract NAS5-26555. These observations are associated with proposal ID GO-6674. . The X-shaped radio structure on the nucleus discovered by de Bruyn (1977) was subsequently resolved into a figure-8 pattern by Duric & Seaquist (1988, hereafter DS) in the radio continuum, and by Ford et al. (1986) in optical line emission. The nucleus contains the most luminous known H2O megamaser (Henkel et al., 1984) which Trotter et al. (1998) resolved spatially, and has large extinction, so conditions there have been established from IR emission lines and radio-frequency spectra (Irwin & Seaquist, 1988; Irwin & Sofue, 1992; Baan & Irwin, 1995) which show outflow signatures.
Heckman, Armus, & Miley (1990) and Filippenko & Sargent (1992, hereafter Paper I) obtained long-slit spectra of the ionized gas associated with the superbubble, and found large velocity gradients and emission-line widths in the patterns expected for an expanding structure. In Veilleux et al. (1994, hereafter Paper II) we used Fabry-Perot spectrophotometry to map the ionized superbubble, showing that its pattern of radial velocities is consistent with an outflow whose space velocities increase from the nucleus.
Because of its considerable extinction (Ptak, 1997; Sofue et al, 2000), the nuclear power source manifests itself primarily by reprocessed radiation. How the superbubble filaments are powered is thus uncertain. Their total ionized mass and kinetic energy (KE) are scaled by gas densities whose values are poorly constrained due to blending in ground-based spectra (of the red [S II] doublet flux ratio) and images (to establish the emitting volume). DS modeled the radio structure as a wind-blown bubble from the active galactic nucleus (AGN), and Hawarden et al. (1995) concluded that an AGN wind is responsible largely because hot dust characteristic of a starburst is absent; Israel et al. (1998) subsequently found hot dust out to a radius of 300 pc. The structure appears to be in a “breakout” stage, with the driving wind expanding freely into a halo of diffuse X-ray emission (Pietsch, Trinchieri, & Vogler, 1998, hereafter PTV). An AGN in NGC 3079 opens the possibility of a more collimated outflow, and indeed a jet has been proposed (Irwin & Seaquist, 1988; Trotter et al., 1998; Sawada-Satoh et al., 2000) to explain several aligned, VLBI-scale radio knots along with the maser kinematics (Sawada-Satoh et al., 2000). Irwin & Seaquist (1988) argued that a jet alone may inflate the superbubble.
If the wind arises from an optically extinguished AGN, it provides a nearby laboratory for study of processes thought to have operated in dust-shrouded proto-quasars. If the wind is associated with a starburst, the processes operating in IR ultra-luminous, distant galaxies can be studied in detail. To address these issues, in §2 we present Hubble Space Telescope (HST) WFPC2 and unpublished VLA333The VLA is a facility of the National Radio Astronomy Observatory. The National Radio Astronomy Observatory is a facility of the National Science Foundation operated under cooperative agreement by Associated Universities, Inc. radio continuum images of the galaxy disk and superbubble. In §3 we derive properties of the magnetic fields, and show that ionized filaments are often resolved transversely so that we can constrain their gas densities and filling factor from recombination fluxes. Some filaments with large velocity dispersions align with the VLBI-scale axis, extending the directly detected influence of the jet to 250 pc radius. In §4 we discuss the dynamical state and power source of the superbubble. We outline some future observations in §5, then summarize our results and conclusions in §6.
2 OBSERVATIONS AND REDUCTIONS
2.1 HST WFPC2 Images
For sharpest images in exposures of reasonable duration, we spanned the inner parts of the galaxy with two chips of the WFC but “dithered” the exposures between two points separated by 250 (confirmed to by cross-correlating image pairs); see Table 2. We imaged the galaxy on two rather than three WFC detectors to maximize coverage perpendicular to — rather than along — the plane of the galaxy disk. The PC chip covered the outskirts of NGC 3079, and did not obtain useful data. Our filters passed the I-band (F814W) and [N II]6548,6583+H (F658N) emission-line complex. The two I-band exposures were sufficiently short that we did not need to obtain multiple images to identify cosmic-ray hits. Four narrow-band F658N images were made, two at each dither position.
“Warm pixels” were treated using the appropriate dark frame that became available several weeks after our exposures. The dithered frame gave us information at these locations, so we interpolated linearly each frame to the position of its partner then patched in the affected pixels. The handful of residual cosmic rays and warm pixels in the combined dither images were removed manually. Because only a single continuum image was obtained at each dither position, cosmic rays were removed by first interpolating linearly each frame to the position of its partner, then selecting the minimum pixel value at each point from this image and its uninterpolated partner. Six counts were added to the uninterpolated frame (an offset that was determined empirically) so that the interpolated frame contributed only at the locations of cosmic rays or warm pixels in the uninterpolated frame. Less than 0.1% of the pixels in each frame were in this state, very few across the superbubble.
After cleaning artifacts and scaling to a common total exposure, we interleaved the frames at the two dither positions onto a grid of 00707 pixels. In the continuum image 90% of a star’s light is encircled within diameter ( FWHM Moffat function), as expected for a two-point dither on the WFC chips at this wavelength. We scaled the continuum image fluxes to ensure a “line”-only image after subtraction. To place the I-band image on an absolute flux scale, we used the color term for an SBc galaxy given in Table 6.2 of the WFPC2 Instrument Handbook.444www.stsci.edu/instruments/wfpc2/Wfpc2_hand/wfpc2_handbook.html
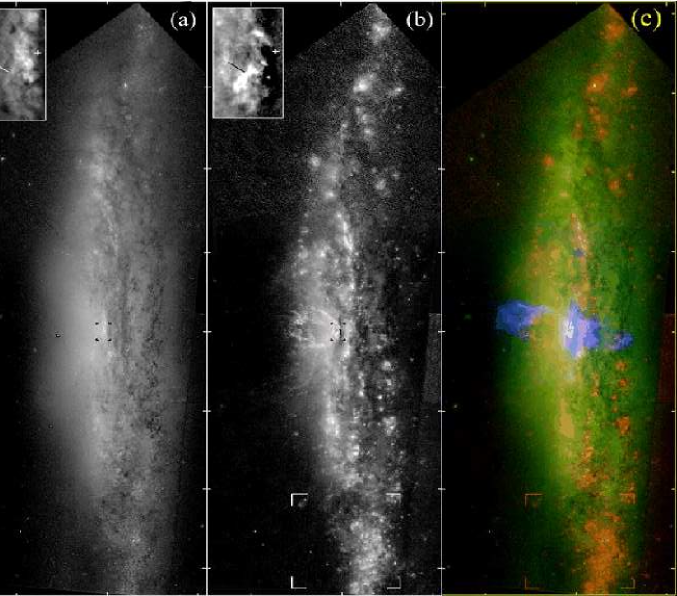
We obtained additional images from the HST archive (P.I. H. Falcke), see Table 2. Signal/noise ratios are smaller than those of our images because the galaxy nucleus was placed on the PC CCD and shorter exposures were used. However, the I-band archive image has slightly higher resolution on the nucleus than our dithered WFC images, and places the N half of galaxy on one of the WFC CCD’s, complementing our coverage. Composite images are shown in Fig. 1.
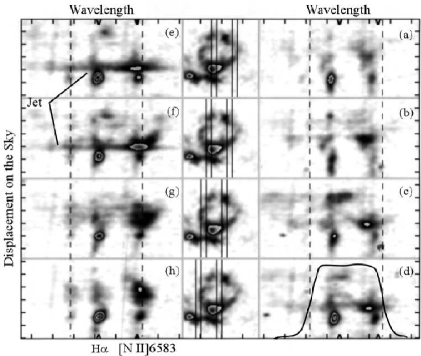
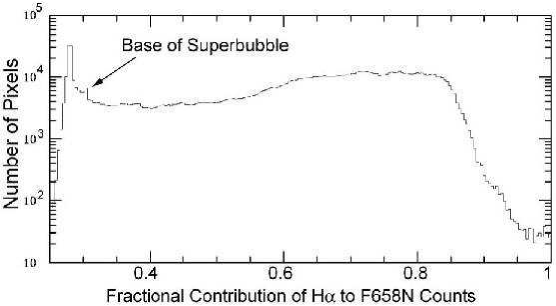
In the F658NF814W image, the flux contributions of the three emission-lines [N II]6548,6583+H passed by the narrower filter vary across the disk and especially across the superbubble. In Veilleux, Cecil, & Bland-Hawthorn (1995, hereafter Paper III) and Veilleux et al. (1999, hereafter Paper IV) we presented flux maps and velocity fields, respectively, for ionized gas outside the superbubble. We showed in Paper II that gas in the interval kpc has average line widths of km s dropping to 100 km s-1 farther out. We used these values to reconstruct emission-line profiles of the [N II]6548,6583+H complex at ground-based resolution (1″ FWHM), and then multiplied the result by the F658N filter profile to find the average flux fraction contributed by H at each point. Velocity gradients across the superbubble are large and vary in a complex fashion, see Fig. 2. In Paper I we had decomposed the profile of each spectral line of the [N II]H complex into 3 Gaussian subsystems within rectangular regions 057 high23 wide. Using this decomposition, we synthesized the complexes, multiplied them by the F658N profile, and inserted the resulting H weights into our weighted image. Fig. 3 shows the distribution of weights. Corrections exceed those for the disk: at the base of the bubble only 25% of the line flux through filter F658N comes from H (the spike at left in Fig. 3).
Next, we used the WFPC2 Exposure Calculator555www.stsci.edu/wfpc2/etc.html to find the H fluxes of H II regions whose [N II]6583/H flux ratios were measured in our ground-based data. From the sum of counts at these regions, we placed H fluxes in our interleaved, line-only frame on an absolute scale. The major change over Fig. 1b is to darken the lower half of the bubble where [N II]6583/H (Paper I); see Fig. 4a.
2.2 VLA Flux, Polarization, and Rotation Measure Images
Radio emission traces the outflow on all observed scales, and many images have been made following the discovery of minor-axis radio lobes by Duric et al. (1983). Using VLA images at 1.4 and 4.9 GHz, they constrained the rotation measure to the E bubble, rad m-2. But polarization studies are tough at 1.4 GHz because the 30% polarization seen at 4.9 GHz has been reduced to 3% by Faraday rotation. From the many datasets of NGC 3079 in the VLA archive, we therefore extracted unpublished datasets made by Dr. S. Caganoff and collaborators which are centered at 8.1 and 4.4 GHz (Fig. 5 and Fig. 6a). Details of the observations are given in Table 2.
Standard procedures under AIPS reduced the data at four frequencies. We then fit to each pixel to map the transverse electric field () (0) and the . Uniform weights produced a beam of 1.65″ 1.59″ (HPBW) along PA = 13.3°. Figs. 5 and 6 are insensitive to features 30″. Fig. 6b shows that the 3.8 cm radio emission is Jansky arcsec-2 inside the superbubble.
3 EMPIRICAL RESULTS
3.1 Dust Plumes and the Pattern of Scattered Light in the Galaxy Bulge
Much of the “peanut bulge” discussed in Paper IV may arise from scattered nuclear or inner-disk starlight. Israel et al. (1998) argue from their near-IR broad-band images that 20–30% of the bulge light must be scattered. The pattern we see in the I-band image (Fig. 1a) is bilobal and straddles the superbubble. The outflow appears to have depleted the central cylinder of dust, and indeed, several dust plumes arch out from the bottom half of the superbubble to fall back onto the galaxy disk. The increased dust load in the presumed toroidal lobe enhances scattered starlight. Scattering in the foreground halo also seems to “soften” the appearance of dust filaments near the nucleus and in the background disk to produce the striking impression of “depth” in e.g. Fig. 4a.
We quantified dust extinction by comparing the I-band surface brightness measured toward a dust feature with its local background (e.g. Howk & Savage, 1997). Foreground starlight reduces absorption by . Defining as the fraction of starlight emitted in front of the feature, where approximates the maximum extinction optical depth through the dust. We ignored light forward scattered along our line of sight, and also assumed that dust has small depth compared to stars so it acts as an external screen. We averaged 5-pixel wide intensity cuts through a prominent dust arc in Fig. 4a at the edge of the superbubble.
A single color cannot constrain tightly both and . By bounding , we found that mag. ( mag, assuming for the ratio of absolute to relative extinction). Multiplying cm-2 by to convert H to total mass (He + typical metal fraction), and treating the dust arc as a cylinder of radius and length 3″, we found that the total mass is larger if dust was destroyed during cloud acceleration. Despite this high mass, the dusty feature shows no line emission, underscoring the need to map the outflow in many ISM phases.
3.2 Dereddening
The J-K color map of Israel et al. (1998) shows enhanced reddening W of the nucleus. This is also apparent in Fig. 1b as an over subtraction of the I-band image from the F658N exposure, which forms the dark zone at the base of the superbubble. Fig. 4a shows that the ionized filaments of the superbubble originate from an elliptical region in extent, with patchy obscuration. On this scale there is a ring between 125 (Sofue & Irwin, 1992, from CO) and 35 (Meaburn et al., 1998, from molecular H and radio continuum) radii that is rotating at km s-1 (Israel et al., 1998). Israel et al. (1998) find emission of L⨀ to a height of pc and out to 300 pc near the galaxy disk plane.
In Paper II we used long-slit spectra of the H and H lines (corrected for Balmer absorption) to determine an average reddening optical depth of at the nucleus, in the bottom third of the superbubble, and zero beyond; the value on the nucleus agrees with that found by Israel et al. (1998) across the inner ″. Accordingly, to deredden the filaments, we bracketed the extinction gradients with height by using two linear trends such that at the base of the bubble, declining to at heights between 3 and 4″, and to no reddening by 8″ and 10.5″ height, respectively. The superbubble is projected on diffuse, ionized emission which is a mixture of true vertical structure and the outskirts of the background galaxy disk. As we summed the flux of each filament, we therefore subtracted the average vertical gradient outside the superbubble.
Isolated in this fashion, the superbubble H flux sums to ergs s-1 cm-2 with compact filaments emitting slightly more than half, the jet (§3.10) 10%, and diffuse emission 1/3, of the total. We found an H luminosity of the filaments of ergs s-1 (depending on the reddening), comparable to what we derived from the ground-based spectra (Papers I & II).
3.3 Constraints on Ionized Densities and Masses
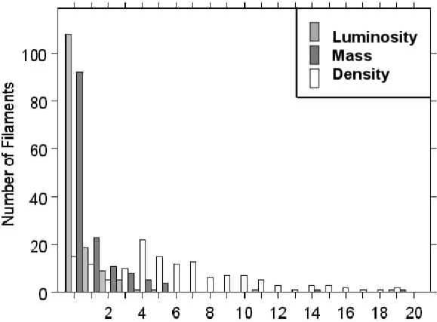
Fig. 8 shows the H luminosity function of filaments labeled in Fig. 7, assuming the smaller reddening discussed above. We estimated a minimum volume of each filament by assuming a cylinder with depth equal to its thinnest dimension (measured at the contour of 50% peak emission) on the sky; many filaments are barely resolved in one dimension — 025 FWHM thick after accounting for instrument blur — and most at the top of the superbubble are unresolved. Assuming Case-B recombination conditions at 104 K and the electron density is cm-3 for gaseous filling factor and emitting volume . The flux-averaged, ionized density of the superbubble filaments is cm-3; Fig. 8 shows the population distribution and the distribution of ionized mass which sums to M⨀. We used Monte Carlo techniques to quantify the uncertainties of these derived parameters. We assumed that the H luminosity is known to (half of this uncertainty comes from the reddening ambiguity, half from the distance to NGC 3079) and the volume to (which encompasses the range of filament widths that are resolved in the H image). Table 3 lists mean and extreme values of the density and mass of each filament under these assumptions, and whether the filament is resolved.
In Paper II we found no evidence from the red [S II] doublet flux ratios that the ionized gas exceeds the low-density limit cm-3 across the superbubble. This and our new HST results now constrain the gaseous filling factor to of the gas volume. A typical filament therefore has ionized mass ; filaments near the top of the superbubble are smaller and fainter, and we find have ionized mass If filaments are fragments of molecular clouds lofted from the galaxy disk (see e.g. the models of Schiano, 1986; Suchkov et al., 1994), then this constrains only the mass of their outer ionized sheath.
3.4 Superbubble Filaments
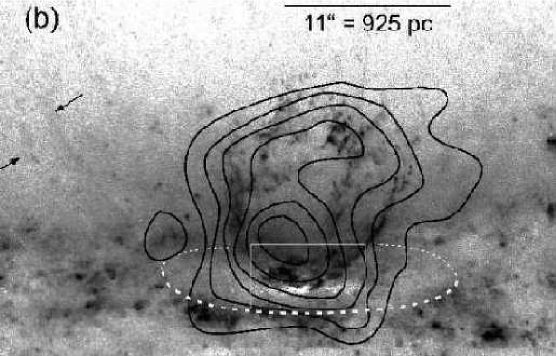
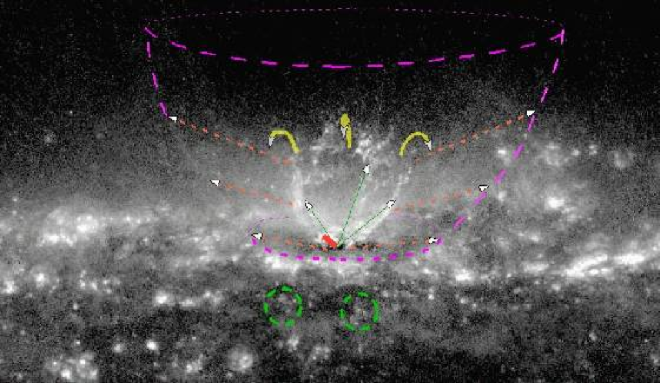
Fig. 4 shows that four prominent bundles of ionized filaments emerge from the CO ring, and appear to be spaced 90° apart in azimuth. They are close together in (perhaps intertwined?) bundles until they reach a height of 550 pc, at which point each bundle separates and the strands, otherwise unchanged in appearance, make sharp angles on the sky while still trending upward. Fig. 6b shows that at greater heights strands are replaced by a spray of loops and arches that appear to “drip” toward the galaxy disk; the apparent connection between knots and arches may be spurious because of limited spatial resolution. Fig. 4b shows that the soft X-ray emission peaks along the drips. Beyond, isolated small clouds are evident 1.5 kpc above the galaxy disk. Beyond the clouds, radio emission continues outward as a “cap” to 28″ (2.3 kpc) radius. At still larger radii, soft X-ray emission fades into the ROSAT background (PTV).
3.5 Constraints on the Magnetic Field
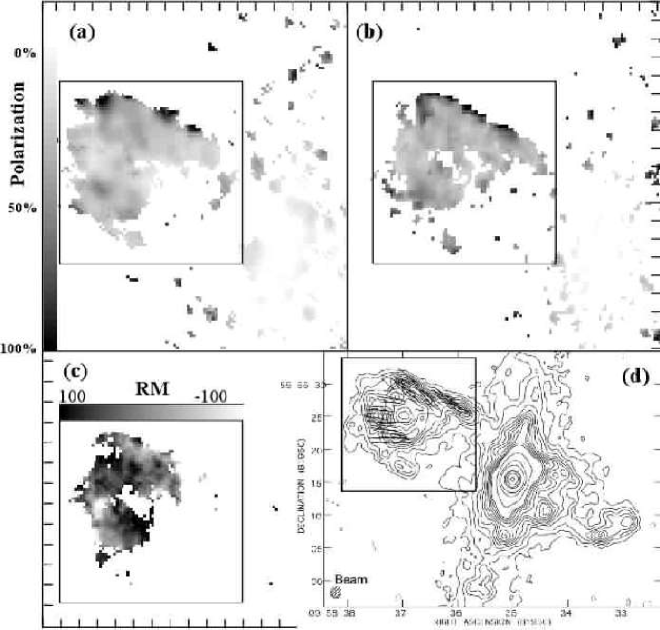
Fig. 5c shows that the E radio lobe has a well-ordered magnetic field, indicated both by its high polarization (% at 6 and 3.8 cm wavelengths) and by the trend in rotation measure . While is nearly constant along the polar axis, perpendicular it changes sign from 50 rad m-2 on the inside to rad -2 toward the outer edge. The line-of-sight component of the magnetic field () reverses dramatically whereas the transverse field () aligns with the outflow, particularly along the N edge.
The E lobe appears as a loop or limb-brightened shell; similar radio structures are seen in other inclined galaxies (e.g. NGC 2992, Wehrle & Morris, 1987). Whether it forms part of a shell, closed or open loop or bubble, anchored or otherwise to the central disk is an important clue to its origin. Unfortunately, Fig. 5 shows that we have information only for the sides of the radio lobe. The connection with the disk and the cap of the radio lobe (Fig. 5a) is too faint to derive polarized intensities. However, the inversion inside to outside is compelling and, to our knowledge, has never before been observed.
The form of excludes a field centered on the lobe because the projected field would integrate to zero. Our fits to follow a dependence closely, all but ruling out a Faraday-rotating medium within the synchrotron source (Sokoloff et al., 1998). Because polarizations are sometimes close to the maximum possible value (75%, Burn, 1966), little depolarization can have occurred. Indeed, the slow spatial/spectral behaviour of compared to the beam rules out beamwidth/bandwidth effects. Thus, the Faraday screen lies predominantly in front of the synchrotron source and is partly resolved. The mean rad m-2 is easily generated and constrains the density of the screen. Duric et al. (1983) derive a mean field of 20 G for the E lobe. We derive a lower limit on by equating 50 rad m-2 with the limit on H emission measure in the lobe ( cm-6 pc). If the depth of the Faraday screen is 10 pc, because , we derive G. The required gas density is cm-3.
At the wind speed postulated in §4.2.1, it is unlikely that magnetic energy density dominates the thermo-kinetic energy of the flow. The wind may simply carry along the magnetic field (Klein, Wielebinski, & Morsi, 1988). Unless the compressed field is much higher than implied by minimum energy arguments, the above numbers are fairly restrictive and suggest that the radio lobe beyond the superbubble should emit detectable H emission at a flux of 10-18 ergs cm-2 s-1 arcsec-2, of our current threshold (Paper II).
In light of the optical data, we suspect that the polarized emission arises from a limb-brightened incomplete shell (partial bubble) that is tilted slightly to the line of sight. The radio bubble is expanding into a magnetized, hot (PTV), low-density halo. The radio continuum is presumably limb-brightened where the field is highly compressed. In §4.2.3 we provide a qualitative model to explain the inversion.
3.6 Optical Emission from the Counterbubble
In Fig. 11 of Paper II we traced line emission from high-velocity gas between projected radii of 10″ and 15″ (panels c & d) W of the nucleus. Here Fig. 1b shows line-emitting regions with [N II]653/H flux ratios like those in the E superbubble. Spectra of IR recombination-line flux ratios would constrain the reddening, hence energetics of the ionized counterbubble.
3.7 Morphology of Disk H II Regions
Properties of the star-forming, large-scale galaxy disk will be considered in a later paper. However, energetic, non-planar motions are of immediate relevance.
A notable feature of the H II regions in NGC 3079 is their tendency to “blister open” at their tops, see especially the outer ring in the right-hand half of Fig. 1b. H I arc “C” of Irwin & Seaquist (1990) lies above this region. As discussed in §4.4 of Paper III, such structures suggest vertical motion of gas up “galactic chimneys” which also allow photons to escape from the disk to energize the prominent diffuse ionized medium.
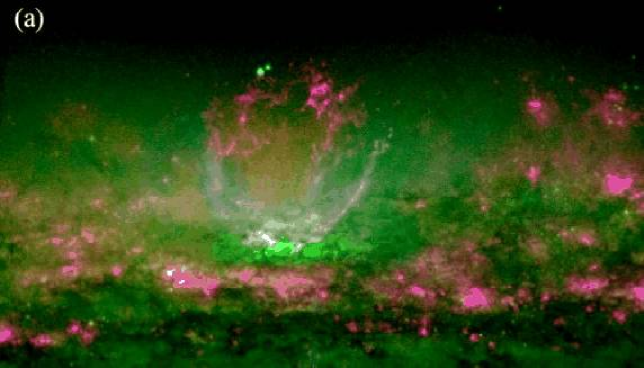
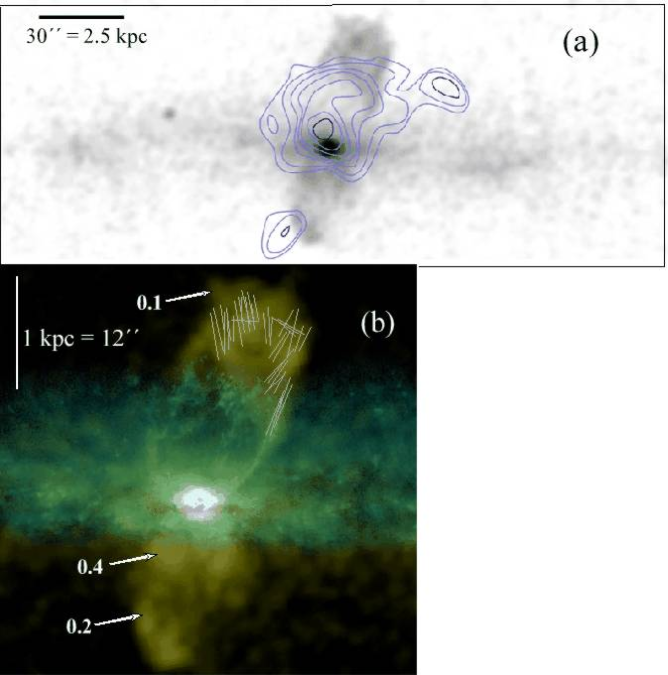
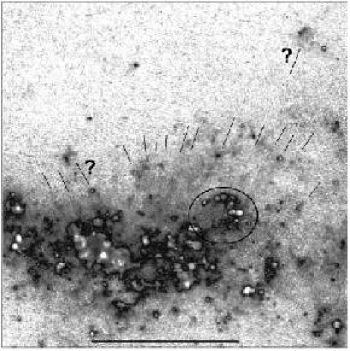
A striking active region is marked near the left-hand side of Fig. 1b, where Fig. 1a shows a high density of resolved stars and dust filaments. This complex lies well beyond the maximum radius of the stellar bar, is a local flux peak in the 245 GHz continuum (8 mJy over 11″ diameter), lies below H I arc “D” of Irwin & Seaquist (1990) which requires formation energies ergs, and has X-ray luminosity ergs s-1 in the ROSAT HRI band (source H14 of PTV). Fig. 9 shows that over a diameter of 15″, roughly a dozen linear filaments protrude for 0.6 kpc. They have broad line widths (200 km s-1 corrected for instrumental resolution), but mean velocities equal to that of the rotating galaxy (Paper IV for the ionized gas, and Irwin & Seaquist (1991) for the H I) at their projected radius. Fig. 9 also shows unresolved knots of line emission at the ends of many of these filaments. The three brightest knots have H luminosities of ergs s-1 assuming no reddening. Two features labeled “?” in the figure have velocity FWHM 200 km s-1 in our Fabry-Perot spectra (Fig. 4c of Paper III), and sharp edges on the side directed away from the source of the linear filaments. These structures resemble superficially Galactic Herbig-Haro objects, but are far more energetic.
3.8 Velocity Field of Ionized Filaments in the Superbubble
3.8.1 Previous Results
As mentioned in §3.2, emission line profiles in Fig. 2 have a component from gas in the background galaxy that is separable from energetic gas in the superbubble by its modest deviation from the galaxy systemic velocity 666 As discussed in §3.2.1 of Paper IV, the systemic velocity of NGC 3079 depends on the waveband of observation. Values 115025 km s-1 result from the combined effects of a disk bar and possible warp, and differences in optical depth and orientation to various galaxy components. We use km s-1. and by the small values of its [N II]6583/H flux ratios (which are typical of H II regions, see Fig. 3 of Paper II). The spectral profile from a 057 high23 wide box often spans several hundred km s-1, arising from “turbulent” motions within a filament or gradients that are unresolved at ground resolution. An example is at the bottom left-hand corner of the superbubble, where filaments 45, 49, & 61 have opposite velocities ( km s-1) despite being adjacent on the sky.
In Paper II we showed that the superbubble velocity field is a partial “Doppler ellipsoid,” with the centroids of emission-line components spanning radial velocities -1050 to +550 km s-1 relative to , and having maximum velocity splitting 1250 km s-1 near the mid-axis of the superbubble. Velocities do not return to small values at the top of the superbubble as they do in spatially resolved spectra of planetary nebulae; instead, line emission fades away as velocities reduce modestly from extreme values. In Paper II we showed that this pattern is quite well reproduced by a nuclear outflow wherein filament space velocities accelerate to 3700 km s-1 at kpc as , with 2.5, while motion vectors swing toward the sky plane as the bubble cap is approached. The main deficiency is in the N half of the superbubble, where the model predicts redshifts from vsys of 550 km s 200 km s-1 observed for the presumed backside gas.
3.8.2 Refinement Motivated by Present Data
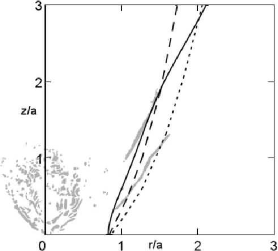
The HST line image shows that the filaments are organized into four well-defined vertical bundles, each fortuitously spanning the 1″ resolution of our ground-based spectra. Although we cannot assign an unambiguous value to a filament, we can bound velocities in each bundle with the radial velocities mapped in Fig. 4 of Paper II. We find that most filaments have blueshifted motions relative to , with largest radial velocities in the spray of arched filaments near the top of the bubble. Anticipating the dynamics to be discussed in §4.2, it is plausible that these are “mushrooming” out of the bubble with a substantial motion along our sightline. So we refined the field used in Paper II, now assuming expansion mostly parallel to the disk plane at set height in the bubble (Fig. 10), with space velocity comparable to the observed velocity of the blue wing along the mid-axis of the bubble. At left in Fig. 7 we show the adopted space velocity at each height. The expansion velocity that we infer at the base of the bubble is consistent with the values derived there by Hawarden et al. (1995) from transitions and mapped by Israel et al. (1998) (see also Fig. 11). Together, this model and the nucleus-centered pattern used in Paper II should bracket the true motions.
3.9 Bulk Energies and Momenta of the Ionized Filaments
Table 3 lists maximum and minimum space velocities of each filament as derived from the projections of Paper II and §3.8.2, respectively. Total KE and momentum of ionized gas in the superbubble sum to ergs and dyne s, respectively; values for each filament are also shown in Table 3. We retain our estimate from Paper II of “turbulent” energy — ergs for the blue-wing component. This is now an upper limit, because we now resolve some of the line broadening into discrete filaments each with a bulk KE.
3.10 Jet Emission Near the Nucleus
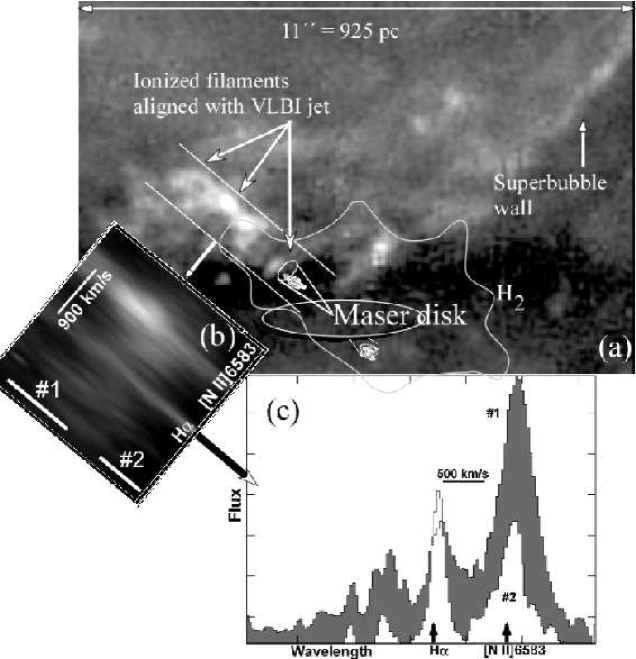
Fig. 11 shows that the brightest stream of ionized filaments projects near the S boundary of the superbubble base, and coincides with the axis of the putative VLBI-scale jet mapped at 8 GHz by Trotter et al. (1998) and Sawada-Satoh et al. (2000). In the magnified inserts in Fig. 1 this feature has H surface brightness ergs s-1 cm-2 arcsec-2 coincident with a narrow plume of I=16 mag arcsec-2 continuum light that points to the nucleus. Using the HST line-only image Fig. 1b to define a mask of the jet emission, we summed spectra from our ground-based Fabry-Perot datacube to map velocities (see Fig. 11b), then averaged spectra at two intervals along the jet (Fig. 11c); the mean velocity of the two summed spectra is redshifted by 125 km s-1 relative to vsys. Elsewhere the corrected FWHM is 200 km s-1 and [N II]/H. In the two summed spectra we subtracted this component to isolate a broader jet-specific feature whose H flux we then deblended from the adjacent [N II] doublet. This component has centroid blueshifted 125 km s-1 relative to vsys. Fit results are reported in Table 4; the KE is a lower limit assuming that the broader feature arises entirely from expansion around the jet that projects all motion onto our line of sight. Actually, gas kinematics constrains jet orientation and space velocity poorly because gas is ionized at radiative shocks within the thermally unstable cocoon/ISM interface.
4 DISCUSSION
4.1 Nuclear Jet
Irwin & Seaquist (1988) suggested that the superbubble could have been blown by a precessing VLBI-scale jet; Baan & Irwin (1995) elaborated on this scenario. Irwin & Sofue (1992) interpreted extensions of CO(J=1-0)-emitting gas into the base of the superbubble as resulting from a jet/ISM cloud interaction. Using pressure confinement arguments and the minimum momentum flow, they estimated that the putative jet has velocity km s-1 and power ergs s respectively. Over the 1 Myr dynamical age of the superbubble (Paper II) the KE exceeds ergs, which suffices to power the CO outflow.
Irwin & Seaquist (1988) resolved the nuclear emission into a flat-spectrum radio core with parsec-scale collimation along P.A. 120°. Trotter et al. (1998) further resolved this structure into four clumps with radio spectra inverted between 5 and 8 GHz, and steep between 8 and 22 GHz; in this sense the nuclear sources resemble a low-power analog of powerful radio galaxies. Sawada-Satoh et al. (2000) found that the spectral indices and fluxes of several of these knots changed considerably in 22 months and that knot motions were consistent with expansion from the nucleus at an apparent velocity of c. The four clumps align precisely (see §3.10 and Fig. 11) with the brightest stream of filaments at the base of the superbubble. Three results suggest that the elongated, ionized feature is energetic (not ambient gas photoionized by the AGN):
- 1.
-
2.
Velocities of both ionized (§3.10) and molecular gas (Israel et al., 1998) peak in this extranuclear region. Velocities of order km s-1 will produce shock emission ergs s-1 (A is the shock surface area in pc2 in an ambient ISM of density cm-3). The luminosity of filament #3 in Table 3 arises from pure shock ionization if cm-3.
-
3.
Here optical emission-line profiles are broad ( km s-1 FWHM, §4.1), as we would expect from gas shock-heated as a jet impacts the inner boundary of the molecular cavity in the disk. Indeed, Israel et al. (1998) see bright H2 emission and hot dust K nearby.
Rossi et al. (2000) showed by numerical simulation that a jet propagating through the ISM in a spiral galaxy radiates on average of its KE as ionizing photons at each interaction site, with ionizing luminosity over a wide range of jet velocities and ISM densities. From Table 3 the ionizing luminosity ergs s-1 can therefore inject the KE ergs of the superbubble over its dynamical age if the jet has operated with high enough duty cycle.
We can constrain the age of the radio bubble independent of the optical outflow. If we assume the bubble was inflated by the jet but then lifted by buoyancy, the buoyancy timescale is where is the cavity radius and is the distance to the center of the galaxy. This assumes that the surrounding gas has to fall around the cavity at speed and that the cavity must move before gas needs to be replaced. Our picture is of a light bubble which is temporarily overpressured relative to its surroundings and thus rises and expands as the ambient density dropped. The timescale for buoyant rise always exceeds that for reaching local pressure equilibrium.
We take the cavity as 1 kpc diameter at 5 kpc from nucleus. We derive from the Galaxy mass model, such that the mass goes as (in kpc) beyond 3 kpc (Freeman, 1996) assuming a spherical potential. The last term involves which is the deprojected rotation velocity on the flat part of the rotation. curve. In Paper IV we find for NGC 3079 that km s-1 such that , so yrs.
To form the whole superbubble, the jet would have had to precess from its current orientation at the S corner. However, the four vertical bundles of filaments that constitute the superbubble and which all break at the same height above the disk are not explained by jet precession or bouyancy. To inflate this structure we now examine a wide-angle wind as proposed by DS.
4.2 Dynamics of the Wind-Blown Superbubble
As an outflow inflates a superbubble, the various gas phases organize into a characteristic pattern of shock and ionization fronts, as described by e.g. Schiano (1985, 1986) and simulated by e.g. Strickland & Stevens (2000): from largest to smallest radii in a mature superbubble there is undisturbed ISM, perhaps a photoionized precursor, a dense shell of compressed ISM that forms a standing “ring” shock, the contact discontinuity between the two fluids, hot shocked wind, a wind shock, and free-blowing wind near the sites of energy injection. Several such structures may be evident, depending on the density structure of the galaxy ISM and on the detailed history of the power source. The hot, shocked wind cools by lateral expansion and by mixing with the ambient ISM at the Rayleigh-Taylor (RT)- and Kelvin-Helmholtz-unstable interfaces between the two fluids.
If the wind is sufficiently energetic or long-lived to “breakout”, then its flow becomes a strong function of polar angle seen from the nucleus: free flow up to a critical angle wherein its ram pressure becomes comparable to the thermal pressure in the diffuse component of the ISM; at larger angles a standing bow shock in the galaxy disk decelerates and deflects wind around a region of undisturbed ISM gas. The wind subsequently reaccelerates into the halo. In the following subsections, we will identify many of these structures in our data. Table 5 lists dynamical parameters derived in Paper II, scalings we will use in §4.3.
4.2.1 ISM “Ring” Shock
Except for the volume occupied by the superbubble filaments, the concave bowl of a pre-blowout superbubble must be filled largely with shocked wind (zone B in the nomenclature of Weaver et al., 1977). The free-wind zone A is on a much smaller scale, presumably within the cavity of the molecular ring in NGC 3079. If the wind has not encountered enough background gas to halt its free expansion, it blows out and then the shocked wind is found only near the outer (ISM) shock in a ring near the galaxy disk.
We can infer from Fig. 11b that the wind must have a high enough luminosity to have pushed the ring (ISM) shock to pc radius near the disk plane. The models of Schiano (1985) show that this occurs when ergs s-1 for reasonable ISM properties for NGC 3079, and the resulting flow can reach the galaxy halo if it persists. The smallest wind luminosity for blowout occurs when the diffuse ISM (i.e., neglecting dense clouds) swept up by the wind becomes comparable to the wind mass, at time by Schiano (1985). For an exponential variation of ambient gas density , we have when ergs s with the scale height in kpc, the gas density in cm and the wind velocity in cm s The equal-pressure stagnation/stand-off radius in the galaxy plane kpc, where a combination of wind and ISM parameters. At blowout, Schiano (1985) has argued that the contact discontinuity between shocked wind and ambient ISM lies near the ISM ring shock, a conjecture supported by simulations (e.g. Strickland & Stevens, 2000). Pressure balance then sets the angle between the radial wind direction and the surface normal to the contact discontinuity
where , , and is the pressure distribution. The shape of the contact discontinuity follows by solving the quadratic equation
for and then numerically integrating an -parameterized model from the initial value in the disk-plane .
We considered several forms for : exponentials in both and , exponential only in ( constant over the height of the superbubble), and power-law only in (again, constant). Fig. 12 scales these forms to match the observed shape of the outer shock. The H I and diffuse ionized gas scale-heights of NGC 3079 are uncertain but may be 0.5 kpc (Irwin & Seaquist, 1991, §3.1 of paper II, respectively) to 1 kpc, whereupon the filaments extend to . Evidently the calculation is not very constrained, but the simulations of Suchkov et al. (1994) to be discussed shortly do match our images with an exponential disk and spherical densities for the stellar spheroid and halo.
4.2.2 Comparison to Hydrodynamical Models
The HST images strengthen our assertion in Paper II that the superbubble has “blown out” of the galaxy disk: the linear X-filaments discussed in Papers II and III are now shown to join the galaxy disk at radii of ″, forming the “concave bowl” that we attribute to the standoff outer disk shock/contact-discontinuity. Other features also suggest a disk shock:
-
1.
Schiano (1985) estimated the evolving shape of the wind-driven complex, see his Fig. 8. For wind parameters and (cgs units and values similar to those inferred by DS except for being twice their wind velocity), the inner (wind) shock lies at two scale height radii where we see the filamentary shell, while the outer (ISM) ring shock sits at scale heights in the disk where we see the edges of the concave bowl.
-
2.
The structure has a large [N II]/H flux ratio that is correlated with line widths of 100-250 km s-1 (Paper III), consistent with shock emission.
-
3.
For central gas density 100 cm-3 and wind speed cm s-1, the wind model of DS has a central cavity at 0.5 kpc radius which expands at 300 km s The radius is about half what we observe up the bubble (but similar to the bright green region at its base in Fig. 4), while the expansion rate they expect is comparable to what in §3.8.2 we attributed to that of the back wall of the bowl. That gas reaches 550 km s-1 relative to vsys. Hawarden et al. (1995) rescale the parameters of the DS model to the higher densities expected in the molecular disk at a radius of 50 pc, and obtain reasonable agreement with shock velocities inferred from their H2 spectra.
Suchkov et al. (1994) and Strickland & Stevens (2000) simulated the appearances at X-ray and optical temperatures of a superbubble at various stages of its wind-driven evolution. They parameterized models by temperatures, scale heights, masses, and densities of the galaxy disk and isothermal halo. Suchkov et al. did not include a stellar disk because the bulge gravity dominates; their model injects energy within a radius of 150 pc, comparable to the molecular disk in NGC 3079 (Fig. 11). They discussed the time evolutions of the temperature and density distributions.
To constrain parameters of NGC 3079 we used the X-ray results from PTV, who inferred from the spatial variation of ROSAT PSPC spectra (and the HRI image) of NGC 3079 a hot halo with density cm-3; depending on the average value of in the ionized filaments, this is consistent with either of the Suchkov et al. “B”-models. In contrast, the “A” models have a large halo mass, and lead to flows that differ dramatically from what is observed in NGC 3079, viz. the relatively large mass above the disk causes the wind to breakout laterally across the disk, not what we observe. Mapping the putative hot halo awaits the increased sensitivity of the Newton X-ray Observatory (XMM); these data may provide evidence that the halo results from extensive star formation in the galaxy disk that predated the superbubble.
However, with current X-ray data we can say that the HST emission-line image more closely resembles the predictions of Suchkov et al. model B1 rather than B2. B1 has lower disk gas density than B2 ( vs. 12 cm-3), is hotter ( vs. K), and has ten times the halo density hence a higher disk vertical scale-height (160 vs. 60 pc). The hotter gas disk in B1 seems more appropriate for a star-forming system like NGC 3079. The halo density of B2 is too tenuous to confine the wind. B1 produces a conical “nozzle” with length/diameter ratio comparable to that of the concave bowl in NGC 3079. In contrast, the tenuous halo of B2 is much less collimating.
Peak velocities derived for disk-gas filaments entrained in the wind are 1300 km s-1 for B1 vs. km s-1 for B2 (Suchkov et al., 1994); these straddle observed values in the superbubble (Paper II). Fig. 13c shows velocities of B1 during breakout at 3.2 Myr (older than the superbubble in NGC 3079). At this stage of the model outflow, much of the space velocity near the top of the bubble is projected along our line of sight. The HST images do not suggest vortices until radii of ″. The models predict that the vortices will eventually propagate down the walls and grow to disrupt the superbubble completely.
Another feature of model B1 resembles the HST structures: because the halo is so tenuous, entrained disk material tends to shatter into individual filaments. Each cloud impedes the wind flow separately via a stand-off bowshock upstream in the wind. The shocked wind acts to confine hence preserve the cloud during its acceleration. Such behaviour persists in three-dimensional numerical simulations (e.g. Stone & Norman, 1992). Overall, the B models reproduce many observed characteristics of this outflow.
4.2.3 Wind Compression of the Magnetic Field
The radio data also support a blowout vortex. The dramatic discontinuity in , high polarization levels, and aligned field may arise from the strong compressional shock of the wind. Models (Brandenburg, Moss, & Shukurov, 1995, hereafter BMS) show that outflows are expected to entrain disk material and frozen-in magnetic field. While initially highly turbulent, the field becomes stretched and compressed along the flow. Here we associate the positive regions with the updraft material, see Fig. 14b.
BMS show that as the entrained material cools, it rains back toward the disk outside the flow thereby reversing the field. This behavior is seen in the hydrodynamical simulations discussed in §4.2.2. By associating sinking gas with regions of negative , we obtain a plausible way to reverse in the E lobe (Fig. 6c).
BMS build their model on the observation that most halo fields appear to lie parallel to the Galactic disk (e.g. Beck et al., 1996). In our interpretation of Fig. 3 in BMS, the halo field is not seen. When these models are density weighted, only the central updraft and reverse flow are evident. The line of neutral magnetic field between regions of positive and negative is probably unresolved by our beam, and need not depolarize significantly.
An interesting variant on the BMS scheme is to associate the negative material with compressed, magnetized halo material (Fig. 14a). Global magnetic fields in galaxies are often well ordered and axisymmetric (Beck et al., 1996), and can extend many kiloparsecs into the halo. Dynamo models are summarized by Zel’dovich, Ruzmaikin, & Sokoloff (1983, hereafter ZRS). Disk and halo fields can have odd (dipole) or even (quadrupole) parity, and may even be of different polarity. This forms the basis for our alternative model for the field reversal in Fig. 6c. Again the wind drags its own field, but now runs into a quadrupole parity halo field with polarity opposite to the wind (e.g. Brandenburg et al., 1993). The sign of the rotation measure over the W lobe may establish if we are probing the compressed halo field or entrained material in outflows. Either outcome would be of interest.
A more exotic possibility (Yusaf-Zadeh, & Morris, 1987) is that the radio loop arises from a twisted field that protrudes from the disk, much like a solar prominence. This topology could explain the inversion. But, unlike a prominence, the loop cannot produce the observed synchrotron by winding up the field at the base of the loop. Magnetic energy in the twisted field increases at the rate , where is the footprint area and is the winding velocity. If we associate 1% of the loop’s radio energy with the winding, for a 300 pc diameter footprint the required twist rate is more than a hundred times larger than the vorticity or shear ( km s-1) associated with rotating disks. The disk field is entrained and dragged with the highly energetic flow. The wind is expected to evolve faster than the dynamo (106-7 yr vs. 108-9 yr, respectively). The mean magnetic field in the wind seems high. But circumnuclear activity may provide the turbulent dynamo that feeds the azimuthal field through differential rotation. This can be converted to vertical field if there are azimuthal gradients in the disk (Sokoloff, & Shukurov, 1990).
4.2.4 Disruption of Superbubble Filaments
Our images resemble the models of Schiano (1985), suggesting that the ionized filaments in the superbubble lie near the wind shock. In detail, this shock may take the form of separate bow shocks upstream of each dense filament. Bathed in hot shocked gas that flows by subsonically, the cool filaments will erode from thermo- and hydro-dynamical instabilities. However, filaments have survived long enough for the thermalized wind to expand for several kpc to form the stand-off shocked boundary of the concave bowl. What does this interpretation of the data say about the filaments?
Table 3 gives densities of the ionized outer sheath of the filaments where column length cm-2, whereas the estimate from dust in §3.1 applies only to non-line emitting structures. Because filaments have lofted to 1 kpc height, we can estimate their minimum column to survive saturated thermal conduction (Cowie & McKee, 1977). To resist evaporation (Krolik, McKee, & Tarter, 1981) requires that , where is the thermal cloud pressure in cgs units, is the height of the surviving filaments in kpc, and is their space velocity in units of 600 km s The embedded magnetic fields (§4.2.3) are too weak to alter these numbers much (Mineshige, Shibata, & Shapiro, 1993).
Suchkov et al. (1994) show that RT instabilities grow as where is the combined density of the ISM gas, and . These authors note that the wavelengths of perturbations which eventually disrupt the outer shell of a superbubble are of order the shell thickness. In NGC 3079, we see that the N shell wall is unresolved, FWHM so pc. From the model velocity field of the bar-forced disk in Paper IV, we find a circular velocity of 100 km s-1 at the radius of the superbubble. With these numbers, Myr. The dynamical time to inflate the bubble is somewhat greater (Table 5), so it is plausible that RT instabilities shear filaments into arches at the top of the superbubble. Because the ISM filaments are organized into discrete streams, they appear never to have formed a dense shell; thus, the wind can indeed break out into the halo with ease.
4.3 Constraints on the Power Source
Assuming the minimum value of from §3.3, the power source must be able to inject KE ergs into the ionized superbubble; this is comparable to the KE in the starburst-driven outflow of M82 (Shopbell & Bland-Hawthorn, 1998). Because the W radio lobe probably has a similar complex of optically obscured filaments, the KE of the ionized outflow is comparable to that driven by the AGN in NGC 1068 ( ergs, Cecil, Bland, & Tully, 1990).
We showed in Paper II that the starburst age and depletion time for gas to form stars exceed considerably the age of the superbubble. In support of numerous supernova remnants within a nuclear starburst, Pedlar et al. (1996) showed that the steep/inverted-spectrum radio sources are embedded at 20 cm in nonthermal emission that extends to 4″ along P.A. 170°. Meaburn et al. (1998) showed that this structure coincides with the warped molecular disk found by Sofue & Irwin (1992) to have total cool gas and of gas at its center. Braine et al. (1997) found that dust emission at 1.2 mm within a diameter 10″ is much less centrally concentrated than either the CO or radio continuum emission; they used this emission to derive a low conversion ratio, and hence a more modest mass of cold gas near the center, (adjusted for 17.3 Mpc distance). The center appears not to contain cool dust ( K), thereby resembling a low-luminosity version of an IR ultraluminous galaxy. Braine et al. (1997) therefore argued that stars are forming efficiently in this region, whereas Sofue et al (2000) find an ultra-high-density molecular core and maintain that its large differential rotation inhibits star formation.
To match the required injection rate of KE from a nuclear starburst would be ergs s-1 (Table 5). We had noted in Paper II that the observed mid-IR flux is consistent with a starburst of this power, asssuming no contribution from AGN emission that may also have been reprocessed by dust. Using the injection rate that we derived from our new data in §3.9 and assuming an adiabatic superbubble, we therefore obtained . Assuming that the outflow is no larger than the maximum observed velocity of 1050 km s-1 and that our reduced estimate of the KE in the superbubble is correct within a factor of 4, this condition is satisfied even for .
If radiative losses are important, the bubble may still conserve momentum. Then the observed injection rate dyne can be compared to that predicted from the starburst model of Elson, Fall, & Freeman (1989) dyne dyne. Again, a starburst suffices (in some cases just barely) for all values of .
Our data constrain only the ionized outflow. Entrained neutral and molecular material (Israel et al., 1998; Irwin & Sofue, 1992) and the wind reduce the acceptable value of for the ionized gas. If the higher space velocities of our Paper II model are favored over those in this paper, then a starburst wind will work only for very small values of
5 FUTURE PROSPECTS
5.1 Spectra of the Warm, Post-Shock Gas
Its large angular size is well resolved by current X-ray telescopes, so the superbubble in NGC 3079 offers excellent prospects to study confined hot gas in a galaxy-wind/ISM interaction. Both PTV and Ptak (1997) have modeled the PSPC spectrum obtained by ROSAT; Ptak also included ASCA data (no spatial resolution but higher spectral resolution). However, large contamination by the relatively brighter galaxy disk and halo made their models ambiguous. The Chandra X-ray Observatory (CXO) now greatly improves spatial resolution. Unfortunately, Strickland & Stevens (2000) have demonstrated by simulation that the superbubble dynamics are likely to remain poorly constrained because gas that emits soft X-rays has small filling factor compared to the shocked wind (which at K is too hot to see with present instruments).
However, CXO can distinguish between shocks and cooling gas at various T near the jet. As discussed in §4.2.2, hot gas likely clumps to the ″ resolution of CXO as it cools behind strong high-velocity (400 km s-1) shocks to 104 K. Regions with pre-shock density (in units of cm-3) would then be separated by up to the cooling distance of pc = arcsec, where is the shock velocity in units of 500 km s-1. The distance will be somewhat smaller because most of the shock is oblique, not normal.
5.2 Internal Properties of the Ionized Filaments
To better understand their dynamics, we must constrain the ionized column lengths, hence total masses, of the filaments. The dust calculation in §3.1 and thermal evaporation timescale estimated in §4.2.4 are useful first steps, but column lengths are more directly constrained with maps of emission-line fluxes. The velocity field of ionized gas associated with the jet must also be constrained. Integral-field spectrometers on 8-m-class telescopes can begin this work. Images of the filaments with higher spatial resolution may soon be possible with a laser-assisted, adaptive optics system on these telescopes (NGC 3079 does not have a natural guidestar). These images would further constrain and, together with constraints on the column length, can exclude decisively a starburst-driven wind on energetic grounds.
Mid-IR spectroscopy with SIRTF will be able to constrain the cutoffs of the IMF, and the spatial and temporal evolution of putative starburst activity in the nuclear region, as has been done with the ESA Infrared Space Observatory for M82 by Forster-Schreiber (2000). With photo- and shock-ionization models such spectra could establish if filaments are pressure confined, and whether they have sufficient dust load for efficient wind acceleration. With filament properties understood, the superbubble of NGC 3079 will become a laboratory to study the galaxy-wind driven processes thought to prevail at high-redshifts.
6 SUMMARY
We have analyzed VLA spectra and HST emission-line and I-band images of NGC 3079. Using the observed gas distribution and recombination fluxes at high spatial resolution, we have tightened constraints on the densities of ionized filaments that delineate the superbubble. The HST images and pattern of magnetic fields determined from radio polarization and rotation measures suggest independently that gas at the upper boundary is lofting out of the bubble in a vortex. Numerical simulations show that a substantial fraction of the space velocities of these filaments would then project along our sightline. We therefore reassess the velocity field across the bubble and reduce substantially previous estimates (including ours in Paper II) of the minimum outflow KE and momentum. We find that a bright, kinematically disturbed filament at the base of the superbubble and a narrow, straight plume of continuum light align with the putative VLBI-scale radio jet, extending the signature of the collimated component of this outflow to a projected radius of 250 pc. The rest of the superbubble is composed of four gaseous columns whose orientation perpendicular to the disk plane and strikingly similar appearances are not easily explained by precessing jets. Either starburst or AGN power sources remain viable on energetic grounds because of uncertainties in the flux of reprocessed infrared photons from the AGN. But either source will have more modest steady-state requirements based on our data and kinematical model.
References
- Baan & Irwin (1995) Baan, W. A., & Irwin, J. A. 1995, ApJ, 446, 602
- Beck et al. (1996) Beck, R., Brandenburg, A., Moss, D., Shukurov, A., & Sokoloff, D. 1996, ARA&A, 34, 155
- Braine et al. (1997) Braine, J., Guelin, M., Brouillet, N., Herpin, F., & Wielebinski, R. 1997, A&A, 326, 963
- Brandenburg et al. (1993) Brandenburg, A. et al., A&A, 271, 36
- Brandenburg, Moss, & Shukurov (1995) Brandenburg, A., Moss, D., & Shukurov, A. 1995, MNRAS, 276, 651
- Bregman (1995) Bregman, J. 1995, Schulman, P., & Tomisaka, K. 1995, ApJ, 439, 155
- Bridle & Perley (1984) Bridle, A., & Perley, R. 1984, ARA&A, 21, 319
- Burn (1966) Burn, B. J. 1996, MNRAS, 133, 68
- Cecil, Bland, & Tully (1990) Cecil, G., Bland, J., & Tully, R.B. 1990, ApJ, 355, 70
- Cowie & McKee (1977) Cowie, L. L., & McKee, C. F. 1977, ApJ, 211, 135
- de Bruyn (1977) de Bruyn, A. G. 1977, A&A, 58, 221
- de Vaucouleurs et al. (1991) de Vaucouleurs, G., de Vaucouleurs, A., Corwin, H. G. et al. 1991, Third Reference Catalogue of Brught Galaxies (New York: Springer-Verlag,)
- Dreher, Carilli, & Perley (1987) Dreher, J. W., Carilli, C. L., & Perley, R. A. 1987, ApJ, 316, 611
- Duric et al. (1983) Duric, N. et al. 1983, ApJ, 273, L11
- Duric & Seaquist (1988) Duric, N., & Seaquist, R. S. 1998, ApJ, 326, 574 (DS)
- Eales, Wynn-Williams, & Duncan (1989) Eales, S. A., Wynn-Williams, C. G., & Duncan, W. D. 1989, ApJ, 339, 859
- Elson, Fall, & Freeman (1989) Elson, R. A. W., Fall, S. M., & Freeman, K. 1989, ApJ, 336, 734
- Filippenko & Sargent (1992) Filippenko, A. V., & Sargent, W.L.W. 1992, AJ, 103, 28 (Paper I)
- Forbes et al. (1992) Forbes, D. A., Ward, M. J., De Poy, D. L., Boisson, C., & Smith, M. G. 1992, MNRAS, 254, 509
- Forbes et al. (2000) Forbes, D. A., Polehampton, E., Stevens, I. R., Brodie, J. P., & Ward, M. J. 2000, MNRAS, 312, 689
- Ford et al. (1986) Ford, H. C., Dahari, O., Jacoby, G. H., Crane, P. C., & Ciardullo, R. 1986, ApJ, 311, L7
- Forster-Schreiber (2000) Forster-Schreiber, N. M. 2000, in ASP Conference Series 195, Imaging the Universe in 3D: Astrophysics with Advanced Multi-Wavelength Imaging Devices, ed. J. Bland-Hawthorn & W. van Breugel (San Francisco: ASP), 179
- Freeman (1996) Freeman, K.C. 1996, in IAU Symposium 169, Unsolved Problems in the Milky Way, ed. L. Blitz & P. Teuben (Dordrecht: Kluwer), 645
- Hawarden et al. (1995) Hawarden, T. G., Israel, F.P., Geballe, T. R., & Wade, R. 1995, MNRAS, 276, 1197
- Heckman, Armus, & Miley (1990) Heckman, T. M., Armus, L., & Miley, G. K. 1990, ApJ, 74, 833
- Heckman (1996) Heckman, T. M. 1996, ApJ, 457,
- Henkel et al. (1984) Henkel, C., Güsten, R., Downes, D., Thum, C., Wilson, T. L., & Biermann. P. 1984, A&A, 141, L1
- Howk & Savage (1997) Howk, J. C., & Savage, B. D. 1997, AJ, 114, 2463
- Hummel, van Gorkum, & Kotyani (1983) Hummel, E., van Gorkum, J. H., & Kotyani, C. G. 1983, ApJ, 267, L5
- Irwin & Seaquist (1988) Irwin, J. A., & Seaquist, E. R. 1988, ApJ, 335, 658
- Irwin & Seaquist (1990) — 1990, ApJ, 353, 469
- Irwin & Seaquist (1991) — 1991, ApJ, 371, 111
- Irwin & Sofue (1992) Irwin, J. A., & Sofue, Y. 1992, ApJ, 313, L75
- Israel et al. (1998) Israel, F. P., van der Werf, P. P., Hawarden, T. G., & Aspin, C. 1998, A&A, 336, 433
- Kenney & Yale (2000) Kenney, J. D. P., & Yale, E. E. 2000, ApJ, in press
- Kenney et al. (1995) Kenney, J. D. P., Rubin, V. A., Planesas, P. & Young, J. S. 1995, ApJ, 438, 135
- Klein, Wielebinski, & Morsi (1988) Klein, U., Wielebinski, R., & Morsi, H. W. 1988, A&A, 190, 41
- Krolik, McKee, & Tarter (1981) Krolik, J. McKee, C. F., & Tarter, C. B. 1981, ApJ, 249, 422
- Meaburn et al. (1998) Meaburn, J., Frenandez, B. R., Holloway, A. J., Pedlar, A., Mundell, C. G., & Geballe, T. R. 1998, MNRAS, 295, L45
- Mineshige, Shibata, & Shapiro (1993) Mineshige, S., Shibata, K., & Shapiro, P. 1993, ApJ, 409, 663
- Pedlar et al. (1996) Pedlar, A., Mundell, C. G., Gallimore, J.F., Baum, S. A., & O’Dea, C. P. 1996, Vistas. Astron., 40, 91
- Pietsch, Trinchieri, & Vogler (1998) Pietsch, W., Trinchieri, G., & Vogler, A. 1998, A&A, 340, 351 (PTV)
- Ptak (1997) Ptak, A. 1997, Ph.D. dissertation, U. of Maryland at College Park
- Rossi et al. (2000) Rossi, P., Capetti, A., Bodo, G., Massaglia, S., & Ferrari, A. 2000, A&A, 356, 73
- Sawada-Satoh et al. (2000) Sawada-Satoh, S. et al. 2000, PASJ, 52, 421
- Schiano (1986) Schiano, A. V. R. 1986, ApJ, 302, 81
- Schiano (1985) — 1985, ApJ, 299, 24
- Shopbell & Bland-Hawthorn (1998) Shopbell, P., & Bland-Hawthorn, J. 1998, ApJ, 493, 129
- Sofue & Irwin (1992) Sofue, Y., & Irwin, J.A. 1992, PASJ, 44, 353
- Sofue et al (2000) Sofue, Y. et al. 2000, astro-ph/0010597
- Sokoloff, & Shukurov (1990) Sokoloff, D. & Shukurov, A. 1990, Nature, 347, 51
- Sokoloff et al. (1998) Sokoloff, D. et al. 1998, MNRAS, 299, 189
- Strickland & Stevens (2000) Strickland, D.K., & Stevens, I.R. 2000, MNRAS, 314, 511
- Stone & Norman (1992) Stone, J. M., & Norman, M. L. 1992, ApJ, 390, L17
- Suchkov et al. (1994) Suchkov, A. A., Balsara, D. S., Heckman, T. M., & Leitherer, C. 1994, ApJ, 430, 511
- Suchkov et al. (1996) Suchkov, A. A., Berman, V. G., Heckman, T. M., & Blasara, D. S. 1996, ApJ, 463, 528
- Trotter et al. (1998) Trotter, A. S., Greenhill, L. J., Moran, J. M., Reid, M. J., Irwin, J. A., & Lo, K-Y. 1998, ApJ, 495, 470
- Veilleux et al. (1999) Veilleux, S., Bland-Hawthorn, J., Cecil, G., Tully, R. B., & Miller, S. 1999, AJ, 118, 2108 (Paper IV)
- Veilleux, Cecil, & Bland-Hawthorn (1995) Veilleux, S., Cecil, G., & Bland-Hawthorn, J. 1995, ApJ, 445, 152 (Paper III)
- Veilleux et al. (1994) Veilleux, S., Cecil, G., Bland-Hawthorn, J., Tully, R. B., Filippenko, A. V., & Sargent, W. L. W. 1994, ApJ, 433, 48 (Paper II)
- Weaver et al. (1977) Weaver, R., McCray, R., Castor, J., Shapiro, P., & Moore, R. 1977, ApJ, 218, 37
- Wehrle & Morris (1987) Wehrle, A. E. & Morris, M. 1987, ApJ, 313, L43
- Young et al. (1989) Young, J. S., Xie, S., Kenney, J. D. P., & Rice, W. L. 1989, ApJS, 70, 699
- Yusaf-Zadeh, & Morris (1987) Yusaf-Zadeh, F. & Morris, M. 1987, ApJ, 320, 545
- Zel’dovich, Ruzmaikin, & Sokoloff (1983) Zel’dovich, Ya. B., Ruzmaikin, A. A., & Sokoloff, D. D. 1983, Magnetic Fields in Astrophysics (Gordon & Breach: New York)


| Parameter | Regionaa“total” = value for entire galaxy, the units of most other entries in the column are diameters in arc-seconds. | Flux | Luminosity | Reference |
|---|---|---|---|---|
| () | () | |||
| total | 10.45 mag | 1 | ||
| X-ray | core | 2 | ||
| X-ray | lobes | 2 | ||
| X-ray | 3 disk sources | each | 2 | |
| 12 m | total | 2.81 Jy | 3 | |
| 25 m | total | 3.54 Jy | 3 | |
| 60 m | total | 52.8 Jy | 3 | |
| 100 m | total | 96.5.8 Jy | 3 | |
| 40 – 122 m | total | 3 | ||
| 350 m | 10.01.9 Jy | 4 | ||
| 450 m | 2.10.9 Jy | 4 | ||
| 800 m | 53 | 0.920.1 Jy | 5 | |
| 1220 m | total | 0.5 Jy | 6 | |
| 25 m | 11 | 1.5 Jy | 6 | |
| 60 m | 11 | 22.3 Jy | 6 | |
| 100 m | 11 | 40.8 Jy | 6 | |
| 800 m | 11 | 0.35 Jy | 6 | |
| 1220 m | 11 | 0.03 Jy | 6 | |
| CO(1-0) | 21 | 231 K km s-1 | 6 | |
| CO(2-1) | 11 | 306 K km s-1 | 6 | |
| H I | total | 7.1 M☉ | 7 | |
| distance | Mpc | 8 | ||
| pos. angle | 169 | 8 | ||
| inclination | 82 | 8 |
| WFPC2 | Very Large Array | Time on Source at aaTwo 50 Mhz bands were used around each central frequency. The flux standards were 3C 48 and 3C 286 (Dreher, Carilli, & Perley, 1987). | ||||
|---|---|---|---|---|---|---|
| Filter | Source bbOur HST exposures were made in November 1998; archive exposures were made in March 1999 and were reprocessed with on-the-fly recalibrations in November 2000. | Exposures cc“+” indicates the exposures at two dithering points. | Configuration | Date | 4.5 GHz | 8.06 GHz |
| (s) | (s) | (s) | ||||
| F814W | 11/98 | 400, 400 | B | 1/13/92 | 6660 | 6915 |
| Archive | 70, 70 | C | 12/9/90 | 13110 | 14670 | |
| F658N | 11/98 | 1400+2700 | ||||
| 11/98 | 1700+2700 | |||||
| Archive | 400, 400, 400 | |||||
| F547M ddThis image has low signal/noise ratio on the superbubble, so was not scrutinized. As of November 2000 the public HST archive also contained a STIS UV exposure of 1320 s at central wavelength 147 nm (P.I. D. Calzetti). It spans the base of the superbubble and nucleus, but shows only a few bright H II regions W of the nucleus. | Archive | 160, 160 | ||||
| ID | F | Space VelocityaaSpace velocity from model in this paper, and paper II, respectively. Velocities were assigned from radial velocities that were mapped from the ground at 1 resolution (see Paper II). | L | Volume bb indicates that WFPC2 did not resolve one or both of the cloud dimensions. The value tabulated was established by fitting the intensity profiles of the brightest filaments, or estimated by eye for the rest of the cloud population. | ccIonized gas density in units shown, mean value and [upper-lower] range shown. | Mass ddIonized gas mass in units shown, mean value and [upper-lower] range shown. | KE eeUsing space velocities from this paper, and paper II, respectively. | Momentum eeUsing space velocities from this paper, and paper II, respectively. |
|---|---|---|---|---|---|---|---|---|
| (erg s-1 cm-2) | (km s-1) | (erg s-1) | (pc-3) | ( cm-3) | ( M☉) | ( erg) | ( dyne s) | |
| 1 | 0.15 | 75,500 | 0.54 | 2999 | 14.0 [10-22] | 1.2 [0.7-1.7] | 0.07, 3.13 | 0.02, 0.12 |
| 2 | 2.59 | 200,500 | 9.46 | 40223 | 15.9 [12-25] | 18.8 [12.3-25.5] | 7.46, 46.60 | 0.75, 1.87 |
| 3 ffThis is the main filament associated with the jet. Flux listed is sum of low- and high-velocity line components, see §3.10. Velocity is the flux-averaged value. | 9.6 | 125,500 | 32 | 372146 | 9.6 [5-14] | 150 [100-300] | 11.6, 1850 | 1.8, 7.4 |
| 4 | 0.25 | -200,-500 | 0.915 | 5565 | 13.3 [10-20] | 2.2 [1.4-2.0] | 0.87, 5.45 | 0.09, 0.22 |
| 6 | 4.56 | 125,500 | 16.83 | 82576 | 14.9 [11-23] | 35.8 [22.0-48.4] | 5.56, 89.02 | 0.89, 3.56 |
| 7 | 2.07 | -200,-500 | 7.56 | 26102 | 17.7 [14-27] | 13.5 [8.8-18.5] | 5.36, 33.51 | 0.54, 1.34 |
| 9 | 1.72 | -200,-500 | 6.28 | 22677 | 17.3 [14-27] | 11.4 [7.0-15.8] | 4.55, 28.45 | 0.46, 1.14 |
| 11 | 15.1 | -350,-500 | 56.9 | 381657 | 12.5 [9-19] | 139.4 [88.0-193.7] | 169.88,346.69 | 9.71, 13.87 |
| 12 | 1.18 | -200,-500 | 4.45 | 43214 | 10.3 [8-16] | 13.1 [8.8-18.5] | 5.22, 32.63 | 0.52, 1.30 |
| 13 | 2.97 | -250,-750 | 11.23 | 44074 | 16.4 [14-26] | 21.0 [15.0-29.1] | 13.08,117.74 | 1.05, 3.14 |
| 15 | 3.58 | 175,750 | 13.8 | 94132 | 12.3 [9-19] | 33.8 [22.0-48.4] | 10.30,189.18 | 1.18, 5.06 |
| 16 | 1.08 | -350,-750 | 4.18 | 28241 | 12.3 [10-19] | 10.2 [7.0-14.1] | 12.44, 57.12 | 0.71, 1.53 |
| 19 | 1.03 | -350,-750 | 3.96 | 19251 | 14.5 [11-23] | 8.2 [5.3-11.4] | 9.97, 45.80 | 0.57, 1.23 |
| 20 | 0.98 | -200,-750 | 3.77 | 34232 | 10.7 [8-17] | 10.7 [7.0-15.0] | 4.23, 59.55 | 0.42, 1.58 |
| 23 | 1.00 | 0,750 | 3.87 | 30806 | 11.4 [9-18] | 10.2 [7.0-14.1] | 0.00, 0.00 | 0.00, 0.00 |
| 24 | 2.03 | -250,-750 | 7.81 | 44501 | 13.4 [10-20] | 17.4 [12.3-24.6] | 10.84, 97.53 | 0.87, 2.61 |
| 25 | 0.27 | -350,-1000 | 1.05 | 8556 | 11.2 [9-18] | 2.8 [1.9-4.0] | 3.43, 28.03 | 0.19, 0.55 |
| 26 | 1.23 | -250,-1000 | 5.10 | 99270 | 7.0 [6-11] | 20.3 [13.2-29.9] | 12.64,202.27 | 1.01, 4.05 |
| 28 | 1.60 | 275,1000 | 6.63 | 57761 | 10.5 [8-17] | 17.7 [13.2-24.6] | 13.31,176.01 | 0.97, 3.52 |
| 33 | 1.18 | -25,-1000 | 4.89 | 59474 | 8.9 [7-15] | 15.4 [10.6-22.0] | 0.10,154.94 | 0.08, 3.17 |
| 34 | 1.69 | -100,-1000 | 6.995 | 79585 | 9.2 [7-15] | 21.3 [15.0-29.9] | 2.12,212.16 | 0.42, 4.23 |
| 36 | 0.39 | -250,-1000 | 1.60 | 16686 | 9.5 [8-16] | 4.7 [3.5-7.0] | 2.90, 46.34 | 0.23, 0.92 |
| 37 | 2.38 | -250,-1000 | 9.80 | 162161 | 7.6 [6-12] | 36.1 [26.4-52.8] | 22.43,358.90 | 1.80, 7.18 |
| 38 | 0.47 | -50,-1000 | 1.96 | 34658 | 7.4 [6-12] | 7.5 [5.3-10.6] | 0.18, 73.95 | 0.08, 1.58 |
| 40 | 0.15 | 300,1000 | 0.63 | 6843 | 9.3 [7-15] | 1.8 [1.3-2.6] | 1.66, 18.39 | 0.11, 0.38 |
| 41 | 0.44 | -250,-1000 | 1.81 | 62899 | 5.2 [4-9] | 9.7 [6.2-14.1] | 6.02, 96.34 | 0.48, 1.94 |
| 42 | 1.23 | 0,1000 | 5.09 | 62039 | 8.9 [7-15] | 16.1 [11.4-22.9] | 0.00, 0.00 | 0.00, 0.00 |
| 43 | 0.38 | 375,1000 | 1.55 | 16259 | 9.5 [7-16] | 4.6 [3.1-6.2] | 6.40, 45.51 | 0.34, 0.92 |
| 44 | 0.08 | 400,1000 | 0.34 | 3426 | 9.8 [8-16] | 1.0 [0.7-14.1] | 1.54, 9.63 | 0.08, 0.20 |
| 45 | 0.87 | -150,-1000 | 3.59 | 90280 | 6.1 [5-10] | 16.3 [10.6-23.8] | 3.64,161.98 | 0.48, 3.23 |
| 46 | 0.59 | 100,1000 | 2.45 | 29520 | 9.0 [7-15] | 7.7 [5.3-11.4] | 0.77, 77.47 | 0.16, 1.58 |
| 47 | 0.34 | -250,-1250 | 1.395 | 41935 | 5.7 [5-9] | 7.0 [4.8-10.6] | 4.32,108.06 | 0.34, 1.72 |
| 48 | 0.22 | 0.89 | 27600 | 5.6 [4-9] | 4.5 [3-6.5] | |||
| 49 | 1.90 | -125,-1250 | 7.84 | 128789 | 7.6 [6-12] | 28.8 [20.2-40.5] | 4.47,447.21 | 0.71, 7.13 |
| 50 | 1.13 | -100,-1250 | 4.656 | 109105 | 6.4 [5-10] | 20.4 [14.1-29.1] | 2.03,317.75 | 0.40, 5.06 |
| 51 | 2.54 | 500,1250 | 10.47 | 151040 | 8.2 [7-14] | 36.0 [25.5-49.3] | 89.52,559.51 | 3.58, 8.96 |
| 52 | 0.70 | -375,-1250 | 2.89 | 32945 | 9.2 [7-15] | 8.8 [5.3-13.2] | 12.32,136.84 | 0.66, 2.20 |
| 53 | 0.63 | 2.60 | 375970 | 2.6 [2-4.5] | 28.3 [20-40] | |||
| 55 | 0.30 | 1.25 | 34230 | 5.9 [5-10] | 5.9 [4-8.5] | |||
| 58 | 0.09 | 250,1250 | 0.377 | 19685 | 4.3 [3-7] | 2.5 [1.8-3.5] | 1.53, 38.29 | 0.12, 0.62 |
| 60 | 0.27 | -250,-1250 | 1.11 | 17546 | 7.7 [6-12] | 4.0 [2.6-5.7] | 2.46, 61.62 | 0.19, 0.97 |
| 61 | 1.38 | 150,1250 | 5.76 | 127077 | 6.6 [5-11] | 24.4 [16.7-35.2] | 5.46,379.04 | 0.73, 6.09 |
| 66 | 0.20 | -375,-1250 | 0.796 | 50491 | 4.0 [3-6] | 5.8 [3.5-8.4] | 8.13, 90.28 | 0.43, 1.44 |
| 67 | 0.42 | -400,-1250 | 1.685 | 42362 | 6.2 [5-10] | 7.7 [5.3-11.4] | 12.32,120.36 | 0.62, 1.93 |
| 70 | 1.04 | -550,-1250 | 4.19 | 105253 | 6.2 [5-10] | 19.3 [13.2-27.3] | 58.00,299.57 | 2.11, 4.80 |
| 71 | 0.08 | -375,-1250 | 0.307 | 22250 | 3.6 [3-6] | 2.4 [1.3-3.5] | 3.33, 36.97 | 0.18, 0.59 |
| 73 | 0.20 | 125,1250 | 0.822 | 31233 | 5.1 [4-8] | 4.7 [2.6-7.0] | 0.72, 72.19 | 0.11, 1.14 |
| 75 | 0.06 | 0.233 | 26500 | 2.9 [2.5-5] | 2.3 [1.6-3.3] | |||
| 76 | 0.13 | 0.519 | 13250 | 6.2 [5-10] | 2.4 [1.6-3.3] | |||
| 77 | 2.07 | -100,-1250 | 8.16 | 200671 | 6.4 [5-10] | 37.2 [26.4-52.8] | 3.70,577.72 | 0.74, 9.24 |
| 78 | 0.05 | 0.20 | 9390 | 4.6 [3.5-7.5] | 1.3 [0.8-1.8] | |||
| 79 | 0.14 | 0.553 | 35330 | 3.9 [3-6.5] | 4.1 [2.5-6] | |||
| 80 | 0.19 | -400,-1500 | 0.773 | 43214 | 4.2 [3-7] | 5.3 [3.5-7.9] | 8.41,118.23 | 0.42, 1.58 |
| 82 | 0.78 | 200,1500 | 2.768 | 47066 | 8.1 [6-12] | 11.1 [7.0-15.0] | 4.41,248.09 | 0.44, 3.30 |
| 83 | 0.78 | -125,-1500 | 2.778 | 103548 | 5.5 [4-9] | 16.6 [10.6-22.0] | 2.57,370.17 | 0.41, 4.97 |
| 84 | 1.54 | 200,1500 | 5.504 | 91993 | 8.2 [6-12] | 21.9 [13.2-29.1] | 8.72,490.73 | 0.87, 6.54 |
| 89 | 0.09 | 0.313 | 20430 | 4.1 [3-6.5] | 2.5 [1.7-3.5] | |||
| 90 | 0.11 | 0.403 | 21530 | 4.6 [3-7] | 2.9 [2-4] | |||
| 92 | 0.85 | -650,-1500 | 3.02 | 69742 | 6.9 [5-10] | 14.2 [8.8-19.4] | 59.56,317.16 | 1.83, 4.23 |
| 93 | 0.06 | 150,1500 | 0.227 | 9416 | 5.2 [3-8] | 1.4 [0.9-1.9] | 0.32, 31.69 | 0.04, 0.44 |
| 94 | 0.65 | 550,1750 | 2.306 | 44501 | 7.6 [6-11] | 9.9 [6.2-13.2] | 29.66,300.26 | 1.08, 3.45 |
| 96 | 0.12 | 0.432 | 29820 | 4.0 [3-6] | 3.5 [2.4-4.5] | |||
| 97 | 0.14 | 0.513 | 32020 | 4.2 [3-6.5] | 3.9 [2.5-5.5] | |||
| 98 | 0.14 | 0.499 | 33130 | 4.1 [3-6] | 4.0 [2.5-5.5] | |||
| 99 | 0.04 | -425,-2000 | 0.154 | 12834 | 3.6 [3-6] | 1.4 [0.9-1.8] | 2.53, 55.95 | 0.12, 0.58 |
| 101 | 0.37 | -550,-2000 | 1.327 | 28667 | 7.2 [6-11] | 6.0 [3.5-7.9] | 18.01,238.17 | 0.65, 2.37 |
| 103 | 1.06 | 225,2000 | 3.779 | 92845 | 6.7 [5-10] | 18.2 [10.6-24.6] | 9.17,724.79 | 0.82, 7.28 |
| 104 | 0.12 | 250,2000 | 0.412 | 29954 | 3.9 [3-6] | 3.4 [2.2-4.4] | 2.13,136.35 | 0.17, 1.34 |
| 105 | 0.05 | 0.183 | 18770 | 3.3 [2.5-5] | 1.8 [1.2-2.3] | |||
| 106 | 0.12 | -625,-2000 | 0.438 | 11121 | 6.6 [5-10] | 2.1 [1.3-2.9] | 8.20, 84.02 | 0.26, 0.85 |
| 107 | 0.04 | 0.154 | 13800 | 3.5 [2.5-5.5] | 1.4 [0.9-1.9] | |||
| 109 | 0.18 | -500,-2000 | 0.631 | 19685 | 6.0 [5-9] | 3.4 [2.2-4.4] | 8.54,136.63 | 0.34, 1.37 |
| 110 | 0.10 | -900,-2000 | 0.370 | 11121 | 6.0 [5-9] | 1.9 [1.3-2.6] | 15.60, 77.04 | 0.34, 0.76 |
| 112 | 0.31 | -625,-2000 | 1.09 | 39789 | 5.6 [4-9] | 6.4 [3.5-8.8] | 24.97,255.66 | 0.80, 2.56 |
| 114 | 0.03 | 0.117 | 17120 | 2.7 [2-4.5] | 1.4 [0.9-1.8] | |||
| 116 | 0.001 | 0.004 | 7730 | 0.8 [0.5-1.2] | 0.2 [0.1-0.25] | |||
| 117 | 1.36 | -900,-2000 | 4.86 | 117234 | 6.8 [5-10] | 23.2 [15.0-29.1] | 187.21,924.51 | 4.16, 9.25 |
| 119 | 0.07 | -50,-2000 | 0.237 | 13268 | 4.4 [3-7] | 1.8 [1.1-2.3] | 0.04, 70.43 | 0.02, 0.70 |
| 120 | 0.01 | 0.038 | 26500 | 1.3 [0.9-1.9] | 1.0 [0.6-1.3] | |||
| 123 | 0.16 | -425,-2000 | 0.585 | 29520 | 4.7 [3-7] | 4.0 [2.6-5.3] | 7.27,161.03 | 0.34, 1.62 |
| 125 | 1.41 | -250,-2250 | 5.03 | 78298 | 8.4 [6-14] | 19.4 [12.3-25.5] | 12.03,974.77 | 0.96, 8.64 |
| 129 | 0.37 | -425,-2250 | 1.33 | 87715 | 4.1 [3-6] | 10.6 [5.3-14.1] | 18.98,531.97 | 0.89, 4.71 |
| 130 | 0.005 | 0.017 | 18220 | 1.0 [0.7-1.5] | 0.5 [0.3-0.7] | |||
| 131 | 0.24 | -175,-2250 | 0.867 | 62899 | 3.9 [3-6] | 7.2 [4.4-9.7] | 2.20,363.81 | 0.26, 3.28 |
| 132 | 0.50 | -800,-2250 | 1.79 | 37223 | 7.3 [6-11] | 7.9 [5.3-10.6] | 50.43,398.88 | 1.26, 3.54 |
| 133 | 0.12 | -100,-2250 | 0.440 | 20964 | 4.8 [3-7] | 3.0 [1.8-4.0] | 0.30,151.53 | 0.06, 1.39 |
| 134 | 0.58 | -700,-2250 | 2.076 | 75733 | 5.6 [4-9] | 12.2 [7.0-15.8] | 59.63,616.12 | 1.71, 5.49 |
| 136 | 0.02 | 0.088 | 142440 | 0.8 [0.6-1.3] | 3.5 [2-4.5] | |||
| 137 | 0.10 | -800,-2250 | 0.368 | 18399 | 4.7 [3-8] | 2.6 [1.6-3.3] | 16.25,128.55 | 0.40, 1.14 |
| 138 | 0.02 | 0.077 | 13800 | 2.5 [1.9-3.6] | 1.0 [0.6-1.4] | |||
| 141 | 0.13 | -275,-2250 | 0.459 | 50491 | 3.2 [2-5] | 4.7 [2.6-6.2] | 3.51,235.14 | 0.26, 2.09 |
| 142 | 0.19 | -250,-2250 | 0.688 | 20964 | 6.0 [5-9] | 3.7 [2.5-4.8] | 2.30,186.11 | 0.18, 1.66 |
| 143 | 1.08 | -850,-2250 | 3.87 | 65891 | 8.1 [6-12] | 15.6 [10.6-20.2] | 111.96,784.51 | 2.63, 6.97 |
| 144 | 0.09 | 0.303 | 27050 | 3.5 [2.5-5.5] | 2.8 [2-3.5] | |||
| 145 | 0.03 | -200,-2250 | 0.099 | 20964 | 2.3 [2-3] | 1.4 [0.9-1.9] | 0.56, 71.31 | 0.05, 0.59 |
| 149 | 0.03 | 0.094 | 38090 | 1.7 [1.3-2.5] | 1.8 [1.2-2.5] | |||
| 150 | 0.14 | -500,-2250 | 0.515 | 24816 | 4.8 [3-7] | 3.5 [2.2-4.8] | 8.75,177.20 | 0.35, 1.58 |
| 151 | 1.84 | -850,-2250 | 6.56 | 101835 | 8.4 [6-14] | 25.2 [16.7-32.6] | 180.91,1267.6 | 4.27, 11.29 |
| 152 | 0.02 | -350,-2250 | 0.081 | 6417 | 3.7 [3-6] | 0.7 [0.4-1.0] | 0.85, 35.29 | 0.06, 0.37 |
| 153 | 1.47 | 700,2250 | 5.259 | 204523 | 5.3 [3-8] | 32.0 [17.6-44.0] | 155.72,1608.9 | 4.45, 14.29 |
| 156 | 0.12 | -750,-2250 | 0.443 | 12408 | 6.2 [5-10] | 2.3 [1.4-3.1] | 12.80,115.20 | 0.34, 1.03 |
| 158 | 0.09 | -750,-2250 | 0.330 | 15407 | 4.9 [4-7] | 2.2 [1.4-2.9] | 12.32,110.84 | 0.33, 0.98 |
| 159 | 0.53 | -700,-2250 | 1.90 | 73980 | 5.3 [4-8] | 11.6 [7-16] | ||
| 160 | 0.04 | -750,-2500 | 0.158 | 8130 | 4.7 [3-7] | 1.1 [0.7-1.5] | 6.40, 71.11 | 0.17, 0.56 |
| 161 | 0.004 | 0.015 | 1100 | 3.9 [3-6] | 0.1 [0.1-0.2] | |||
| 163 | 0.198 | -450,-2500 | 0.706 | 45779 | 4.1 [3-6] | 5.5 [3.5-7.0] | 11.17,344.80 | 0.49, 2.74 |
| 166 | 0.271 | -250,-2500 | 0.966 | 62899 | 4.1 [3-6] | 7.6 [4.4-10.6] | 4.71,470.98 | 0.38, 3.79 |
| 167 | 2.527 | -850,-2500 | 9.02 | 117661 | 9.2 [7-14] | 31.7 [17.6-44.0] | 227.72,1969.9 | 5.36, 15.77 |
| 169 | 0.01 | 0.035 | 23740 | 1.3 [1-2] | 0.9 [0.6-1.2] | |||
| 173 | 0.089 | -750,-2500 | 0.316 | 26102 | 3.6 [3-6] | 2.8 [0.5-1.1] | 15.76,175.09 | 0.42, 1.41 |
| 174 | 0.0003 | 0.001 | 13250 | 0.3 [0.2-0.45] | 0.1 [0.1-0.2] | |||
| 179 | 0.089 | -400,-2500 | 0.310 | 29094 | 3.4 [3-5] | 2.9 [2.2-3.5] | 4.62,180.54 | 0.23, 1.43 |
| 180 | 0.027 | -275,-2500 | 0.096 | 36369 | 1.7 [1-3] | 1.8 [1.3-2.6] | 1.39,114.95 | 0.11, 0.96 |
| 181 | 0.0007 | 0.003 | 13250 | 0.5 [0.4-0.8] | 0.2 [0.1-0.2] | |||
| 184 | 0.18 | -750,-2750 | 0.656 | 124938 | 2.4 [1.9-4] | 8.8 [5.3-12.3] | 49.25,662.09 | 1.32, 4.84 |
| 186 | 0.031 | -600,-2750 | 0.111 | 9843 | 3.5 [3-6] | 1.1 [0.6-1.4] | 3.79, 79.52 | 0.12, 0.56 |
| 188 | 0.12 | 0.427 | 17120 | 5.3 [4-8] | 2.6 [1.5-4] | |||
| 189 | 0.01 | -500,-2750 | 0.037 | 24389 | 1.2 [1-2] | 0.9 [0.5-1.2] | 2.19, 66.31 | 0.09, 0.48 |
| 190 | 0.0001 | -250,-2750 | 0.001 | 11548 | 0.1 [0-0.2] | 0.1 [0.0-0.2] | 0.05, 6.39 | 0.01, 0.10 |
| 192 | 0.0008 | -750,-2750 | 0.003 | 38084 | 0.3 [0.1-0.4] | 0.4 [0.2-0.4] | 1.97, 26.51 | 0.05, 0.19 |
| 194 | 0.068 | -750,-2750 | 0.241 | 10269 | 5.1 [3-8] | 1.5 [1.1-2.2] | 8.37,112.56 | 0.22, 0.81 |
| 201 | 0.111 | -750,-2750 | 0.395 | 30806 | 3.7 [3-6] | 3.4 [1.8-5.3] | 19.21,258.25 | 0.51, 1.87 |
| 203 | 0.0070 | 0.025 | 22080 | 1.1 [0.8-1.8] | 0.7 [0.5-1] | |||
| 205 | 0.0165 | -400,-2750 | 0.059 | 18833 | 1.8 [1-3] | 1.1 [0.9-1.8] | 1.68, 79.47 | 0.09, 0.61 |
| 206 | 0.068 | -700,-2750 | 0.241 | 10269 | 5.1 [3-8] | 1.5 [1.1-2.2] | 7.29,112.50 | 0.21, 0.83 |
| 207 | 0.021 | -500,-2750 | 0.076 | 7277 | 3.4 [2-5] | 0.7 [0.4-1.3] | 1.75, 52.99 | 0.07, 0.39 |
| 208 | 0.0007 | -400,-3000 | 0.002 | 17112 | 0.5 [0-1] | 0.2 [0.1-0.2] | 0.28, 15.85 | 0.02, 0.13 |
| 209 | 0.0007 | 0.003 | 12150 | 0.5 [0.4-0.8] | 0.2 [0.14-0.28] | |||
| 210 | 0.027 | -600,-3000 | 0.097 | 7277 | 3.9 [3-6] | 0.8 [0.5-1.1] | 2.83, 70.87 | 0.10, 0.48 |
| 211 | 0.111 | -600,-3000 | 0.395 | 30806 | 3.7 [3-6] | 3.4 [1.8-5.3] | 12.29,307.24 | 0.41, 2.07 |
| 213 | 0.086 | -750,-3000 | 0.307 | 148475 | 1.5 [1-2] | 6.6 [4.4-8.8] | 36.94,591.03 | 0.99, 3.94 |
| 214 | 0.071 | -500,-3250 | 0.251 | 7704 | 6.0 [5-9] | 1.3 [0.9-2.6] | 3.28,138.74 | 0.13, 0.86 |
| 216 | 0.010 | -500,-3250 | 0.036 | 11982 | 1.8 [1-3] | 0.6 [0.3-1.1] | 1.53, 64.72 | 0.06, 0.40 |
| 217 | 0.114 | -500,-3250 | 0.406 | 24816 | 4.3 [3-6] | 3.1 [1.8-4.4] | 7.66,323.59 | 0.31, 2.00 |
| 219 | 0.005 | 0.019 | 10490 | 1.4 [1.1-2.4] | 0.4 [0.2-0.8] | |||
| 220 | 0.001 | 0.004 | 9390 | 0.7 [0.5-1.1] | 0.2 [0.1-0.4] | |||
| 223 | 0.002 | 0.008 | 7730 | 1.1 [0.8-1.6] | 0.2 [0.1-0.4] | |||
| 224 | 0.0001 | -400,-3500 | 0.001 | 27381 | 0.1 [0-0] | 0.1 [0.0-0.2] | 0.14, 10.78 | 0.01, 0.08 |
| 225 | 0.013 | -450,-3500 | 0.047 | 24816 | 1.5 [1-2] | 1.1 [0.5-2.1] | 2.13,128.88 | 0.10, 0.75 |
| 226 | 0.0001 | -450,-3500 | 0.001 | 11548 | 0.1 [0-0.2] | 0.1 [0.0-0.2] | 0.18, 10.65 | 0.01, 0.07 |
| 227 | 0.0016 | -400,-3500 | 0.006 | 15407 | 0.7 [0-1] | 0.3 [0.1-0.5] | 0.42, 32.35 | 0.02, 0.15 |
| 228 | 0.0001 | -400,-3500 | 0.001 | 11548 | 0.1 [0-0.2] | 0.1 [0.0-0.2] | 0.14, 10.78 | 0.01, 0.08 |
| 229 | 0.004 | -400,-3500 | 0.015 | 18825 | 0.9 [0.7-1] | 0.5 [0.3-1.1] | 0.84, 64.03 | 0.04, 0.39 |
| 232 | 0.0001 | -400,-3500 | 0.000 | 6417 | 0.2 [0-0.4] | 0.1 [0.0-0.2] | 0.14, 10.78 | 0.01, 0.08 |
| 233 | 0.0002 | 0.001 | 18770 | 0.2 [0.1-0.4] | 0.1 [0.1-0.4] |
| Parameter | Value | Note |
|---|---|---|
| [N II]6548+6583/H | Typical of AGN | |
| Velocity FWHM | 440 km s-1 | Corrected for instrumental resolution |
| H emission | ergs s-1 cm-2 arcsec-2 | 10% of superbubble H flux |
| Ionized mass | M⊙ | |
| KE | ergs | |
| H recombination time | yrs |
| Parameter | Expression |
|---|---|
| Timescale from velocities | yr |
| Adiabatic expansion timescale | kpc |
| of a wind-inflated bubble | km s-1 |
| is | yr |
| KE rate into outflow | ergs s-1 |
| Wind mechanical luminosity | ergs s-1 |
| Input momentum rate | dyne |
| Wind+ionized entrainment mass | yr-1 |
Note. — is the kinetic/mechanical luminosity of the wind in units of ergs s-1, is the IR luminosity of the starburst in units of , is the fraction of this from the nucleus, and is the fraction of the bolometric luminosity of the nuclear region that is radiated by stars assuming a Salpeter initial mass function (IMF) that extends to .