Evidence for solar-like oscillations in beta Hydri
Abstract
We have made a clear detection of excess power, providing strong evidence for solar-like oscillations in the G2 subgiant Hyi. We observed this star over five nights with the UCLES echelle spectrograph on the 3.9-m Anglo-Australian Telescope, using an iodine absorption cell as a velocity reference. The time series of 1196 velocity measurements shows an rms scatter of 3.30 m s-1, and the mean noise level in the amplitude spectrum at frequencies above 0.5 mHz is 0.11 m s-1. We see a clear excess of power centred at 1.0 mHz, with peak amplitudes of about 0.5 m s-1, in agreement with expectations for this star. Fitting the asymptotic relation to the power spectrum indicates the most likely value for the large separation is 56.2 Hz, also in good agreement with the known properties of Hyi.
1 Introduction
The search for solar-like oscillations in other stars has been long and difficult. Observers have mostly concentrated on three stars: Procyon ( CMi), Boo and Cen A. Reviews of those efforts have been given by Brown & Gilliland (1994), Kjeldsen & Bedding (1995, hereafter KB95), Heasley et al. (1996) and Bedding & Kjeldsen (1998). More recently, Kjeldsen et al. (1999) measured Balmer-line equivalent widths in Cen A and set an upper limit on oscillation amplitudes of only 1.4 times solar, with tentative evidence for p-mode structure. More recently still, measurements of velocity variations in Procyon by Martic et al. (1999, see also , ), showed very good evidence for oscillations with peak amplitudes of about 0.5 m s-1and frequencies centred at about 1 mHz.
Here, we report the clear detection of excess power, providing evidence for oscillations in the G2 subgiant Hydri (HR 98, , G2 IV). This star is the closest G-type subgiant, with luminosity 3.5 , mass 1.1 and age about 6.7 Gy (Dravins, Lindegren, & VandenBerg, 1998). It has received less attention than the three stars mentioned above, presumably due to its extreme southerly declination (). An attempt to measure oscillations in Hyi in radial velocity was made by Edmonds & Cram (1995) and gave upper limits on the strongest modes of 1.5 to 2.0 m s-1, consistent with our detection.
2 Observations and data reduction
The observations were made over five nights (2000 June 11–15). We used the University College London Echelle Spectrograph (UCLES) at the coudé focus of the 3.9-m Anglo-Australian Telescope (AAT) at Siding Spring Observatory, Australia. To produce high-precision velocity measurements, the star was observed through an iodine absorption cell mounted directly in the telescope beam, immediately behind the spectrograph entrance slit. The cell is temperature-stabilized at 550.1∘C and imprints a rich forest of molecular iodine absorption lines from 500 nm to 600 nm directly on the incident starlight. Echelle spectra were recorded with the MITLL 2k4k 15m pixel CCD, denoted MITLL2a, which covered the wavelength range 470–880 nm.
Exposure times were typically 60 s, with a dead-time of 55 s between exposures (using “FAST” readout). The signal-to-noise ratio for most spectra was in the range 200 to 400, depending on the seeing and extinction. In total, 1196 spectra were collected, with the following distribution over the five nights: 59, 166, 301, 325 and 345. The first two nights were affected by poor weather and technical problems.
Extraction of radial velocities from the echelle spectra followed the method described by Butler et al. (1996). This involved using the embedded iodine lines both as a wavelength reference and also to recover the spectrograph point-spread-function. Essential to this process were template spectra taken of Hyi with the iodine cell removed from the beam, and of the iodine cell itself superimposed on a rapidly rotating B-type star.

The resulting velocity measurements for Hyi are shown in the lower panel of Fig. 1. They have been corrected to the solar system barycentre, as described by Butler et al. (1996). No other corrections, decorrelation or high-pass filtering have been applied: the measurements are exactly as they emerged from the pipeline processing. Note that the velocity measurements are relative to the velocity of the star when the template was taken. The slow variations in velocity within and between nights are due to uncorrected instrumental drifts. The rms scatter of these measurements is 3.30 m s-1.
Uncertainties for the velocity measurements were estimated from residuals in the fitting procedure and are shown in the upper panel of Fig. 1. Most lie in the range 2.5–4 m s-1, and fall gradually during each night as the target rises in the sky.
Observations of Hyi were also made using the CORALIE spectrograph on the 1.2-m Leonard Euler Swiss telescope at La Silla Observatory in Chile (Queloz et al., 2000). The precision of those measurements was poorer than those from UCLES, presumably due – at least in part – to the smaller telescope aperture. The CORALIE data are not included in this Letter; their analysis is postponed to a future paper.
3 Time series analysis
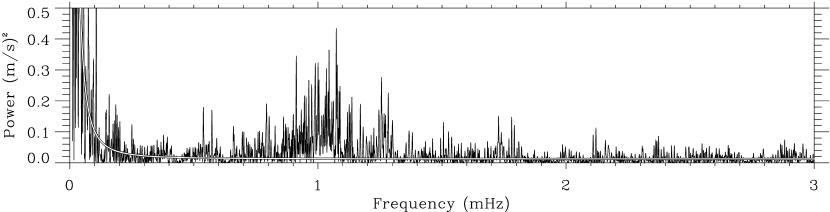
The amplitude spectrum of the velocity time series was calculated as a weighted least-squares fit of sinusoids (Frandsen et al., 1995; Arentoft et al., 1998), with a weight being assigned to each point according its uncertainty estimate. Figure 2 shows the resulting power spectrum. There is a striking excess of power around 1 mHz which is the clear signature of solar-like oscillations. As discussed below, the frequency and amplitude of this excess power are in excellent agreement with expectations. We also note that the excess is apparent in the power spectra of individual nights.
Typically for such a power spectrum, the noise has two components:
-
1.
At high frequencies it is flat (i.e., white), indicative of the Poisson statistics of photon noise. The mean noise level in the amplitude spectrum in the range 3–5 mHz is 0.11 m s-1. Since this is based on 1196 measurements, we can calculate (e.g., KB95) that the velocity precision on the corresponding timescales is 2.2 m s-1.
-
2.
Towards the lowest frequencies, we see rising power that arises from the slow drifts mentioned above. A logarithmic plot shows that, as expected for instrumental drift, this noise goes inversely with frequency in the amplitude spectrum (and inversely with frequency squared in power). It has a value at 0.1 mHz of 0.3 m s-1.
The white line in Fig. 2 shows the combined noise level, and we see that the contribution from noise is neglible above about 0.5 mHz.
4 Discussion
4.1 Oscillation frequencies
Mode frequencies for low-degree oscillations in the Sun are reasonably well approximated by the asymptotic relation:
| (1) |
Here and are integers which define the radial order and angular degree of the mode, respectively; (the so-called large separation) reflects the average stellar density, is sensitive to the sound speed near the core and is sensitive to the surface layers. Note that is , where is the so-called small frequency separation between adjacent modes with and .
A similar relation to equation (1) is expected for other solar-like stars, although there may be significant deviations in more evolved stars. Models of the G subgiant Boo suggest that modes with undergo ‘avoided crossings,’ in which their frequencies are shifted from their usual regular spacing by effects of gravity modes in the stellar core (Christensen-Dalsgaard, Bedding, & Kjeldsen, 1995). Some evidence for this effect was seen in the proposed detection of oscillations in Boo by Kjeldsen et al. (1995).
In attempting to find peaks in our power spectrum matching the asymptotic relation, we were severely hampered by the single-site window function. As is well known, daily gaps in a time series produce aliases in the power spectrum at spacings which are difficult to disentangle from the genuine peaks. Various methods have been discussed in the literature for searching for a regular series of peaks, such as autocorrelation, comb response and histograms of frequencies (e.g., Gilliland et al., 1993; Kjeldsen et al., 1995; Mosser et al., 1998; Barban et al., 1999; Martic et al., 1999). Here we use a type of comb analysis, in which we calculated a response function for all sensible values of , and .
Since we are searching for mode structure in the region of excess power, it is convenient to rewrite equation (1) as
| (2) |
Here, is the frequency of a radial () mode in the region of maximum power, for which . Thus, replaces as the parameter for the absolute position of the comb.
The comb response function was obtained as follows. We first thresholded the power spectrum at the noise level. In other words, any points less than the noise level were set at this level. For each triplet (, , ) we then measured the (modified) power spectrum at each of the frequencies predicted by equation (2). We summed these numbers to produce a response value which is a measure of the goodness-of-fit of that triplet. We limited the sum to , and , with centred at 1000 Hz. The restriction on was made for two reasons: as in the Sun, we only see modes excited to observable amplitudes over a restricted range of frequencies and, also as in the Sun, we expect deviations from equation (2) over large ranges in frequency.
From this analysis we identified the parameters that maximised the comb response, searching over the ranges = 45–80 Hz and = 0.5–2.0 Hz. These ranges encompass the values that would be expected for this star. For , we examined a range of width centred on 1000 Hz. The following two triplets of (, , ) gave the best responses: (56.2, 0.83, 1030.1) Hz (solution A) and (60.3, 0.75, 1005.3) Hz (solution B). The frequencies corresponding to these solutions are shown in Fig. 3, overlaid on the measured power spectrum. The distribution as a function of frequency of matches between calculated and observed peaks is not the same for the two solutions. The matches in Solution B occur mostly at the lower frequencies, while those for Solution A cover the full range of excess power. This suggests that Solution A is more likely to be the correct one.

How do these two solutions agree with expectations for Hyi? The large separation of a star scales approximately as the square root of density. Extrapolating from the solar case () using parameters for Hyi of , K and (see Dravins et al., 1998, and references therein) gives . Given that we searched over the entire range 45–80 Hz, the excellent agreement between observation and theory is very encouraging, especially for solution A.
There is no simple way to estimate for a star as evolved as Hyi, since this parameter is very sensitive to evolution. Extrapolating the grid calculated by Christensen-Dalsgaard (1993) leads us to expect in the range 0.5 to 1.0, which is consistent with both solutions. The value of (or, equivalently, ) depends on details of the surface layers, which also requires construction of models specifically for Hyi.
We note that simulations in which input frequencies obeyed the asymptotic relation precisely showed a more definite (and unambiguous) peak in the comb response than did the real data. We conclude that the oscillation frequencies in Hyi have significant departures from the asymptotic relation. This is of great astrophysical interest and not unexpected, but it does make it very difficult to extract the correct frequencies from our single-site data.
At the suggestion of the referee, we examined the comb response of random power spectra that were generated by multiplying white noise by an envelope similar to the observed power excess. For these spectra, the comb response sometimes showed peaks similar to those from the real data, at various values of . The comb analysis therefore does not prove that the excess power is due to individual modes. However, given (i) the agreement between observations and expectations in all respects – position and amplitude of excess power (see below), and the best-fit value for – and (ii) the absence of any theoretical or observational reason to attribute the power excess to other sources, we consider that solar-like oscillations are the most likely explanation for the observed power excess.
4.2 Oscillation amplitudes
The strongest peaks in the amplitude spectrum of Hyi (square root of power) reach about 0.6 m s-1. However, these are likely to have been strengthened significantly by constructive interference with noise peaks. As stressed by KB95 (Appendix A.2), the effects of the noise must be taken into account when estimating the amplitude of the underlying signal. To do this, we have generated simulated time series consisting of artificial signal plus noise. We conclude that the underlying oscillations have peaks of about 0.5 m s-1.
Solar-like oscillations are excited by convection and the expected amplitudes have been estimated using theoretical models. Based on models by Christensen-Dalsgaard & Frandsen (1983), KB95 suggested that amplitudes in velocity should scale as . More recent calculations by Houdek et al. (1999) confirm this scaling relation, at least for stars with near-solar effective temperatures. For Hyi, the implied amplitude is about 3.2 times solar, which is 0.7 to 0.8 m s-1 (based on the strongest few peaks – see KB95). The observed amplitudes are therefore consistent with expectations. We also note that the frequency of excess power (1 mHz) is in excellent agreement with the value expected from scaling the acoustic cutoff from the solar case (Brown et al., 1991, KB95).
5 Conclusion
Our observations of Hyi show an obvious excess of power, clearly separated from the noise, and with a position and amplitude that are in agreement with expectations. Although hampered by the single-site window, a comb analysis shows evidence for approximate regularity in the peaks at the spacing expected from asymptotic theory. There seem to be significant departures from regularity, perhaps indicating mode shifts from avoided crossings. We hope that further analysis along one or more of the following lines will allow us to explore further the oscillation spectrum of Hyi: including the CORALIE observations which, despite their lower precision, could usefully improve the spectral window; reducing the noise of the velocity measurements (UCLES and CORALIE) by decorrelating against external parameters (e.g., Gilliland et al., 1991); combining these results with an analysis of equivalent-width variations of strong lines in the spectral region uncontaminated by iodine lines (e.g., H); and using theoretical models to calculate expected shifts due to avoided crossings, to help identify the affected modes.
The clear strength of the technique used in these observations is its ability to precisely calibrate spectrograph variations at the timescales of primary interest. Although the best radial velocity precisions achieved in the long term from this technique are 3–4 m s-1, our data clearly demonstrate that the precision at frequencies around 1 mHz is significantly better (2.2 m s-1). Our results provide valuable confirmation that oscillations in solar-like stars really do have the amplitudes that we have been led to expect by extrapolating from the Sun. This bodes extremely well for success of space missions such as MOST (Matthews et al., 2000), MONS (Kjeldsen, Bedding, & Christensen-Dalsgaard, 2000) and COROT (Baglin et al., 1998), which will provide photometric data of high quality for a wide sample of stars.
References
- Arentoft et al. (1998) Arentoft, T., Kjeldsen, H., Nuspl, J., Bedding, T. R., Fronto, A., Viskum, M., Frandsen, S., & Belmonte, J. A., 1998, A&A, 338, 909.
- Baglin et al. (1998) Baglin, A., et al., 1998, In Deubner, F.-L., Christensen-Dalsgaard, J., & Kurtz, D. W., editors, Proc. IAU Symp. 185, New Eyes to See Inside the Sun and Stars, page 301. Dordrecht: Kluwer. see also http://www.astrsp-mrs.fr/projets/corot/.
- Barban et al. (1999) Barban, C., Michel, E., Martic, M., Schmitt, J., Lebrun, J. C., Baglin, A., & Bertaux, J. L., 1999, A&A, 350, 617.
- Bedding & Kjeldsen (1998) Bedding, T. R., & Kjeldsen, H., 1998, In Donahue, R. A., & Bookbinder, J. A., editors, Tenth Cambridge Workshop on Cool Stars, Stellar Systems and the Sun, volume 154 of A.S.P. Conf. Ser., page 301. San Francisco: ASP.
- Brown & Gilliland (1994) Brown, T. M., & Gilliland, R. L., 1994, ARA&A, 33, 37.
- Brown et al. (1991) Brown, T. M., Gilliland, R. L., Noyes, R. W., & Ramsey, L. W., 1991, ApJ, 368, 599.
- Butler et al. (1996) Butler, R. P., Marcy, G. W., Williams, E., McCarthy, C., Dosanjh, P., & Vogt, S. S., 1996, PASP, 108, 500.
- Christensen-Dalsgaard (1993) Christensen-Dalsgaard, J., 1993, In Brown, T. M., editor, GONG 1992: Seismic Investigation of the Sun and Stars, volume 42 of A.S.P. Conf. Ser., page 347. Utah: Brigham Young.
- Christensen-Dalsgaard et al. (1995) Christensen-Dalsgaard, J., Bedding, T. R., & Kjeldsen, H., 1995, ApJ, 443, L29.
- Christensen-Dalsgaard & Frandsen (1983) Christensen-Dalsgaard, J., & Frandsen, S., 1983, Sol. Phys., 82, 469.
- Dravins et al. (1998) Dravins, D., Lindegren, L., & VandenBerg, D. A., 1998, A&A, 330, 1077.
- Edmonds & Cram (1995) Edmonds, P. D., & Cram, L. E., 1995, MNRAS, 276, 1295.
- Frandsen et al. (1995) Frandsen, S., Jones, A., Kjeldsen, H., Viskum, M., Hjorth, J., Andersen, N. H., & Thomsen, B., 1995, A&A, 301, 123.
- Gilliland et al. (1991) Gilliland, R. L., Brown, T. M., Ducan, D. K., Suntzeff, N. B., Lockwood, G. W., Thompson, D. T., Schild, R. E., Jeffrey, W. A., & Penprase, B. E., 1991, AJ, 101, 541.
- Gilliland et al. (1993) Gilliland, R. L., Brown, T. M., Kjeldsen, H., McCarthy, J. K., Peri, M. L., et al., 1993, AJ, 106, 2441.
- Heasley et al. (1996) Heasley, J. N., Janes, K., Labonte, B., Guenther, D., Mickey, D., & Demarque, P., 1996, PASP, 108, 385.
- Houdek et al. (1999) Houdek, G., Balmforth, N. J., Christensen-Dalsgaard, J., & Gough, D. O., 1999, A&A, 351, 582.
- Kjeldsen & Bedding (1995) Kjeldsen, H., & Bedding, T. R., 1995, A&A, 293, 87 (KB95).
- Kjeldsen et al. (2000) Kjeldsen, H., Bedding, T. R., & Christensen-Dalsgaard, J., 2000, In Szabados, L., & Kurtz, D., editors, IAU Colloqium 176: The Impact of Large-Scale Surveys on Pulsating Star Research, volume 203, page 73. ASP Conf. Ser. see also http://astro.ifa.au.dk/MONS.
- Kjeldsen et al. (1999) Kjeldsen, H., Bedding, T. R., Frandsen, S., & Dall, T. H., 1999, MNRAS, 303, 579.
- Kjeldsen et al. (1995) Kjeldsen, H., Bedding, T. R., Viskum, M., & Frandsen, S., 1995, AJ, 109, 1313.
- Martic et al. (1999) Martic, M., Schmitt, J., Lebrun, J.-C., Barban, C., Connes, P., Bouchy, F., Michel, E., Baglin, A., Appourchaux, T., & Bertaux, J.-L., 1999, A&A, 351, 993.
- Matthews et al. (2000) Matthews, J. M., Kuschnig, R., Walker, G. A. H., Pazder, J., Johnson, R., Skaret, K., Shkolnik, E., Lanting, T., Morgan, J. P., & Sidhu, S., 2000, In Szabados, L., & Kurtz, D., editors, IAU Colloqium 176: The Impact of Large-Scale Surveys on Pulsating Star Research, volume 203, page 74. ASP Conf. Ser. see also http://www.astro.ubc.ca/MOST.
- Mosser et al. (1998) Mosser, B., Maillard, J. P., Mékarnia, D., & Gay, J., 1998, A&A, 340, 457.
- Queloz et al. (2000) Queloz, D., Mayor, M., Weber, L., Blécha, A., Burnet, M., Confino, B., Naef, D., Pepe, F., Santos, N., & Udry, S., 2000, A&A, 354, 99.