Preliminary Results from the 1999 Balloon Flight of the Liquid Xenon Gamma-Ray Imaging Telescope (LXeGRIT)
Abstract
LXeGRIT is a balloon-borne Compton telescope employing a large volume liquid xenon time projection chamber (LXeTPC) as the central –ray detector. It is designed to image –rays in the energy range of 200 keV to 20 MeV, with an angular resolution of about 3 degrees (1 sigma) at 2 MeV, within a field-of-view (FOV) of about 1 sr. The detector’s energy and three-dimensional spatial resolution as measured during pre-flight calibration experiments, are and 1mm RMS, respectively. The detection efficiency for Compton events varies between 1.5 % and 4 % depending on energy and event selection. We describe the instrument as flown on May 7, 1999 and review its overall performance at balloon altitude. The launch occurred at 13:26:54 UT from Ft. Sumner, New Mexico and the flight was terminated about 9 hours later. The Crab was in the instrument FOV for a few hours. Analysis of these data is in progress.
Keywords: gamma-rays, instrumentation, imaging, telescope, balloon missions, high energy astrophysics
1 Introduction
In 1989 the concept of a liquid xenon time projection chamber (LXeTPC) as a Compton telescope for MeV –ray astrophysics was proposed[1] . A series of experiments with LXe detectors followed, aimed at establishing the charge and light yields, with specific emphasis on the use of LXe in a position sensitive detector for MeV gamma-ray astrophysics [2, 3] . In 1993, the design and construction of a 10 liters LXeTPC was started, in collaboration with Waseda University. The goal was to demonstrate the technology with a laboratory prototype of a size suitable to verify the spectroscopy and Compton imaging response to MeV –rays. Details on the mechanical design of the TPC electrodes structure and its cryostat for low temperature operation, xenon purification and cryogenics, readout electronics for charge and light signals, and results from extensive laboratory tests which established its successful operation as a radiation detector are discussed in [4]. Based on these results it was proposed, in late 1995, to use the LXeTPC prototype as a balloon-borne –ray telescope, to ultimately demonstrate its imaging capability on astrophysical sources. Turning the laboratory detector into a flight instrument (LXeGRIT) has required new developments mostly in three areas: a cryogenics flight system, a readout electronics and data acquisition flight system, and an instrumentation and control system. A parallel effort has involved modifications of the gondola and veto shield systems of the University of New Hampshire Directional Gamma-Ray Telescope (DGT) [5] , made available for LXeGRIT. A description of the flight instrument and its performance during its May 1999 balloon flight follows. Details on the LXeTPC detector and its readout electronics can be found in [6] . Results on its spectral and imaging performance from pre-flight calibration experiments are presented in a separate contribution to these proceedings [7] .
2 Instrument Description
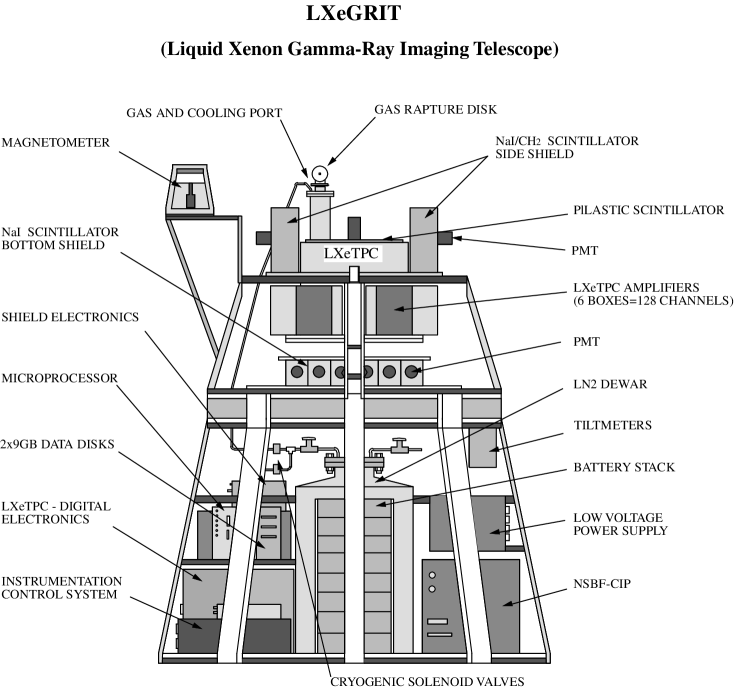
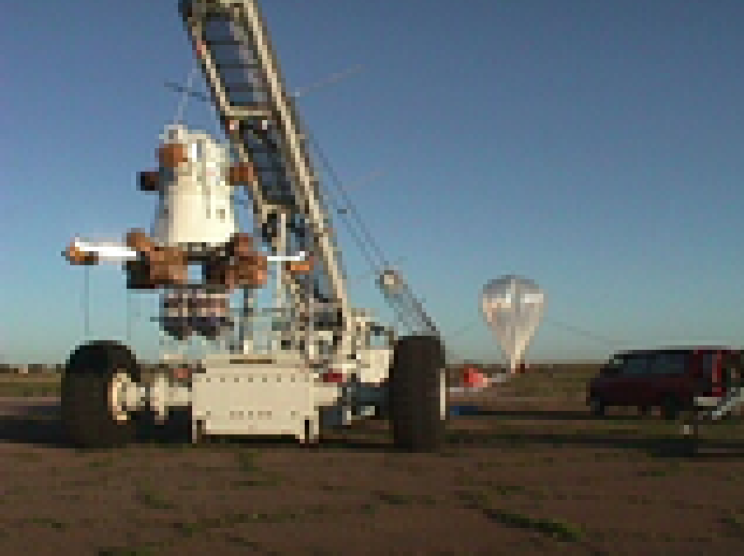
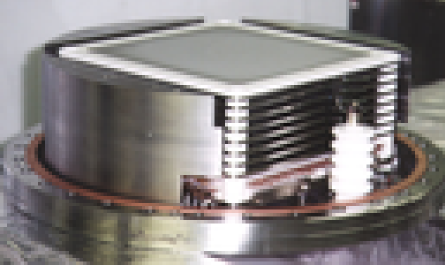
A schematic of the LXeGRIT instrument assembled on the balloon gondola is shown in Fig. 1. The actual payload, suspended from the launch vehicle a few hours before the flight is shown in Fig. 2. LXeGRIT, in its May 1999 flight configuration, was a 1100 kg payload, exclusive of the balloon, parachute and ballast. Table 1 summarizes the instrument characteristics.
| Energy Range | – MeV |
|---|---|
| Energy Resolution | |
| Position Resolution | 1 mm (3 dimensions) |
| Angular Resolution | 3∘ at 1.8 MeV |
| Field of View (FWHM) | 1 sr |
| Effective Area (Imaging) | 16 cm2 @ 1 MeV |
| LXeTPC Active Volume | 20 cm 20 cm 7 cm |
| Active Back Shield | 2730 cm2, 10 cm thick NaI(Tl) |
| Active Side Shield | 4750 cm2, 10 cm thick NaI(Tl) & CH2 |
| Active Top Shield | 1600 cm2, 1.2 cm thick plastic |
| LN2 Dewar | 100 liter |
| Instrument Mass, Power | 1100 kg, 450 W |
| Telemetry, Onboard Storage | kbps, GB |
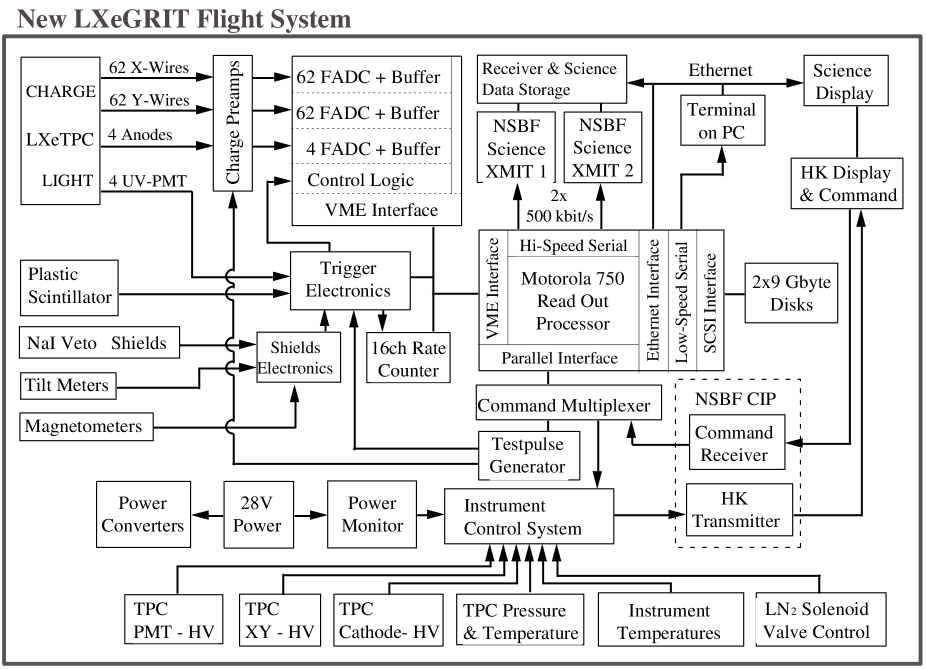
The DGT gondola was extensively modified for LXeGRIT. Since the instrument is a Compton telescope, it does not require an active pointing system. The instrument’s zenith direction is determined from the pitch and roll with respect to the local vertical, measured by two precision inclinometers. Azimuth orientation is provided by two crossed magnetometers, calibrated before the flight. This information, together with the knowledge of the geographical coordinates of the payload, is needed for imaging analysis of the flight data. A simplified block diagram of the LXeGRIT flight system is shown in Fig. 3. We refer to both figures in the following description of the various instrument components. Since LXeGRIT was built around a pre-existing detector system, a pressure enclosure for a flight system would have been difficult and expensive to realize. Therefore, special care had to be paid to insure that every subsystem would sustain the near vacuum conditions and the temperatures encountered during a balloon flight.
2.1 The LXeTPC
At the center of LXeGRIT is the LXeTPC. A simplified mechanical drawing is shown in Fig. 5.
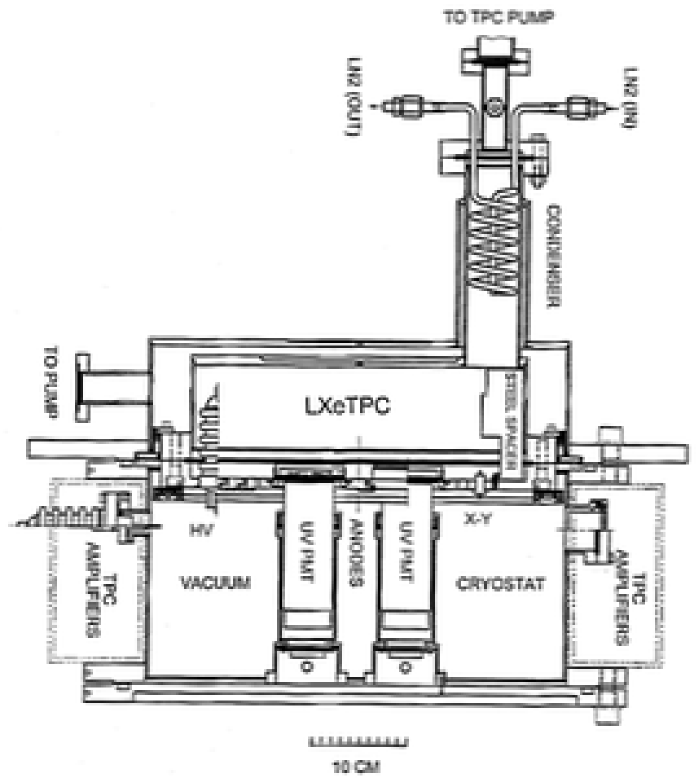
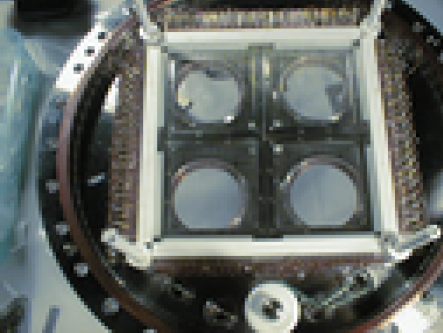
The TPC electrodes are mounted on a 42 cm diameter conflat flange (see Fig. 5) which encloses a 10 liter cylindrical vessel. The sensitive volume is cm3, defined by the cathode at a distance of 7 cm from the shielding grid and by the field shaping rings. The 7 cm layer of active LXe corresponds to 21 g/ cm2 of absorber. The cylindrical vessel is not the optimum choice for the TPC structure, as it leads to a large amount of LXe outside the active volume. To reduce this amount, and thus minimize the presence of an effective but un-vetoed scintillator around the active region, spacers made out of solid steel are used, except on the cathode HV feedthrough side. These spacers, clearly shown in Fig. 5, reduce the amount of LXe needed to fill the vessel by about 2 l. Four quartz windows are brazed on the detector’s flange to couple four UV PMTs to the chamber, for the Xe scintillation light detection. Hermetic feedthroughs for signals (124 for the X-Y wires readout structure, 4 for the anodes) and HV lines are also welded on this flange. High purity ( ppb O2 equivalent) Xe gas is liquified into the vessel by a controlled flow of liquid nitrogen (LN2) through the copper coil of the condenser on the top. The liquid temperature is C, at a pressure of 1.5 atm. Thermal insulation of the cold vessel is provided by a vacuum cryostat. The lower section of the cryostat encloses the four PMTs, as well as the HV distribution circuitry for the wires and the cathode. Both TPC vessel and vacuum cryostat are made out of stainless steel. The outer dimensions of the complete detector are about 50 cm diameter by 35 cm high, excluding the condenser. The size of the lower cryostat is determined by the length of the PMTs. The total mass, including the liquid xenon, is about 190 kg.
2.2 The Cryogenics System
The liquid xenon, once in the detector, is maintained at the desired temperature by a controlled flow of LN2 through the condenser. During cooling, microphonics noise affects the stability of the digitized pulses, mostly the anode ones, and therefore the quality of the data. To minimize the amount of unusable data, we allow the vapor pressure on top of the liquid to build from 1.4 atm to 2.4 atm. At this point, a solenoid valve opens to start the flow of LN2 and it closes once the pressure is down to 1.4 atm. Both the vapor pressure above the liquid and the temperature of the bottom flange are monitored continuously. We do not see an impact of the few degrees temperature variation on the data. In the laboratory, a cooling cycle lasts less than 10 min and the period of the cycle is about 75 min. During the flight, the period is longer due to the colder air temperature (-20 ∘ at a float altitude of 40 km) and the near vacuum conditions. For the cooling of the detector during the flight, a LN2 dewar is carried on board. It is a commercial dewar, modified to include a molecular sieves trap, to maintain the vacuum in the TPC cryostat during the flight. The hold time for the flight dewar with a capacity of about 90 liters, is about 40 hours. For redundancy, two solenoid valves are used on board, controlled by the Instrumentation and Control system (ICS). In case the primary valve fails to open, the secondary valve can be opened manually by ground command. The system has worked reliably both in the last flight and in the 1997 test flights from Palestine, TX. The TPC is equipped with a rapture disk, set at a pressure of 7.5 atm. When the payload is released from the balloon and starts the descent, the cooling system is kept powered. During the May 1999 flight, the payload was recovered a few hours after touch down, in a location about 350 miles from Ft Sumner. After replenishing the LN2 supply, the cooling system kept working until the payload was brought back to the launch base, more than 24 hours after recovery. As the launch date and time is not known a priori, the detector must be filled and operational well in advance (a couple of days) of a launch opportunity. This requires a good purity of the xenon, a low outgassing rate for the detector, and a reliable cooling system. The TPC charge stability with time has been verified in laboratory experiments lasting several days, as well as after the recovery of the payload following the May flight.
2.3 The Shield Veto System
To reduce the charged particles and gamma-ray background rate at balloon altitude, it was decided to use the available DGT shields to cover the LXeTPC as much as possible. The detector intrinsic 3D event imaging capability allows an effective identification and rejection of single interaction events and charged particles in the off line analysis. However, the decision to use an active shield was motivated by the desire to reduce the overall data rate to be transmitted via telemetry to ground. The shield configuration used for the LXeGRIT balloon flights is shown in Fig. 6.
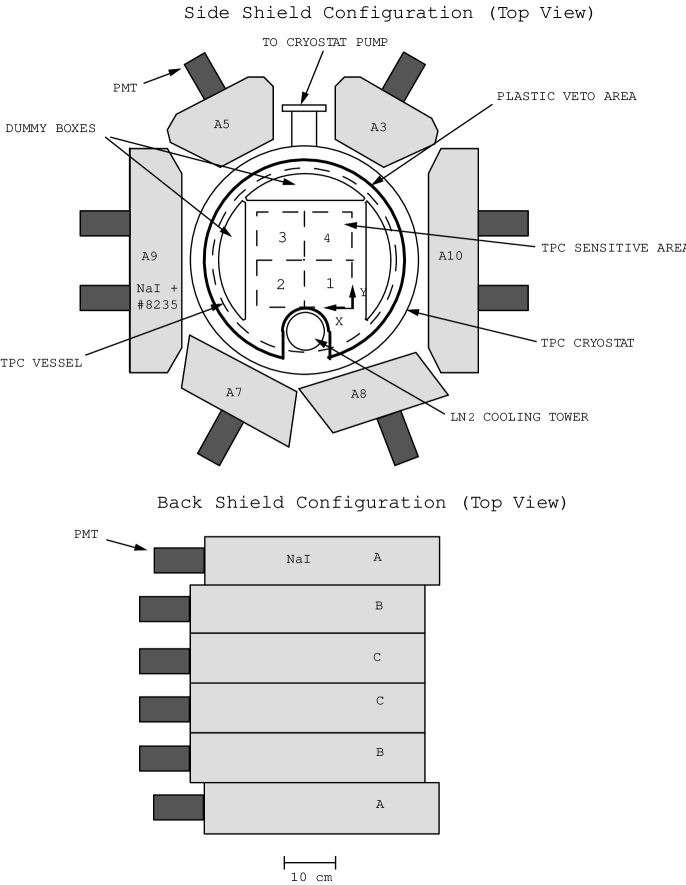
The back shield consists of six 10 x 10 x 41 cm3 bars of NaI(Tl) with PMTs at one end, covering an area of about cm2. The side shield consists of six units, each composed of small chunks of NaI(Tl), immersed in liquid scintillator (NE235), sealed in an aluminum container. Each unit is viewed by two PMTs coupled directly to the NE235 mineral oil. The units are of three different shapes, but they all have a thickness of about 10 cm and a height of 25 cm, limiting the TPC field-of-view (FOV) to about 45 degrees. The packing fraction of NaI in the side shields is about 75%. The total mass of the shield system, including the support structures electronics and cables, is about 270 kg. The energy threshold of the side shields, which have poor energy resolution, was adjusted to match the rate in the NaI back shields with a threshold around 300 keV. The original DGT shield electronics and control logic was used. The individual shield rates together with the attitude information from the magnetometers and inclinometers were downlinked to ground through a separate telemetry channel. A plastic scintillator counter of 1.2 cm thickness and an area of cm2 was added to veto the charged particles entering the TPC from the top. It is mounted directly on top of the TPC cryostat and is viewed by one PMT in the center. Its signal is measured by one channel of the UNH shields electronics. The logical OR of the signals from all the shield sections, including the plastic, is fed into the LXeGRIT Trigger Electronics System, to veto the LXeTPC light trigger signal, as discussed below.
2.4 The Charge and Light Readout Electronics System
The LXeTPC detects both ionization and scintillation light signals, produced by gamma-ray interactions or by charged particles. Free electrons are drifted in a uniform electric field of 1 kV/cm for a maximum distance of 7 cm, corresponding to a maximum drift time of 35 s. The X-Y position of an ionizing event is determined from the signals induced on two orthogonal planes of parallel wires with a 3 mm pitch. The Z-coordinate, is determined from the drift time, measured with respect to the trigger of the fast ( ns) Xe light. The energy deposition is measured on four anodes each covering an area of about cm2. Each of the 62 X-wires and 62 Y-wires and each anode is amplified with a charge sensitive amplifier and fed to a custom-built digital electronics system. The signals are digitized at a rate of 5 MHz with a resolution of 8-bits for the wires and 10-bits for the anodes. The digitized data are stored in an array of ring buffers with 256 samples per event, covering more than the maximum drift time. The maximum energy which can be sensed by this system is around 20 MeV. The design and fabrication of the LXeGRIT digital electronics was provided by Marshall Space Flight Center and is described in [6]. Low-power consumption, while desirable, was not a primary concern in the design of this system. The average power consumption of the tightly packed digital electronics system accounts for about half of the total LXeGRIT power. As discussed in reference [6], problems of overheating were encountered during the first LXeGRIT test flight of a few hours from Palestine, TX in July 1997. These problems were corrected for the 1999 flight, by better passive distribution from the heat source to the gondola frame. The frontend charge sensitive amplifiers system, also described in reference [6], are housed in six boxes mounted around the lower section of the cryostat. The system is such that the equivalent noise charge on the wires is typically less than 400 e- RMS, while the noise on the anodes of higher capacitance is 800 e- RMS. With these noise conditions, the TPC can well detect the multiple interactions of MeV –rays, with energy deposits as low as 100 keV, in optimized conditions.
The trigger for the digital electronics is provided by a light signal from the TPC, if not vetoed by a signal in the shields or the plastic counter. After amplification, the signals from the four PMTs viewing the LXe volume, are passed through four window discriminators. The lower-level discriminator reduces noise pulses, whereas the upper-level discriminator is used to discriminate against high energy events, mostly from charged particles traversing the TPC. These thresholds are adjustable in flight, via commands from the data acquisition processor. The upper threshold can also be turned off. The OR of the four PMTs constitutes the TPC light trigger. In case of no veto signal from the shield system, the TPC light trigger starts the data acquisition and marks the beginning of the drift time measurement. To avoid readout of more than one event in the sensitive volume, it is required that there was no PMT signal within 50 s before the event. If a second PMT signal occurs within 50 s after the original trigger, an abort signal is generated to stop data acquisition and to reset the system.
2.5 The Data Acquisition System
Data acquisition (DAQ) is controlled by a commercial processor (Motorola MVME2700) with good computational performance (10 specInts), high bandwidth architecture ( Mbytes/s on the internal PCI bus) and all the I/O subsystems (parallel port, high speed serial ports, SCSI bus) needed in the DAQ layout. The new processor board, placed in a separate pressurized box, is interfaced to the trigger electronics and the waveform digitizers via a VME-like bus, using a special adapter card to interconnect with the custom-made bus of the existing digital electronics. The microprocessor polls the digital front-end electronics for data and reads the digitized waveforms with a through-put of 400 – 600 Kbytes/s. As soon as all signals are read out, it readies the electronics for the next trigger. About a quarter of the accepted events are transmitted to ground via two high-speed serial links at 500 kbits/s each, to provide feed-back on the data quality. The remaining events are written via SCSI interface to one of two onboard hard disks with 9 Gbytes capacity each. For a good understanding of event patterns at float altitude in this new type of detector, data were predominantly taken in a mode that reads all information from anodes and wires. While providing a full image of the chamber continuously, this mode requires an event size of about 29 Kbytes, slowing down the DAQ to a rate of typically 100 – 150 handled events/s. About 7% – 12% of these events were accepted by the online checks performed by software:
-
•
Requirement of a minimum signal amplitude above initial baseline on at least one anode.
-
•
Requirement of a minimum and a maximum number of wire hits on each view (X and Y), i.e., wire signals above thresholds recognized in hardware. Thresholds are either set manually or automatically by noise evaluation with test triggers.
Data taking is controlled from ground by transmission of commands to a multiplexer, which forwards DAQ commands to the microprocessor via a standard parallel port. DAQ can thus be controlled by, e.g., setting thresholds in the charge and light read-out and by changing the DAQ mode. Commands as well as configuration packets which summarize DAQ settings are transmitted to ground via the two fast “science data” channels, and are also written to disk to cope with the high data rate. In addition, the DAQ processor reads the sixteen 16-bit counters in the trigger electronics system, which record, e.g., the rate of the individual PMTs, their logical OR within a given discriminator window and above the lower level threshold. These rates serve as monitor of the detector operation, and also determine the influence of each cut in the trigger decision to finally calculate the flux of gamma-rays. The trigger rates, together with internal counters that keep track of the DAQ efficiency, are transmitted to ground every two seconds. All the relevant information is displayed online.
2.6 The Instrumentation and Control System
Apart from the trigger rates, all the housekeeping and instrument control is handled by a designated processor part of the Instrumentation and Control System. The control functions include setting the high voltages for the TPC cathode, X-Y wire planes and PMTs, and to operate the solenoid valves for cooling of the detector. The corresponding commands are decoded from the signals received by telemetry. The high voltage on the electrodes is raised and lowered at a predetermined rate to avoid an excessive charge build up due to the voltage change, which could destroy the input of the charge sensitive amplifiers. During the flight the status of the TPC and all the support systems are constantly monitored. The parameters measured by the ICS are the battery voltage and current, all high voltage values, the pressure in the TPC, and the reading of 16 temperature sensors distributed over strategically chosen locations on the payload. The temperatures give a crucial information. Although the ambient temperature at float altitude is typically -20 ∘, the reduced air pressure results in a heat transfer that is 20 times lower than on the ground. Any electronic device might overheat if the produced heat is not conducted away sufficiently fast. Additional to these 16 temperature sensors, also the temperature of the liquid Xe is constantly measured. Because of the low temperature and of the precision required for this measurement, a platinum resistor mounted in good heat contact with the bottom flange of the TPC vessel is employed. Given the relation between vapor pressure and temperature, this measurement can be used to manually initiate cooling if the pressure transducer should fail shutting down the automatic system.
The operation of a HV system is problematic at reduced air pressure. With the reduced density, discharges are frequent at voltages completely safe at normal air pressure. These discharges of course dissappear in a good vacuum. The residual pressure at float altitude is about the worst condition for voltage breakdown. The cathode voltage power supply is therefore mounted within the envelope of the TPC cryostat which is evacuated for thermal insulation of the cold detector. The vacuum in the cryostat, provided by the cryo pump within the LN2 dewar, is also measured by the ICS.
Whereas the applied voltage is a good measure to determine the field distributions in the TPC, it is the current in the divider chain which tells if all electrodes are supplied with the proper potential. Therefore also the currents in the divider chains for the cathode and field shaping rings, and in the X-Y wire planes HV distribution are constantly measured and transfered to ground by the ICS.
For the 1999 flight, primary low-voltage (28V) electrical power was supplied by a stack of 20 lithium batteries, rated at 30Ah each, allowing a flight duration of about 40 hours.
3 Instrument Performance
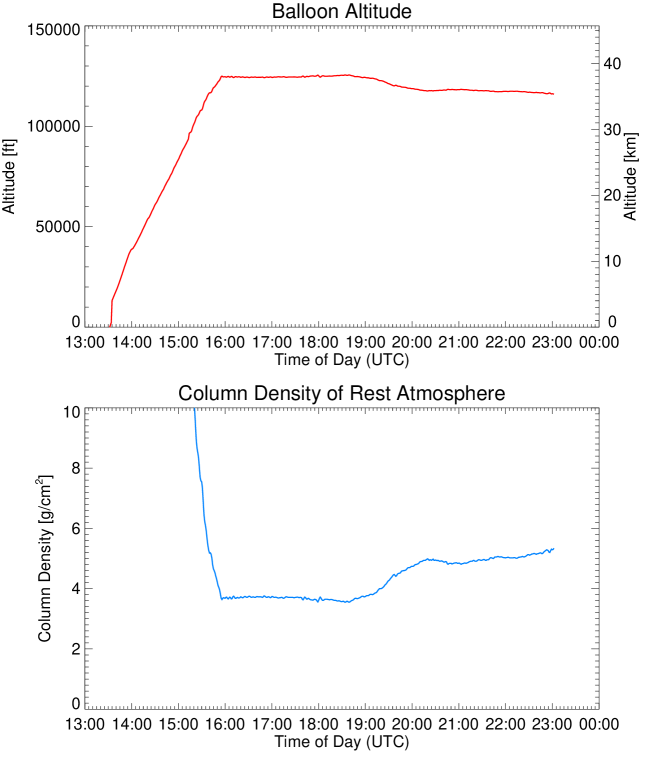
LXeGRIT was launched from the National Scientific Balloon Facility (NSBF) in Ft. Sumner, NM, on May 7, 1999 at 7:26:54 local time (13:26:54 UT), using a 28 million cubic feet balloon. It reached float altitude after about 2.5 hours, and remained there for 7 hours, before flight termination due to wind conditions. During the entire flight including ascent, a total of 285966 events were collected. The main goal of the flight was a measurement of the background rate in the instrument and to verify the background discrimination capability of the LXeTPC. To verify the Compton imaging performance, the launch time was scheduled such as to have the Crab nebula in the FOV of the instrument for a few hours, once the payload reached float altitude. Fig. 7 shows the altitude of the payload during the flight. The atmospheric depth varied between 3.7 and 5.2 g/. LXeGRIT performed well during the flight: the LXeTPC and its high voltage and cryogenics systems, the electronics and data acquisition systems worked in the near space environment as they did in the laboratory. A few problems were encountered with some of the side shield units. The loss of telemetry contact with the ICS for a major part of the flight did not impact the science data. The payload was recovered in good conditions, with mechanical damages to the magnetometers and three side shield units.
3.1 Preliminary Results from Flight Data
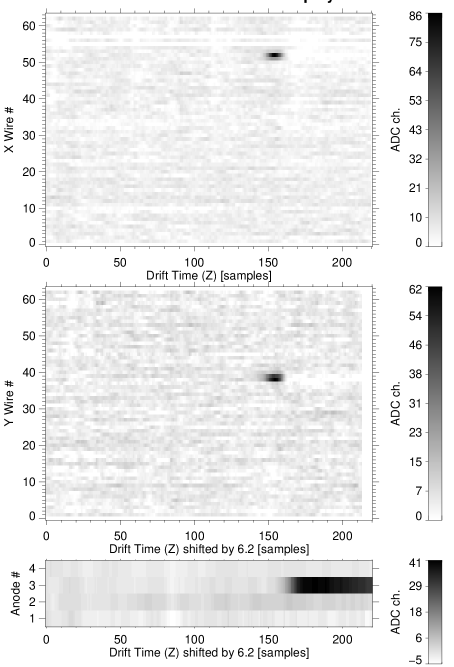
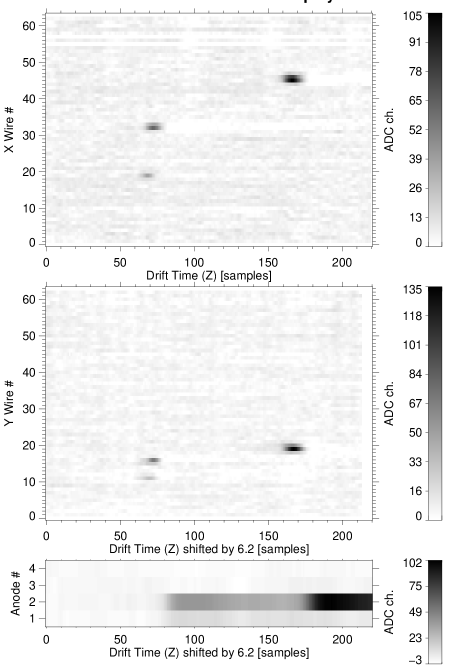
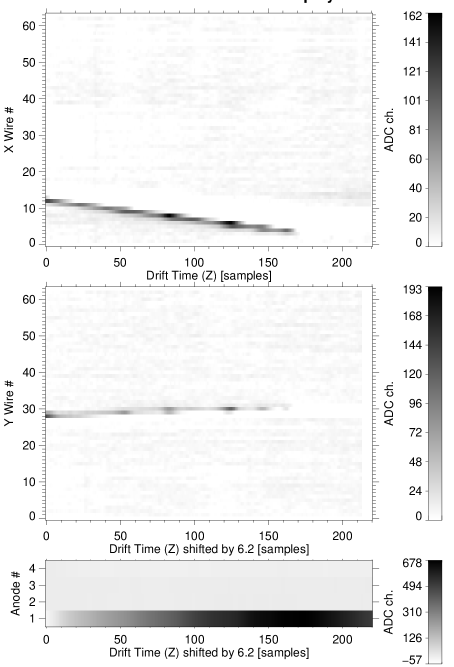
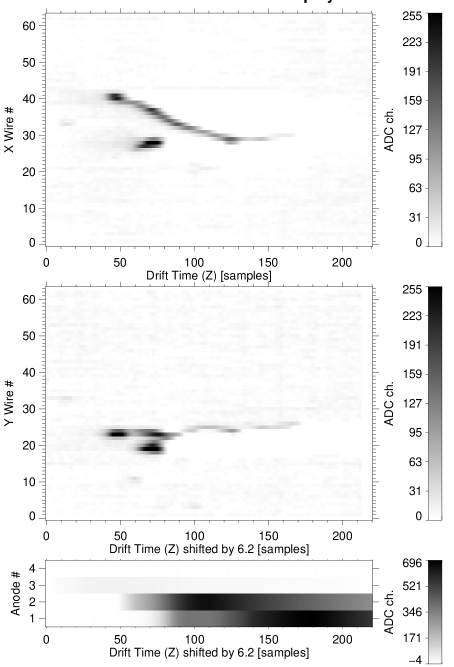
Fig. 8 demonstrates how 3D event imaging makes it possible to distinguish between photons that undergo multiple Compton interactions, which can be used for source imaging, from those that are absorbed in a single interaction or within a small volume of the detector. This provides very significant background rejection. Only photons that produce multiple Compton scatterings in a volume on the order of the spatial resolution of the detector are confused with single-interaction events and therefore lost for imaging. Charged cosmic-ray particles are also easily recognized, both from their large energy loss and long track length. Other event topologies, easily distinguishable from Compton -events, result from fast neutrons generating nuclear reactions within the detector volume.

The noise conditions on anodes and wires during the flight were comparable to laboratory conditions. Fig. 9 shows the complete display of the digitized wire and anode waveforms as a function of drift time for a –ray event recorded during the flight. From the signature on the anodes, where a fit of the anode waveforms is superimposed, the incoming photon is clearly recognized as making four distinct interactions in the sensitive volume. The corresponding interaction locations are also apparent on the X-Y wires.


In the analysis of LXeGRIT data, the signals on anodes and wires are matched according to drift time. The induction signals on both wire planes provide redundant, even though less accurate, energy information in addition to the pulse height measured on the anodes. Only a fraction of the current produced by the drifting electrons is induced on the sensing X-Y wires. In the LXeTPC, the amplitude of the charge signal induced on the wires is on average about 40 % of the total charge collected on the anode(s). The proper working of the signal detection and matching algorithms can therefore be verified by comparison of X- and Y-wire amplitudes, and their correlation with the anode amplitudes. Fig. 10 displays the amplitudes determined by the analysis software for matched single-step events, which show a similar fraction of induced charge versus collected charge as for calibration data (right panel in Fig. 10). The precise matching of X- and Y-wire signals in drift time is evident from the left panel in Fig. 11. The width and mean of this distribution are essentially identical to the values found in calibration data. With a digitizing rate of 0.2 s per sample, the RMS value of 0.79 samples corresponds to a timing accuracy of 160 ns, or an accuracy of about 300 m on the Z-position measurement. The right panel in Fig 11 shows the power of an imaging detector, which allows us to study the event distribution within the sensitive volume. Single-interaction events are predominantly found towards the outer rim of the detector.
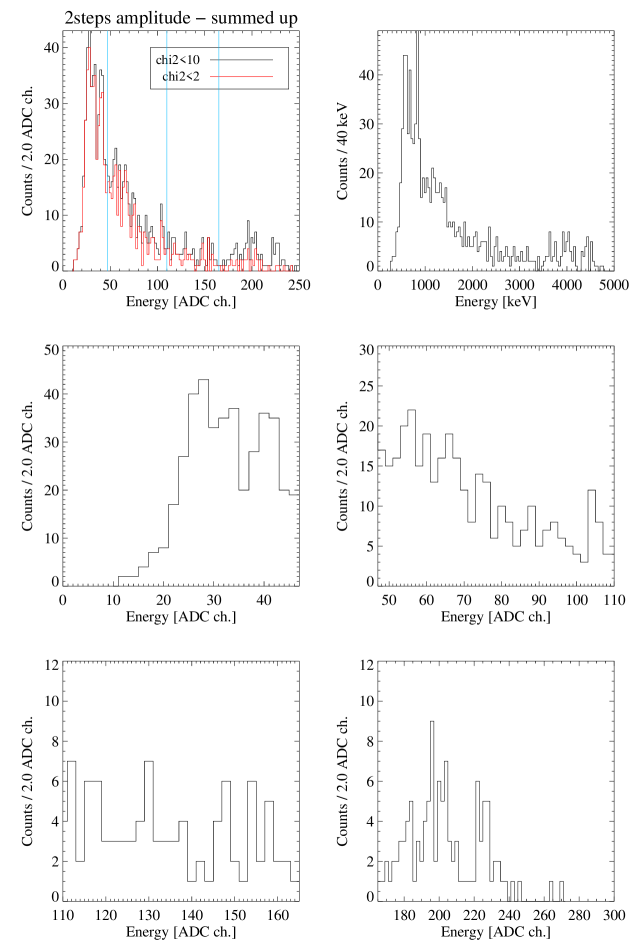
A preliminary result for the in-flight background spectrum is shown in Fig. 12 from the analysis of about 3 hours of data. These are count rates before deadtime correction. The upper figure is from all event types, while the lower two figures show the contribution to the count rate from events reconstructed with a single interaction (1-step) and with multiple interactions, respectively. A very limited number of selections were applied to the data in this figure. The analysis of these events and of the remaining event statistics continues to-date, along with Monte Carlo simulations of all possible contributions to the measured spectrum.


The spectrum is dominated by single interaction events. This type of events, easily recognized by the TPC, are rejected for Compton imaging. It is however intriguing that we see such a large number. Events with energy larger than a few MeV are much less than we expected. In this limited statistics sample, there is a hint of a 511 keV line, as well as a line around 1.4 MeV. We understand the suppression of events with energy larger than a few MeV as due, in large part, to the trigger selections used for the flight data taking. The discriminator window and the PMT high voltages were optimized to achieve a homogeneous trigger efficiency throughout the detector volume, and to reject high energy charged particles. This choice of settings coupled with the predominance of low energy –rays background encountered at float, resulted in an enhanced rate of very low energy events, well below our range of interest.
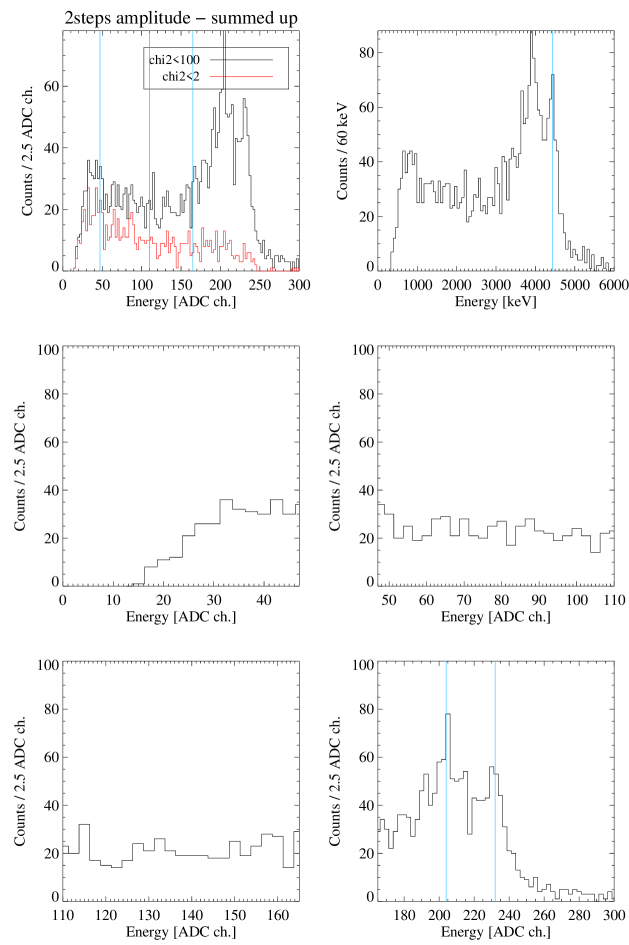
A clear demonstration of the impact of this trigger selection on the measured event energy distribution is shown in Fig. 13, from laboratory data obtained with an AmBe source which emits 4.43 MeV –rays, along with neutrons. The energy spectrum on the left is from multiple interaction events recorded in the LXeTPC triggered with the same window discriminator selection and the same HV settings on the four PMTs as in the flight. In this spectrum, there are almost no events in the full energy peak at 4.43 MeV and in the first escape peak, expected from pair production which becomes increasingly important above 4 MeV. On the other hand, events at high energies dominate the energy spectrum on the right, obtained from an experiment with the same source but with a different trigger selection. Clearly, the flight trigger selection enhances the low-energy part of the spectrum, largely reducing the efficiency for MeV energy depositions.
3.2 Preliminary Results from Monte Carlo Data
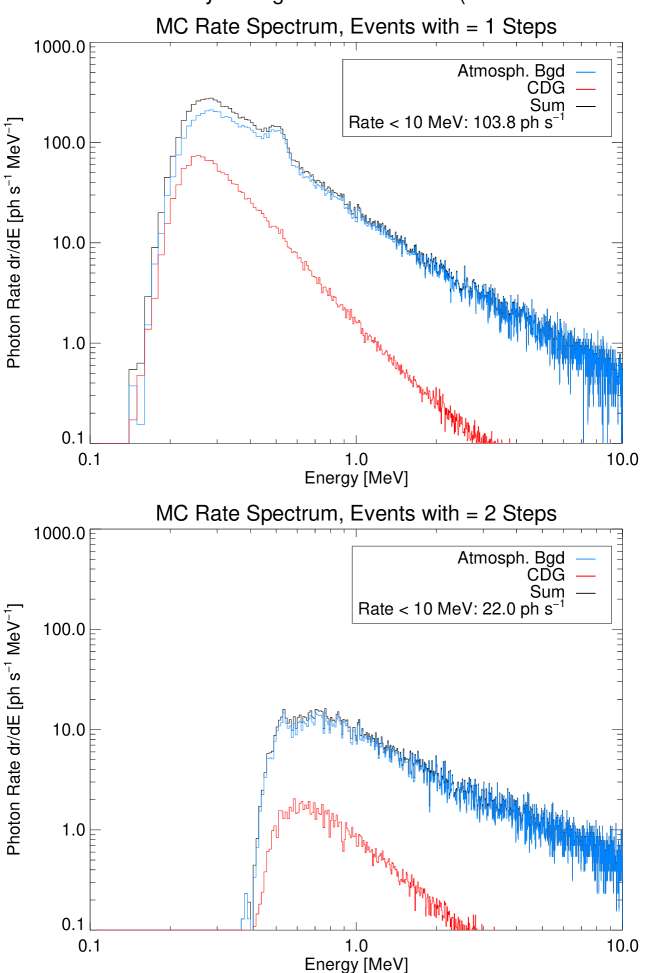
To fully understand the measured background rate in LXeGRIT in the May 1999 flight, we need to finalize the analysis of all the data and we need to study further all possible contributions to the measurement. Monte Carlo simulations of the detector’s response to a variety of background sources are under way, using a detailed mass model of the instrument within the simulation package GEANT [9] . The estimated contribution to the -ray background from the atmosphere and from the cosmic diffuse background is about 160 Hz in the sensitive LXe volume, increasing to 650 Hz if interactions in the passive LXe are included. These estimates are for events with a minimum energy deposition of 100 keV in each interaction. For the contribution from the cosmic diffuse -ray background, mainly entering through the instrument’s aperture, we used the flux given by [8] . For the dominant atmospheric background, we used an approximated continuum description of the flux by [10] , extrapolating the given fluxes down to 100 keV and up to 15 MeV. The resulting spectra of -ray interactions are shown in Fig. 14 for single-step (top panel) and multiple-step events (bottom panel). These Monte Carlo simulations have taken into account the measured LXeTPC energy and position resolutions, as well as a minimum energy threshold, which for the results shown in Fig. 14, was taken as 150 keV. They did not take into account, however, trigger efficiency and its energy dependence, data taking and reconstruction efficiencies. The impact of these selections has to be studied before a meaningful comparison with the flight data, since both the spectral shape and the contribution of events with single and multiple interactions are affected. It is clear, however, that the observed ratio of single to multiple interaction events is much higher than predicted from the simulations of atmospheric and diffuse background.

It is well known that -rays other than from atmospheric and diffuse background cannot be neglected. These notably include background -rays and beta decays from activity in all instrument materials initiated by albedo protons and neutrons as well as by locally produced neutrons. To study the impact of hadron interactions in the LXeGRIT payload, we have modified our Monte Carlo simulations code to include the transport of neutrons. The mass model, previously developed for the -ray simulations, has been refined to reflect the presence of all materials relevant for neutron interactions. We use the GEANT package together with GCALOR, an interface to the CALOR hadron simulation package [11] . Atmospheric neutrons from thermal energies up to 100 MeV have been propagated through the payload, registering all neutron capture reactions. Measured atmospheric neutron fluxes and distributions have been collected from the literature, e.g. [12] . As described in Section 2.3, the back shields consist of pure NaI crystals, while the side shields consist of crushed NaI immersed in a liquid scintillator, a good neutron moderator. Since two xenon isotopes (out of nine stable isotopes) have large thermal neutron cross sections, namely b for 131Xe with an abundance of 21.2% and b for 129Xe (26.9%), production of thermal neutrons around the LXeTPC is of concern. It turns out, however, that the fraction of neutron captures within the xenon (34 Hz in the active volume and 89 Hz in the passive volume) is relatively small compared to the total estimated capture rate of 3.4 kHz. This rate is dominated by captures within the shield system, with kHz in the side shields and Hz in the back shields. The remaining capture rate is found in the stainless steel body of the detector. Work is currently underway to model the -ray cascades and radioactive decays following the captures, in order to ultimately assess the rate and spectrum of -rays expected in the chamber. We have also started to study fast neutron reactions such as elastic neutron scatters, (n,p)-reactions, etc.
In fact, the rate on all the shield units, shown in Fig. 15, gradually increase with time. This effect is apparently consistent with activation of NaI, and with the build-up of radioactive nuclei such as 24Na with a halflife of 15 h. In addition, three sections of the side shields showed excessive rates at float altitude, which required to raise their thresholds. This rendered a large part of the side shield essentially passive below several 100 keV, such that a significant number of low-energy gamma-rays may have leaked into the LXeTPC without veto. Also shown in the same Fig. 15, is the rate measured in the plastic scintillation counter above the LXeTPC. The average rate which remains constant to about 3kHz, at float altitude, is consistent with the expected cosmic rays rate on this 1600 cm2 counter. This number also agrees with the estimate obtained from subtracting the TPC rate within the discriminator window from the total rate above the lower discriminator threshold.
4 Conclusions
The May 7, 1999 balloon flight of LXeGRIT verified a good performance of this instrument in the near space environment. A total of about 300000 events were accumulated during the 9 h flight. The presumably fragile LXeTPC structure and its support systems not only survived the flight, but also the rough landing conditions with a parachute and the 350 miles transport back to the launch base. The detector, still filled with LXe, showed a similar signal response on all wires and anodes as before launch. Analysis of the data from the May ’99 flight, while still in progress, shows that the main goal of the background measurement at balloon altitude in this new Compton telescope has been achieved. The in-flight background spectrum is dominated by single interaction events below about 600 keV, partly due to the trigger conditions used for the flight data taking. The impact of all possible sources to the measured background is being studied with Monte Carlo simulations using a realistic instrument mass model.
ACKNOWLEDGMENTS
We would like to thank the NSBF team for excellent support throughout the flight campaign. Support for the LXeGRIT project is provided by NASA High Energy Astrophysics Division SR&T program under grant NAG5-5108.
References
- [1] Aprile E., et al., 1989, SPIE Vol. 1159, 259
- [2] Aprile E., et al., 1989, IEEE Vol.36 No.2
- [3] Aprile E., et al., 1991. NIM A 302, 177
- [4] Xu F., Ph.D. Dissertation Thesis, Columbia University, 1998
- [5] Dunphy P.P., et al., 1989, NIM A 274, 362
- [6] Aprile E., et al., 1998, NIM A 412, 425
- [7] Aprile E., et al., 2000, SPIE Conference Proceedings, Vol. No. 4140
- [8] Schönfelder V., et al., 1980, ApJ 240, 350
- [9] GEANT: http://wwwinfo.cern.ch/asd/geant/index.html
- [10] Costa E., et al., 1984, ApSS 100, 165
- [11] GCALOR: http://wswww.physik.uni-mainz.de/zeitnitz/gcalor/gcalor.html
- [12] Preszler A.M., 1976, JGR 81(25), 4715