Imaging Markarian 348 and its water maser flare
MERLIN imaging of the maser flare in Markarian 348
Abstract
MERLIN images of Mrk 348 at 22 GHz show H2O maser emission at 0.02 – 0.11 Jy, within pc of the nucleus. This is the first direct confirmation that molecular material exists close to the Seyfert 2 nucleus. Mrk 348 was observed in 2000 May one month after ? first identified the maser in single-dish spectra. The peak maser flux density has increased about threefold. The masing region is pc in radius. The flux density of radio continuum emission from the core has been rising for about 2 years. The maser-core separation is barely resolved but at the significance level they are not coincident along the line of sight. The masers lie in the direction of the northern radio lobes and probably emanate from material shocked by a jet with velocity close to . The correlation between the radio continuum increase and maser flare is explained as arising from high level nuclear activity through a common excitation mechanism although direct maser amplification of the core by masers tracing a Keplerian disc is not completely ruled out.
keywords:
masers - galaxies: individual (Markarian 348) - galaxies: nuclei - galaxies: Seyfert - radio lines: galaxies - radio continuum: galaxies1 Introduction
Water maser emission has been detected from galaxies up to Mpc from Earth. These supermasers are hundreds of times more luminous than the brightest masers in star-forming regions in our own Galaxy (?). Such bright spectral lines are ideal targets for very long baseline radio interferometry with micro-arcsec accuracy and with km s-1 velocity resolution. This is the only way to image distant galaxies directly on sub-pc scales.
H2O supermasers are found exclusively in about 5% of type 2 Seyfert and LINER galaxies (?). The unified scheme predicts that these active galactic nuclei (AGN) are obscured by a molecular torus viewed edge on. This provides high column densities for maser amplification (?). Such masers have been used to measure the parameters of nuclear discs in Keplerian rotation (e.g. ?). It is less obvious why the selection effect applies to supermasers which appear to be associated with a jet instead of a circumnuclear disc (e.g. ?). These masers could originate from interstellar material shocked by the jet (?).
? reported the discovery of a very luminous H2O maser in Mrk 348 during a radio flare of the AGN. Mrk 348 is a well studied Seyfert 2 at a redshift of 0.015 (?), with broad emission lines in polarized light (?). However its host is an S0 galaxy at an angle of inclination of only (?). Ground-based (?) and HST (?) imaging have revealed a dust lane crossing the nucleus. It has a high x-ray-absorbing column depth of N m-2 towards the nucleus (?). These observations suggest the presence of an obscuring torus in Mrk 348, but no molecular or H I absorption has been detected so far (?; ?).
In this paper all velocities are given relative to the local standard of rest () in the radio convention. The systemic of Mrk 348 is km s-1 from Hi emission line observations (?) and imaging (?). We adopt = 75 km s-1 Mpc-1, so Mrk 348 is at a distance of Mpc, where 1 mas = 0.29 pc.
What makes Mrk 348 stand out among Seyfert galaxies is its bright and variable inverted-spectrum radio nucleus (?). Jets at position angles (p.a.) and were observed with the EVN at 1.4 GHz (?) and MERLIN at 5 GHz (?). ? first resolved the central part of Mrk 348, using the VLBA at 15 GHz, into two components separated by pc at p.a. to the larger 1.4 GHz jet. ? measured the sub-relativistic separation rate of these two components at the same frequency. They also noted a rise in continuum flux from 120 to 570 mJy between 1997.10 and 1998.75. Using MERLIN we can detect mJy radio continuum with a surface brightness K and locate bright masers with sub-pc relative positional accuracy. We use this to investigate the relationship between the maser and continuum flares and their origins in the core or in a nascent jet.
2 Observations and data reduction.
We observed Mrk 348 on 2000 May 2 using MERLIN, which has a maximum baseline of 217 km, giving a beam size of 12 mas. In order to obtain images of Mrk 348 as rapidly as possible we observed for a single 17 hr run in the maximum 16 MHz bandwidth, which corresponds to a total velocity width of km s-1 and only covers the red-shifted half of the line seen by ? plus sufficient line-free channels for continuum subtraction. We observed Mrk 348 at a fixed frequency of = 21891.6 MHz alternately with phase reference source J0057+3021 for 4 and 2 min respectively. 3C273, which had a flux of 21.09 Jy at that time (Teräsranta, private communication), was observed for 40 min and used to set the flux scale for all sources.
Further data processing was performed using aips (?). We applied the instrumental corrections from the calibrators and the phase reference source solutions to Mrk 348. We then adjusted the data to a constant velocity, putting = 4641.6 km s-1 in channel 30 of 60 usable channels, with a separation of 3.37 km s-1. We averaged all data for Mrk 348 and made a clean map using natural weighting of the visibility data, which gave a beam size of 31 mas 21 mas.
The three clean components (cc) above from the initial map of Mrk 348 lay in a region 6 by 18 mas elongated north-south. We used these as a model for phase self-calibration, applied the solutions and examined the spectrum of Mrk 348. The complex visibilities were vector averaged in time channel by channel. The flux density increased noticably with increasing frequency if we used the more southerly cc positions as the origin of phase. Fig. 1 shows the spectrum on the baselines to the Cambridge antenna using the mean position of the maser emission (Table 1) as the phase origin. The low-frequency end of the band appeared to be continuum only. We used the first 4.25 MHz of data for phase and amplitude self-calibration and applied the same corrections to the line-only data as we did for the continuum data.
The multi-channel Mrk 348 data were averaged over every 0.75 MHz and Fourier transformed to make a 20-channel total emission dirty data cube. The average of the first 4.50 MHz was subtracted pixel by pixel from the whole cube to leave a line-only dirty data cube which was cleaned to produce a clean line-only cube. The line-only dirty data cube was subtracted from the total emission dirty data cube and the result was cleaned to give a continuum-only cube. We also made a clean total emission cube.
We fitted 2D Gaussian components to emission above in each channel of every clean cube to determine the position and peak flux . We also measured the position and flux density of components fitted to the total flux from Mrk 348 mapped using 15-MHz band-width prior to self-calibration and the 4.25-MHz bandwidth self-calibrated continuum map. The brightest continuum components was resolved after deconvolving the beam, so we could measure its FWHM and the integrated flux . The position and component size uncertainties (, ) are proportional to the beam-width divided by the signal-to-noise ratio allowing for the sparse baseline coverage (?; ?).
All maps are presented in total intensity. The flux scale should have error but MERLIN only has 5 antennas operating at 22 GHz, and the sparse coverage means it is possible for extended continuum emission to appear brighter and more compact than it actually is, although the peak positions should be accurate. Moreover as only one side of the bandpass is line-free, errors in baseline subtraction or bandpass calibration may affect the maser flux measurements. The absolute position accuracy is mas, mostly due to uncertainty in the position of J0057+3021 (?).

3 Results
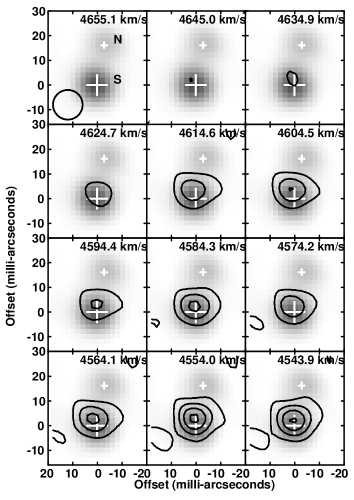
A single patch of maser emission was detected in 11 channel maps of the line-only data cube from 4543.8 to 4655.0 km s-1, shown by the contours in Fig. 2. These are in linear multiples of . The grey-scale shows the continuum-only emission above . The continuum peaks are marked N and S and the white crosses show their positions, which agree in each channel to within 0.1 mas.
The positions and flux densities of the peaks are given in Table 1. The peak of the maser emission is consistently offset from the continuum peak; its mean position M̄ is mas north of S. The total angular size of the maser region is mas and the individual components are unresolved. There is no significant systematic angular separation-velocity gradient greater than 2 mas in 111 km s-1. S appears to be resolved, and was fitted with a component of mas FWHM and an integrated flux of 814 mJy giving a brightness temperature of 551 – 824 K. N is at a position angle of with respect to S.
| Peak | R.A. | Dec. | (mas) | (mJy beam-1) | (mJy beam-1) |
|---|---|---|---|---|---|
| S | 00h 48m 4714575 | +31° 57′ 251128 | 0.2 | 744 | 6 |
| N | 00h 48m 4714552 | +31° 57′ 251470 | 0.4 | 239 | 6 |
| \a=M | 00h 48m 4714580 | +31° 57′ 251155 | 0.7 | 24 – 107 | 8 |
The maps of continuum-only channels from 21884.35 to 21888.60 MHz, the continuum+line channels from 21890.85 to 21899.10 MHz and line-only channels from 21890.85 to 21899.10 MHz were averaged from their respective data cubes. Flux measurements along slices through these averaged maps, at constant R.A., 2 mas wide, intersecting the position of S, are plotted in Fig. 3. This shows the offset of the maser peak from the brighter continuum peak.

4 Discussion
These observations are the first direct detection of molecular material in the nuclear region of Mrk 348. The existence of H2O implies shielding by a dusty medium with a column density m-2 and the conditions required for population inversion of the maser include a gas number densitity m-3, a fractional abundance of H2O and a temperature K (?). Conditions can be more tightly constrained depending on the association of the masers with a disc or a jet.
We assume that the brightest 22-GHz continuum component S contains the core and 2-mas northern jet at position angle found by ? at 15 GHz. N is in a similar direction to the more extended jet detected at 1.4 and 5 GHz (?; ?).
We consider three possible models for the relationship between the maser flare and the continuum flare:
-
1.
The masers trace a small warped disc and the maser emission follows a Keplerian rotation law, and the masers directly amplify the continuum emission.
-
2.
The masers are unsaturated and lie in a symmetric Keplerian nuclear disc. Perturbation of the disc creates spiral shocks (?) that are also responsible for the continuum flare.
-
3.
The radio continuum flare is associated with the ejection of material in the direction of the northern jet. The masers arise from the ISM where it is shocked by the jet.
Below we expand on the models and explain why we prefer or reject each.
The ratios of the peak fluxes April:May are 27:77 at 4604 km s-1 and 26:107 at 4544 km s-1, a 3 – 4-fold increase. Although further observations are essential in order to pin down the source timescale, such rapid variability may suggest that the individual masing clouds are less than 1 light-month (0.025 pc) in diameter. This would then be about half the size of the 15-GHz core (?) and so the maser emission that is beamed in our direction is compact enough to originate from maser clouds that overlap our line of sight to the core. However the two arrows in Fig. 1 indicate the velocities of the peaks that ? observed and which are close to the peaks in our data, but km s-1 more redshifted than . ? did not detect any maser emission at . So explanation (1) is inconsistent with a Keplerian disc unless the masing material is infalling. Moreover the maser peak is consistently misaligned with S in every channel in Fig. 2. The position error boxes for M̄ and S (Table 1) are too close to rule out direct maser amplification of the continuum peak, but we consider other geometries are more probable.
? found a tendency for the red-shifted emission from disc supermasers around AGN to be brighter and explained this using a model of spiral shocks within a Keplerian disc. This mechanism requires perturbation of the disc, which could be connected to the event which caused the continuum flare. Such a disc should be symmetric about the nucleus with a well-defined position-velocity gradient. If it is nearly edge-on the rotation velocity is km s-1. The MERLIN results show the velocity gradient is mas in 111 km s¡-1 corresponding to a disc radius pc. M̄ is pc north of S. This is consistent with the yr time-lag between detection of the maser and continuum flares which implies a separation of pc (?). This implies that if the masers lie in a symmetric disc it is elongated north-south, parallel to the radio jets. This is unlikely and so model (2) is also improbable.
Model (3), in which the masers originate in a shock produced by the northern jet, is possibly due to the misalignment of the nuclear disc with respect to the host galaxy. If this material was ejected from the core when the continuum flare commenced 2 years prior to the maser flare this implies speeds near . The only previous detection of a relativistc Seyfert jet is in III Zw 2 (?). However ? measured a jet speed of for Mrk 348 on similar scales suggesting the jet power is rapidly dissipated once it reaches the shocked region.
If the maser flare is not simply direclty amplifying the radio continuum flare this indicates that there is some common excitation effect, possibly some sort of high level nuclear activity. If the masers the masers are found along the radio jets, as is the case for NGC 1052 (?), this mechanism for the correlation between the evolution of the maser flare and the radio flare is an important tool to study the jet-ISM interactions.
We have observed the newly discovered megamaser Mrk 348 with MERLIN at 22 GHz in order to study the masers at higher resolution, test whether there is a correlation between the continuum and maser flux density and investigate their origin in the core or jet, which could give us some more insight to the maser excitation mechanism. Further imaging observations of the whole line will distinguish between these possibilities and elucidate the origins of the flare.
5 Acknowledgements
We would like to thank our referee Dr. Huib Jan Van Langevelde for many constructive comments. MERLIN is the Multi Element Radio Linked Interfermometer Network, a national facility operated by the University of Manchester at Jodrell Bank Observatory on behalf of PPARC. We thank the MERLIN staff for performing the observations, and Peter Thomasson, Simon Garrington and Tom Muxlow for useful discussions. We are grateful to Phil Diamond, Alan Pedlar and Alison Peck for very helpful contributions to this paper. This research was supported by European Commission, TMR Programme, Research Network Contract ERBFMRXCT96-0034 “CERES”.
References
- [Bottinelli et al.¡1990¿] Bottinelli L., Gouguenheim L., Fouque P., Paturel G., 1990, A&AS, 82, 391
- [Braatz et al.¡1997¿] Braatz J. A., Wilson A. S., Henkel C., 1997, ApJ, ApJS, 321
- [Brunthaler et al.¡2000¿] Brunthaler A., Falcke H., Bower G. C., Aller H., Teräsranta H., Lobanov A. P., Krichbaum T. P., Patnaik A. R., 2000, A&A, 357, L45
- [Claussen et al.¡1998¿] Claussen M. J., Diamond P. J., Braatz J. A., Wilson A. S., Henkel C., 1998, ApJ, 500, L132
- [Cohen¡1998¿] Cohen R. J., 1998, in Andersen J., ed, Highlights of Astronomy Vol. 11A. Kluwer, p. 938
- [Condon et al.¡1998¿] Condon J. J., Cotton W. D., Greisen E. W., Yin Q. F., Perley R. A., Taylor G. B., Broderick J. J., 1998, AJ, 115, 1693
- [Elitzur et al.¡1992¿] Elitzur M., Hollenbach D. J., McKee C. F., 1992, ApJ, 394, 221
- [Falcke et al.¡1998¿] Falcke H., Wilson A. S., Simpson C., 1998, ApJ, 502, 199
- [Falcke et al.¡2000¿] Falcke H., Henkel C., Peck A. B., Hagiwara Y., Almudena Prieto M., Gallimore J. F., 2000, A&A, 358, L17
- [Gallimore et al.¡1999¿] Gallimore J. F., Baum S. A., O’Dea C. P., Pedlar A., Brinks E., 1999, ApJ, 524, 684
- [Greisen¡1994¿] Greisen E., ed, 1994, AIPS Cookbook. NRAO, Charlottesville, VA 22903-2475, USA
- [Halkides et al.¡1997¿] Halkides D., Ulvestad J., Roy A., 1997, BAAS, 29, 1375
- [Huchra et al.¡1999¿] Huchra J. P., Vogeley M. S., Geller M. J., 1999, ApJS, 121, 287
- [Kartje et al.¡1999¿] Kartje J. F., Königl A., Elitzur M., 1999, ApJ, 513, 180
- [Maoz & McKee¡1998¿] Maoz E., McKee C. F., 1998, ApJ, 494, 218
- [Miller & Goodrich¡1990¿] Miller J. S., Goodrich R. W., 1990, ApJ, 355, 456
- [Miyoshi et al.¡1995¿] Miyoshi M., Moran J., Hernstein J., Greenhill L., Nakai N., Diamond P., Inoue M., 1995, Nat, 373, 127
- [Neff & de Bruyn A G¡1983¿] Neff S. G., de Bruyn A G, 1983, A&A, 128, 318
- [Richards et al.¡1999¿] Richards A. M. S., Yates J. A., Cohen R. J., 1999, MNRAS, 306, 954
- [Simkin et al.¡1987¿] Simkin S. M., van Gorkom J., Hibbard J., Hong-Jun S., 1987, Science, 235, 1367
- [Simpson et al.¡1996¿] Simpson C., Mulchaey J. S., Wilson A. S., Ward M. J., Alonso-Herrero A., 1996, ApJ, 457, L19
- [Ulvestad et al.¡1999¿] Ulvestad J. S., Wrobel J. M., Roy A. L., Wilson A. S., Falcke H., Krichbaum T. P., 1999, ApJ, 517, L81
- [Unger et al.¡1984¿] Unger S. W., Pedlar A., Neff S. G., de Bruyn A. G., 1984, MNRAS, 209, 15p
- [Warwick et al.¡1989¿] Warwick R. S., Koyama K., Inoue H., Takano S., Awaki H., Hoshi R., 1989, PASJ, 41, 739
- [Wilkinson et al.¡1998¿] Wilkinson P. N., Browne I. W. A., Patnaik A. R., Wrobel J. M., Sorathia B., 1998, MNRAS, 300, 790