The ASCA Catalog of Potential X-Ray Counterparts of GeV Sources
Abstract
We present a catalog of 2-10 keV ASCA Gas Imaging Spectrometer images of fields containing bright sources of GeV emission. The images cover of the 95% confidence position contour for 28 of the 30 sources with GeV fluxes above ph . We find an excess of hard X-ray sources with ergs positionally coincident with unidentified sources of GeV emission. We comment on radio-loud and radio-quiet pulsar candidates, as well as several SNR and massive binaries as possible sources of the GeV emission. We also find evidence for a class of variable ray sources associated with extended regions of hard X-ray emission, and propose that for these sources, a significant percentage of the ray emission is generated in synchrotron nebulae surrounding fast, young pulsars.
1 Introduction
Despite more than 20 years of study, the majority of bright, high energy ray sources along the Galactic plane have yet to be identified with lower energy counterparts. With the life of the EGRET instrument on CGRO now over, nearly 300 sources have been detected and catalogued above 100 MeV. At high Galactic latitudes (), approximately 70-90 of these sources have been identified with a sub-class of radio-loud active galactic nuclei (AGN) called blazars (Hartman et al., 1999). At low latitudes (), 7-8 sources have been identified as young, rapidly spinning pulsars. In addition, there is a source associated with the LMC, and a detection of a solar flare. The rest of the sources have no firm identifications, but can be split into at least three components. First, there is an isotropic component which is likely to consist largely of blazars with slightly lower radio fluxes than the ones already identified (since most of the brightest sources have already been identified). There is an excess of sources at mid-latitudes (), making up a second component, which has been suggested to be associated with the Gould Belt (Grenier, 1998), with some indication of an additional component associated with the Galactic halo. Finally, there is a population which is highly concentrated along the Galactic plane, and is our main concern here.
Spectral studies (Merck et al., 1996) suggest a need for additional source classes. In particular, there are many sources with steeper spectra (photon index ) between 100 MeV and 1GeV than is expected for either a pulsar or a blazar. In addition, variability studies (McLaughlin et al., 1996; Tompkins, 1999) indicate an excess of variable sources at low Galactic latitudes. Since pulsars are not thought to be variable, this would suggest an additional class of Galactic sources. However, for any individual source to represent a new source class, it would first have to be demonstrated that it is not a blazar, which are highly variable.
The main obstacle to identification has been the large positional uncertainties of the sources. Low counting rates combined with a broad, energy-dependent point-spread function (PSF) produce typical 95% error contour sizes of . Additional problems are encountered in the Galactic plane, where sources are often confused and the diffuse background is strong. Background models are based on radio maps which are not sensitive to small scale structure, causing additional uncertainty. However, the Galactic background spectrum steepens at energies above 1GeV and the EGRET PSF narrows with increasing energy. Therefore, sources with significant counts above 1 GeV are less prone to the systematic positional errors associated with sources in the Galactic plane if the improved resolution of the high energy photons is included in the analysis. Unfortunately, the standard analysis of EGRET data uses a binned likelihood approach, where all the photons are assumed to have the same PSF derived by averaging over the energy range using an assumed spectrum, so the additional information to be gained from the photon energy is lost. In the third EGRET catalog (Hartman et al., 1999), this issue was partially addressed by the generation of liklihood test statistic maps for positional determination in three energy ranges: MeV, MeV, and MeV, and the map that gave the best positional determination was used (in the case of some of the stronger sources, the MeV and MeV maps were combined). However, the source candidate list used was generated only from the MeV maps.
The purpose of this work is to begin the process of systematically identifying potential low energy counterparts of the unidentified ray sources (for a more thorough treatment of one source, GeV J1417-6100, see Roberts and Romani 1998; Roberts et al. 1999; Roberts 2000). To start, we note a few observational facts about the known source classes. First, they all emit non-thermal X-rays. The blazars are moderately bright ( ergs in the 2-10 keV band) X-ray point sources with power law spectra. They are also bright ( Jy at 5 GHz), compact, radio sources. Their emission is highly variable at most wavelengths.
Pulsars can be faint( ergs ) or bright ( ergs in the case of the Crab) sources of non-thermal X-rays. The magnetospheric component of this flux is strongly pulsed. Additional X-ray and/or radio emission may come from a surrounding wind nebula. There may also be a thermal X-ray component from the pulsar surface or a surrounding SNR. Pulsars tend to have very steady emission at most wavelengths (save for the pulsations).
There are several other proposed sources of GeV emission, most notably supernova remnants accelerating particles through shocks with either the interstellar medium or a nearby molecuar cloud (cf. Pohl and Esposito 1998). The particle spectrum predicted by these models could produce significant synchrotron emission in the X-ray region, depending on the age of the SNR and on the magnetic field and density of the SNR and surrounding region. Non-thermal X-ray emission has been observed in the SNR IC443 (Keohane et al., 1997), suggesting it as a potential source of this class. However, this class of objects would not be expected to produce variable emission unless the site of the shock was highly localized, and the ability to separate this emission from potential emission from an embedded pulsar is generally not possible without better ray resolution. Other suggested sources of particle acceleration through shocks, such as interacting winds of massive binary stars (Eichler and Usov, 1993), or the wind off of a supermassive star (Volk and Forman, 1982), would also be likely to produce hard X-ray emission at some level. The more localized nature of the emission would make variable emission feasible.
Another proposed source class of -ray emission is isolated rotating black holes accreting from the interstellar medium (Punsly, 1999a; Armitage and Natarajan, 1999). This class is attractive since it is expected to be variable on all time scales. However, the emission mechanisms are not well developed, and predictions of the ratio of X-ray to -ray emission are hard to make.
Several studies (Yadigaroglu and Romani, 1997; Kaaret and Cottam, 1996) have shown the Galactic unidentified EGRET sources to be associated with regions of star formation. In particular, the distribution of low latitude EGRET sources is strongly correlated with SNR and OB associations, which supports the above proposals for new source classes. However, young pulsars are also found near SNR and OB associations, so the statistical studies in and of themselves do not require the existence of a new source class. From an observational viewpoint, since the sources are near regions of star formation, they are likely to be even more heavily obscured by gas than is typical for sources in the Galactic plane. This reinforces the need for X-ray observations above 2 keV.
In order to search for (or rule out) potential counterparts, we have obtained observations of the brightest GeV sources with the ASCA satellite (Tanaka, Inoue, and Holt, 1994). We will primarily focus on the Gas Imaging Spectrometer instruments (GIS2 and GIS3)(Ohashi et al., 1996), whose good sensitivity out to 10 keV and large field of view (44’) are well suited for finding potential counterparts.
2 Source Selection and Ray Analysis
We base our source selection on the GeV source catalog of Lamb and Macomb (1997, hereafter LM). Through a combination of archival and new pointings, we have obtained ASCA GIS images of every field containing a source with a ray flux above 1 GeV greater than , and all but 1 of the unidentified sources (GeV J1814-1228) and 1 blazar (PKS 1622-297) with fluxes above . This flux limit corresponds to the “bright” sources of LM. While most of these sources are also listed in the third EGRET (3EG) catalog (Hartman et al., 1999), several are not, even though they are quite significant at GeV energies. The 3EG catalog is based on sources found to be significant in a binned likelihood analysis of all photons above 100 MeV detected by the EGRET telescope, while LM used only those photons above 1GeV. Of the unidentified sources in this study, the GIS fields cover of the error contours, and virtually all of the contours. The coverage of each individual source is listed in Table 1.
This focus on sources with significant GeV emission will tend to select out pulsar candidates, which are expected to have relatively flat ray emission out to several GeV (cf. Romani 1996). It also limits the number of potential unidentified blazars in the survey. Of the 30 sources in LM that make our flux cut, only 6 are at Galactic latitudes , 5 of which are known blazars. Our expectation of the number of additional blazars in the survey is .
The LM catalog was derived solely from the GeV count maps. However, nearby sources which are significant in MeV maps but not in the GeV maps can still produce enough GeV photons to bias a position towards the softer source if it is not included in the fit. In addition, the elliptical fit to the error contour is often not a good approximation. Therefore, we feel the LM localizations are not adequate in many cases.
Most of the GeV sources are in the 3rd EGRET catalog, and for many of these, we have used the likelihood test statistic (TS) maps available from the on-line catalog to generate the positional contours on our images. Most of the maps used are based on 1GeV and above photons. In four cases (GeV J0008+7304, GeV J0241+6102, GeV J1837-0610, and GeV J1856+0115) we used the MeV positional contours which were fully consistent with the GeV contours, but better constrained. Several sources are not in the 3EG catalog, mis-identified, have only low-energy maps, or are near sources not in the 3EG catalog (such as in the Cygnus region). For these we generated new TS maps, using the like program of John Mattox and Joe Esposito (jaelike5.49, Mattox et al. 1996), on maps of 1GeV and above photons. We included in the fits all nearby sources in the 3 list (courtesy R. Hartman) which was used to create the 3rd EGRET source catalog. The fluxes derived from these fits are systematically lower than in LM, since a portion of the GeV photons may be assigned to the softer sources which were not included in the LM fits. Where we have refit the data, we use the fluxes derived from those fits. Otherwise, we use the LM values. These are listed in Table 2. As a consistency check, we have also examined the TS maps of Macomb and Lamb (2000), which only included sources which had a significance in the GeV maps for the positional fits. In general, the fits were similar except for noticable changes in contour shape of some of the sources with soft sources nearby, as expected. The 3EG catalog lists photon spectral indices, and for those sources with firm 3EG ids (see Table 1), we have included those values in Table 2.
All of the 3EG sources were searched for variability by Tompkins (1999), using the statistic, which is the standard deviation of the flux divided by the average flux, and hence a measure of how variable a source is (as opposed to the more usual test, which measures how inconsistent a source’s flux is with being constant). The individual flux measurements used to determine were derived from 3 parameter fits to the entire unbinned likelihood distribution of the flux above 100 MeV. A flux was derived for each viewing period ( two weeks) where the source was within of the pointing center. Therefore, the timescale of the variability probed is month – years. The pulsars all tend to have , consistent within systematic uncertainty with 0, while blazars tend to . Extreme caution should be used when interpreting the variability of sources in crowded regions, since the likelihood analysis may occasionally misassign photons, resulting in time bins with anomolously high or low fluxes. In addition, variability in a nearby source may result in an apparent variability of the source of interest. With these warnings, the values, where available, are also listed in Table 2.
3 X-ray Observations
Table 1 gives the observing parameters of all the fields in our survey. The observations were taken over several years, with differing exposure times. Some of the archival observations had the GIS in modes with limited spectral or spatial resolution and the imaging and spectral analysis was adapted accordingly. In a few cases, the SIS data were also used. Ten of the images were obtained specifically for this campaign. In these cases, the pointings were based solely on the GeV positions. Positional and spectral information on X-ray sources found in these fields are given in Table 3. Some of the pointings were based on LM97 values, and subsequent positional fits have resulted in a significantly shifted error contour.
Stellar sources with soft spectra are common in the plane, and can be quite bright below 2 keV, but are generally undetectable above 2 keV. In addition, the sources we are searching for are likely to be behind fairly high hydrogen column depths, and are expected to have hard, synchrotron spectra. To make these sources more apparent, we produce 2-10 keV images.
For this work, we used the standard rev 2 processed data. This only aspects the inner of the image, and region filters are applied to remove the calibration source and the outer edges where there is poor aspecting. Processing was mainly done using the and packages available from the HEASARC, while image compositing and display were done using the and packages available from the ATNF (Sault and Killeen, 1998; Gooch, 1995).
3.1 X-Ray Imaging
As mentioned above, our primary instruments for this work are the two Gas Imaging Spectrometers on board the ASCA satellite. The effective area of these instruments is strongly dependent on both energy and position on the detector. If an exposure correction is not applied, broad diffuse artifacts will occur in the image from the general radial dependence of the instrument, with sharp features due to the grid support structure. The specific pattern is energy dependent and the artifacts tend to be stronger at higher energies. It is therefore necessary to create an exposure map based on the spectrum of the X-ray field. In principle, this could, and would, vary across the field from different sources at different positions. However, our primary purpose is the detection of sources above the relatively smooth Galactic background. We therefore chose a relatively blank field at a typical Galactic position to derive our field spectrum (an observation of , which is at and has virtually no emission above 2keV, worked well for this purpose). Note that this is not ideal for fields dominated by a large, extended source with a spectrum significantly different from the background, such as is the case of fields with a bright, thermal, SNR. The ftool ascaeffmap was initially used to derive an efficiency map from this spectra based on ground calibrations of the detectors. This was then used in the ascaexpo tool created by Eric Gotthelf to build up an exposure map in sky coordinates by using the individual observations attitude file to calculate how much time each detector pixel would contribute to each sky pixel.
When the resulting exposure map was divided into the image map, it was found to overcorrect the image in the center. There are two reasons for this. The first is that the GIS detectors are sensitive to the particle background, which tends to be brightest towards the edges of the detector, in opposition to the exposure effects. We therefore used the night earth calibration observations with identical screening as our images, normalized their exposure, and ran it through ascaexpo to create sky particle maps with exposures identicle to the images. We used these to subtract off the particle contribution of the images, before applying exposure corrections. The second cause is the scattering of X-rays onto the detector from regions outside the field of view, which causes an apparent enhancement in the background towards the edges of the detectors. Since we are interested in having as flat of a background as possible in order to be confident that any structure we see is real, we created an efficiency fudge map by subtracting the particle background from the deep blank sky images provided by the ASCA GOF, dividing by our model efficiency map derived from the ascaeffmap tool, and then highly smoothing it to show only the broad effects of the scattered light. This fudge map was then multiplied by the original efficiency map which gave us a final detector efficiency map whose fine structure was based on the Galactic plane spectrum, but which has broad structure to suppress scattered light from an assumed flat background.
One effect of the exposure correction on low count rate fields is the enhancement of noise at the edges of the fields where the exposure drops off suddenly. Pixels containing photons will have apparent fluxes greatly exaggerated when divided by a relatively low exposure. This is especially noticeable if there is a source just outside the field of view, increasing the amount of light scattered onto the field edge. To minimize these edge effects, we trim the exposure maps so as to blank the image once the exposure drops below a threshold. Even so, edge artifacts are still apparent in many of the images, so apparent emission near a field edge, even in composited images, should be viewed with skepticism.
The steps used to make an image are then as follows: 1. create photon, particle background, and exposure maps; 2. subtract the background from the photon map; 3. sum the gis2 and gis3 photon and exposure maps, and, if there is more than 1 field, composite the photon maps and exposure maps separately; 4. trim the exposure maps; 5. divide the summed photon maps by the summed exposure maps to create intensity maps; 6. smooth the intensity maps with a pixel Gaussian, which roughly corresponds to the core width of the PSF. In addition, the coordinate offsets derived by Gotthelf et al. (2000) to correct for the temperature dependent deviation in the attitude solution were applied. Source positions for point-like sources were derived from centroiding. Positional errors are dominated by systematic uncertainties, estimated to be about for sources within the central of the detector. Sources toward the edges of the detector have additional uncertainties of as they approach the detector edge. We note these in Table 3. The faintest sources may also have additional systematic errors due to source confusion. Positions of extended sources are the center of the extraction regions used for spectral fitting, or of the peak emission if there is a significant peak.
The images are shown in Figure 1. A few sources are dominated by thermal emission from a bright supernova remnant, in which cases we also show 4-10 keV images. Scattered light from very bright sources can contaminate fields over 1 degree away from the source, appearing as diffuse emission with linear features. Two (possibly three) of the images are affected by this.
![[Uncaptioned image]](/html/astro-ph/0012304/assets/x1.png)
![[Uncaptioned image]](/html/astro-ph/0012304/assets/x2.png)
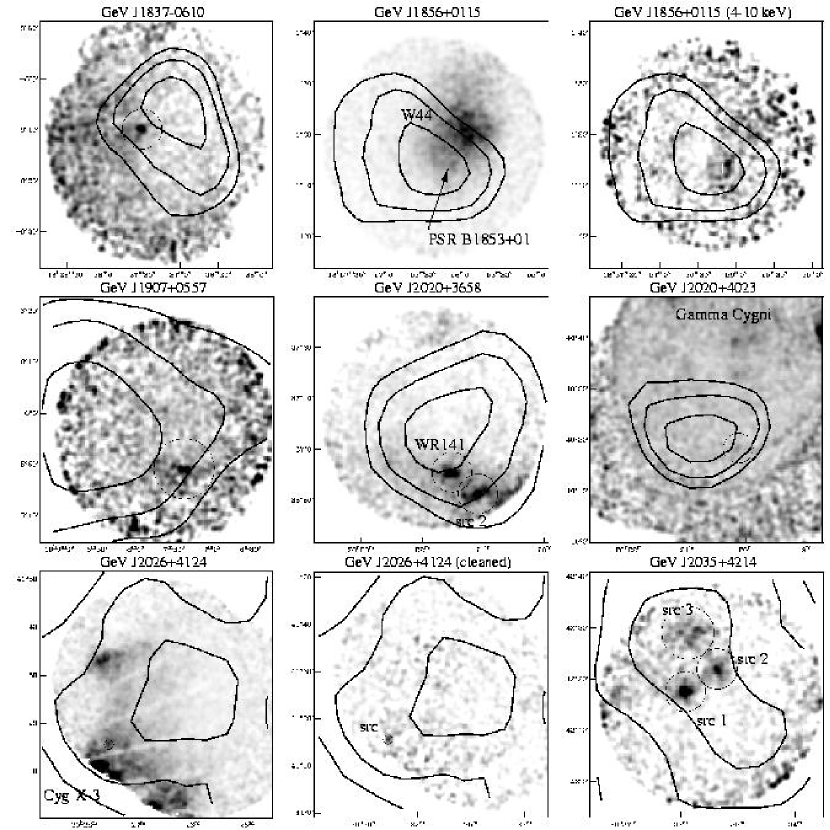
R.A. (2000) and Dec. (2000). The contours are the
Some of the archival data of fields containing pulsars were obtained in modes with low spatial resolution. In these cases, SIS images are shown. The fits images and efficiency maps are available on the web at http://astro.stanford.edu/mallory/survey.html.
3.2 Spectral and Flux Measurements
Many of the sources discovered are faint, and we want to ensure that detector artifacts are not mistaken for real sources. Therefore, extra care has to be taken in spectral measurements. Spectra were extracted from the brightest sources discovered in the images as indicated in the figures. Since most of the sources are in the Galactic plane, background regions were chosen, where possible, from within the same field. The 1999 version of the night earth observation files were used to subtract the particle background from both the source and background spectra. Since the sensitivity is not constant over the field of view, a correction needs to be made in the background spectra. To do this, we determined the average 2-10 keV detector efficiency in the source and background extraction regions using the efficiency map used in the exposure corrections described above. We then scaled the background spectra (after the night earth spectra was subtracted) by the ratio of the background to source efficiency. To test how well this corrected for the dependence on detector region of the background spectra, we took four spectra from different regions of the detectors in the field of GeV J1025-5809 and applied our corrections. We then fit both the faint () and moderately bright () sources in the field using each of the backgrounds in turn. All of the fits measured fluxes within of each other, and the derived spectra were all consistent. Thus, we believe our method is adequate for deriving consistent flux measurements for the new sources in this survey independent of where on the detector the background was extracted.
The spectra from the two GIS detectors were then combined and fit with an absorbed power law model using the XSPEC package. The results are listed in Table 3. The best fit parameters with multi-parameter error intervals are listed in the table. The flux measurements are of the absorbed 2-10 keV flux and have errors derived from single parameter fits of the normalization. If the source was too faint for a meaningful fit, an absorption column of and a spectral index of 2.0 was assumed in measuring the flux.
Table 2 lists all of the “bright” sources from Lamb and Macomb (1997) ( ph ), with the names and X-ray fluxes of some of the more interesting counterpart candidates, and the ray fluxes, spectral indices, and the variability statistic where available. In the cases where there is a bright, thermal SNR in the field, we first fit the spectrum using a thermal plasma model, and then added a power law component with a spectral index of 2.0 to see if the fit improved and to provide upper limits on any non-thermal component. Only the non-thermal flux limit is listed in Table 2. In cases where there was no obvious source, the same fitting process was used to provide upper limits on the flux. In some cases of previously known objects, we quote values from the literature.
In order to compare the different sources, we calculated an X-ray to ray energy “spectral index” where is the photon flux above 1GeV, which corresponds to the flux density at 1GeV if a photon index of 2.0 is assumed, and is the X-ray power law normalization in photons , corresponding to the unabsorbed flux density at 1keV. This value is also listed in Table 2.
4 Individual Sources
We have split the sources into three categories. The first, the focus of this study, consists of sources which had previously not been associated with known sources of high energy emission (such as supernova remnants, pulsars, or X-ray binaries). These fields were selected based upon ray source positions. In order to estimate the significance of the X-ray sources found in these fields, we use the log N-log S relationship of Sugizaki (1999) derived from the ASCA Galactic Plane Survey (GPS) covering the area of and . For each listed source found within or near the positional contour, we list in Table 3 the number of sources of that flux or greater expected to be found within the contour. Note that many of the sources are at larger Galactic latitudes and longitudes than the GPS, and so this should be a fairly conservative estimate of the chance of random association.
The second category consists of fields which were pointed at some previously known lower energy source, whose position is coincident with a GeV error ellipse. The third category consists of GeV sources which have positive identifications with a low energy counterpart (i.e. a pulsar or a blazar).
4.1 GeV Selected Sources
GeV J1025-5809 This source is near the bright radio source RCW49, an HII region with colliding wind bubbles from massive stars at the center (Whiteoak and Uchida, 1997) seen as a significant X-ray source at the NW edge of the field. The peak marked as src1 may be associated with this extended emission. The point source just outside the confidence contour is the probable Wolf-Rayet+O star binary 1E1024.0-5732/Wack 2134 (Reig, 1999). There is much extended radio emission in the region associated with RCW49, including a blob suggestively shaped like a bow shock, with no apparent X-ray emission.
GeV J1417-6100 This source has been the object of recent extensive studies in radio and X-rays (Roberts and Romani, 1998; Roberts et al., 1999; Case and Bhattacharya, 1999; Roberts et al., 2000). The two extended sources (marked as K3 and Rabbit in the figure) are associated with non-thermal radio emission in the wings of the Kookaburra complex (Roberts et al., 1999). The more southerly one is coincident with the Rabbit nebula, whose radio spectral and polarization properties suggest a pulsar wind nebula (PWN) origin. However, the Parkes multi-beam survey has recently discovered the high pulsar PSR J1420-6048 consistent with the northern extended source (D’Amico et al., 2000) which also has radio properties consistent with a PWN (K3 of Roberts et al. 1999). A point radio source near the peak of the K3 source is the likely pulsar (Roberts et al., 2000). AX J1418.2-6047 (src2 of Roberts and Romani 1998, and so marked in figure) has no associated radio emission, and may be variable. The ray source also appears to be moderately variable, and therefore this last source could be a candidate for an isolated black hole. However, given the presence of at least one, if not two, potential pulsar counterparts, we do not favor this latter possibility.
GeV J1732-3130 This is listed as another name for 3EG J1734-3232 in the third EGRET catalog, but the rather large MeV error contour only slightly overlaps the LM GeV ellipse, making their identification as a single source unlikely. Our new TS map assumes an additional source at the best fit 3EG position, but this has little effect on the final result. The large contour required 2 ASCA pointings for adequate coverage. The X-ray image shows weak, extended emission within the contour, however this may be scattered light from the X-ray binary X1724-308, just over 1 degree away. We measured a peak within this area (src3), and two sources near the edges of the FOV (src1,src2). We could find no other X-ray images of this field.
GeV J1809-2327 This image shows an X-ray complex with possible point sources (sp2 and sp3) in the southern portion coincident with massive young stars in the Sharpless 32 HII region. There is also a coincident 60 source seen in the IRAS survey with a peak at 18h 09m 58s, -23d 41m 14s (near sp3). However, the ray contours favor the northern part of the complex, which has a harder spectrum. This extended X-ray emission is surrounded by molecular gas in the Lynds 227 dark nebula, and has been suggested to be a synchrotron nebula maintaining pressure equilibrium with the cloud by means of a pulsar wind (see Oka et al. 1999 for details). This source also seems to be moderately variable in rays. The bright point source to the south (src2) is near a weak, radio point source. Such X-ray/radio sources are frequently associated with Seyfert galaxies, which are common background sources in hard X-rays (Gioia et al., 1990).
GeV J1825-1310 This source is near the young pulsar PSR B1823-13. However, our GeV source position is not consistent with it at the confidence level. The new image, based on the GeV position, reveals a previously unknown extended X-ray source with a spectrum suggestive of a pulsar wind nebula. Near the conjunction of our field with the archival GPS fields is some apparently thermal diffuse X-ray emission near a non-thermal radio source in the Sharpless 53 HII cluster, which may be a supernova remnant (G18.1-0.2, marked as such in figure, also source F of Kassim et al. 1989). This latter source is also consistent with the soft ray source () 3EG J1823-1314.
GeV J1835+5921 This source is the only unidentified GeV source that made our flux cut at high Galactic latitude (). Due to its hard spectrum, small error contour, and unique position resulting in low absorption, it has been the subject of an extensive observing campaign with ROSAT and ASCA, as well as radio and optical studies (Mirabal et al., 2000). Only a few, very faint point sources are in the field. Mirabal et al. (2000) suggest one variable soft X-ray source observed by ROSAT as a potential counterpart. Strong upper limits on the optical flux suggest a neutron star identification. However, the relative X-ray to ray flux is remarkably low assuming the X-rays are due to thermal emission from a neutron star surface. This may indicate an aging isolated pulsar with only weak magnetospheric X-ray emission. In our image, made from the archival data, the most significant peak consistent with the GeV source is at 18h36m9.2s, +59d28m09s, which is a marginal source with a 2-10 keV flux of only . This is not one of the sources listed by Mirabal et al. (2000). However, we use this as the X-ray flux in Figure 2 and Figure 3.
GeV J1837-0610 This field contains a single point source in a small, well constrained error contour. The field was observed twice, with slightly different pointings, and the point source was seen at the same sky coordinates in both. The Parkes multi-beam survey has dicovered a fast pulsar within the contour (D’Amico et al., 2000) which is not consistent with the X-ray source.
GeV J1907+0557 This source is listed as 3EG J1903+0550 in the third EGRET catalog, even though the center of the LM ellipse was away with hardly any overlap with the very large contour. It seems likely that 3EG J1903+0550 is associated with the SNR G40.5-0.5, in which case it has no association with GeV J1907+0557. Our image was based on the LM position, and contains two weak pointlike sources which may be bright spots in a single, extended, source, or fluctuations from a low count rate. Our flux measurement treats them as one source.
GeV J2020+3658 There were two previous ASCA pointings attempting to see this source based on the position of the second EGRET catalog, which was to the northeast of this field. In the third EGRET catalog, the source was split into two sources, the southern one, 3EG J2021+3716, being consistent with the GeV source position (NOT 3EG J2016+3657, as listed in the 3EG catalog). Interesting extended emission can be seen in our image, with 2 embedded sources. The one more centered in the GeV contour (src1) is coincident with WR141, a WN6+O type Wolf-Rayet binary system with a 21.6 day period (Lamontagne et al., 1996). Several lines are seen in the spectra, and thermal plasma model fits to src1 result in keV. Src2 is somewhat harder, with a smoother spectrum, suggesting it is more likely to be non-thermal. The extended emission appears to be moderately absorbed (nH) with a moderately steep spectrum (), although accurate flux and spectral measurements are difficult due to the two point sources dominating the flux in the region. This diffuse emission is also seen in an archival Einstein IPC image.
GeV J2026+4124 The ASCA image of this region suffers badly from scattered X-rays coming from Cyg X-3, even though it is over away. However, Cyg X-3 is variable, and by creating maps from times at low count rates from which we subtract scaled maps from high count-rate times, we discover at least one source in the GeV contour (“cleaned” image). This source is seen in both pointings that make up the composite image.
GeV J2035+4214 This field contains three interesting sources, two point-like and one extended. Src1 is coincident with a bright (Jy at 1420 MHz), steep spectrum double-lobed radio source (Clegg et al., 1991), unusual in that for one of the lobes the rotation measure has the opposite sign from the other lobe, and from that of most of the sources in the region. The second source (src2) is embedded in the radio-bright (44 Jy at 408 MHz, Normandeau, Joncas, and Green 1992) dense molecular cloud DR17, which has a positive velocity measure (+10 km/s, Piepenbrink and Wendker 1988), indicating it is probably in the Great Cygnus Rift ( kpc). The third X-ray source (src3) is extended and has a somewhat softer, possibly thermal spectrum.
4.2 Sources Coincident With Previously Known Sources
GeV J0008+7304; CTA 1 The X-ray nebula seen in this image, contained within the SNR CTA 1, has been interpreted as synchrotron emission powered by the wind of a fast pulsar, proposed to be the ROSAT point source RXJ0007.0+7302 found near the center (Slane et al., 1997). Limits on the optical and radio flux have lead Brazier et al. (1998) to propose this to be a radio-quiet ray pulsar. The X-ray and ray spectra are consistent with this hypothesis. The source may be moderately variable however, suggesting that at least some of the ray emission is not from a pulsar magnetosphere.
GeV J0241+6102; LSI+61 303 This source is nearly coincident with the curious X-ray binary LSI+61 303. The source is variable in rays, and although this has not been correlated with any of the known timescales of LSI+61 303 (Kniffen et al., 1997), several authors have suggested potential mechanisms of ray production (see Strickman et al. 1998 and references therein; Punsly 1999a). However, it should be noted that the source is now barely excluded at the confidence level in the 3rd EGRET catalog. The faint peak just to the southwest of LSI+61 303 has been identified as a stellar source (Leahy, Harrison, and Yoshida, 1997) which is unlikely to be associated with the ray source. No other source is apparent in the field.
GeV J0617+2237; IC443 Thermal X-ray emission from the SNR IC443 dominates the 2-10 keV image of this field. Several authors have pointed to this source as an example of how cosmic ray production can produce GeV emission from a SNR, either alone or interacting with a molecular cloud (eg. Hnatyk and Petruk 1998). Indeed, Keohane et al. (1997) discovered 2 spatially localized regions of non-thermal emission that can be seen here in the 4-10 keV image at the southern and south-eastern edges of the field. Both of these regions are well outside the updated GeV error contour, and we find little evidence for a non-thermal component at the ray position, although the bright thermal emission could easily obscure a faint source.
GeV J1746-2854; Galactic Center Emission in the Galactic center region is very complex at all wavelengths, and the GeV emission is no exception. The X-ray image shows several potential counterparts, and the shape of the GeV error contour suggests it may result from several, confused sources. The northern source within the 95% GeV contour is the X-ray binary 1E 1743.1-2843, which we use in the table, is connected by a ridge of emission to the source or sources near the Galactic center which are just outside the 95% contour. For detailed discussions of potential ray sources in this region, see Mayer-Hasselwander et al. (1998).
GeV J1800-2328; W28/PSR B1758-23 The error contour of this source encompasses the thermal emission from the SNR W28 and the young pulsar PSR B1758-23. We see no evidence of hard emission at the pulsar position, and no strong non-thermal emission in the GeV error contour, although, like in IC443, a weak source could easily be obscured by the bright thermal emission. The 3rd EGRET catalog ray spectrum is somewhat softer than most of the sources in this study, and we note that the catalog position, based on the MeV maps, extends further to the south, being consistent with the non-thermal emission seen in the 4-10 keV image at the southwestern edge of the field. It is possible that the softer rays come from this region, while the GeV emission comes from PSR B1758-23 or a radio-quiet pulsar hidden in the center of W28.
GeV J1856+0115; W44/PSR B1853+01 Harrus, Hughes, and Helfand (1996) have discovered an extended non-thermal source associated with PSR B1853+01, seen here in the 4-10 keV image. Frail et al. (1996) have discovered an associated PWN. However, the ray emission appears to be variable, and no pulsations have been detected in the EGRET data.
GeV J2020+4023; Cygni This source, located within the Cygni supernova remnant, has a very well constrained error ellipse. Despite extensive observations, there is no obvious hard X-ray component associated with the GeV source. Our extraction region provides an upper limit to any hard X-ray counterpart in this field.
4.3 Identified Sources
As noted above, the identified sources fall into two classes: blazars and pulsars. There are 5 blazars listed by LM among their “bright” sources, however only 2 have GeV fluxes above . The blazars in this list observed by ASCA all appear as moderately bright point sources with power law spectra. In the single dish PMN radio survey, these sources all have bright, point-like 5 GHz emission. The values of these sources are fairly narrowly confined between -0.65 and -0.75.
The pulsars are much more difficult to characterize. At one extreme is the Crab, with a very bright X-ray nebula, , and a bright radio pulsar wind nebula (PWN). At the other extreme is Geminga, with very weak X-ray emission, , and no radio emission. PSR B1046-58 and PSR B1055-52 have moderately weak X-ray emission, with possibly associated extended emission, and no evidence of a radio PWN. PSR B1706-44 is similar, but may have a weak radio PWN. Although difficult to see in the image here which strongly suffers from scattered X-rays from the nearby X-ray binary 4U1705-44, there is some evidence for a compact X-ray nebula around the pulsar (Finley et al., 1998). Vela has moderately strong extended X-ray and radio emission. The pulsars all have low variability, consistent with none when systematics are considered, except for Vela. The apparent small variability of Vela is generally assumed to be due to the presence of nearby artifactual sources (Tompkins, 1999).
5 Discussion
As can be inferred from the values listed in Table 3, there is clearly an excess of sources with fluxes of a few ergs when compared to the GPS logN-logS, implying many of these are associated with the GeV sources. In some fields, however, multiple candidates make individual IDs impossible. In Figure 2, we plot the 2-10 keV X-ray flux of the brightest (and therefore statistically the source with the least likelihood of a chance coincidence) potential counterpart in each field versus the GeV flux. Since we are plotting the brightest source, these points can be considered upper limits on the “true” X-ray counterpart. For reference, we include the known pulsars and blazars on the plot, with lines of constant flux ratio drawn through the Crab, Vela, and Geminga pulsars. These are representative of pulsars with characteristic ages of roughly , , and years. Note there are no Crab-like sources, the closest being the source near the Galactic center. A few sources have X-ray fluxes or upper limits which result in ratios consistent with Geminga. Then there is a clump of sources with Vela-like ratios, which include the blazars. However, upper limits from 5 GHz radio surveys rule out a blazar ID in almost all cases for the unidentified sources.

In Figure 3, we plot these same sources’ energy index vs. the ray variability measure. Again, since we are using the brightest source, the value of in this plot for each source can be considered an upper limit on the true value, so if the plotted candidate X-ray source is not the GeV source, the source position on the plot would generally move to the left. The dotted line represents the systematic variability value . Sources not in the 3EG catalog, thus lacking a measured variability, are plotted on the bottom at . The dashed lines split the plot between sources with high and low variability, and what we will call (from left to right) X-ray faint, X-ray moderate, and X-ray bright. In the latter category, there is only the Crab and possibly the Galactic center source. We immediately note that all of the identified pulsars are low variability, with the four isolated pulsars being X-ray faint, Vela being X-ray moderate, and the Crab being X-ray bright. Three other sources are in the low-variability, X-ray faint category: GeV J1835+5921, GeV J1837-0610, and GeV J2020+4023. GeV J1025-5809 is in this category if the Wolf-Rayet star 1E1024.0-5732, outside the positional contour, is not the GeV source. In addition, if PSR B1758-23 is the counterpart for GeV J1800-2338, it would also fall within this region. All of these sources in this category are good candidates for isolated pulsars, about half of which are coincident with radio pulsars.

In the X-ray moderate category, we have four SNR. Two of them, IC443 and W28, only have upper limits on non-thermal X-ray emission associated with the GeV emission. In W44, the extended non-thermal emission is associated with a pulsar wind nebula around PSR B1853+01, and in CTA 1, there is a proposed association of the extended non-thermal emission with the radio-quiet pulsar candidate RXJ0007.0+7302 (Slane et al., 1997; Brazier et al., 1998). Therefore, we do not see any indication of GeV emission generated by SNR shocking with the interstellar medium or molecular clouds, although we cannot rule out this scenario. However, it should be noted that in some cases error contours produced from MeV maps are consistent with regions of apparently shocked emission, and that several of the softer sources in the 3rd EGRET catalog are coincident with young SNR. It therefore seems likely that SNR produce high-energy rays, but with a steeper spectrum than pulsars and blazars.
Three of the X-ray moderate candidates are binary systems. Two, 1E1024.0-5732 and WR 141, are WN5-6+O star systems whose hard X-ray emission is almost certainly due to shocks from colliding winds. With only known WN+O systems, and a viable emission mechanism, the coincidence of these two similar systems with GeV sources is suggestive. Neither source is strongly variable at ray energies, although in the case of WR 141 the natural time scale of the binary period is shorter than the variability analysis is sensitive to. However, both of these sources cannot be considered strong candidates since one is outside the 95% confidence contour and the other has another equally bright, and hence equally viable, X-ray point source consistent with the GeV position. LSI+61 303 is another candidate, but in this case the particle acceleration mechanism is less clear. If the companion to the B star is a neutron star, the rays could be produced through an accretion process, colliding winds, or even standard pulsation mechanisms. Its moderate variability would suggest that some of the emission could be due to interactions of the neutron-star with its environment.
The Vela pulsar is in the X-ray moderate, low-variability group. When the binary sources are eliminated, only four sources are in this region of the plot, although there are an additional four potential members of this group which were not tested for variability. Of these, two sources are weak upper-limits on non-thermal flux hidden in thermal SNR, and are therefore, if pulsars, likely to be X-ray faint. The best candidates for Vela-like radio-quiet pulsars are therefore RXJ0007.0+7302 in CTA 1, and src2 in GeV J2020+3658. Src2 in GeV J2035+4214 and the double source in GeV J1907+097 are reasonable candidates among the sources with unknown variability. Predictions of the majority of unidentified GeV sources being radio-quiet, Vela-type pulsars by some outer-gap models of pulsar emission (eg. Yadigaroglu and Romani 1997) are therefore not well supported by the X-ray data.
The most intriguing sources are the X-ray moderate, high variability unidentified sources. Although consistent with the blazars in the survey, none have bright, compact radio sources coincident with the X-ray source. What is most remarkable is that all four sources in this category seem to contain extended, synchrotron nebulae. Two of these, GeV J1856+0115 and GeV J1417-6100, have nebulae associated with the high pulsars PSR B1853+01 and the Kookaburra Pulsar PSR J1420-6048. The other two, GeV J1809-2327 and GeV J1825-1310, are in star forming regions providing potential pulsar birth-sites, with the latter having as a secondary source candidate PSR B1823-13. GeV J0008+7304, the source associated with CTA 1 which also has a synchrotron X-ray spectrum, shows indications of ray variability and could also be included in this group.
The most likely explanation for these sources are wind nebulae around young pulsars. The variability would indicate that a substantial fraction of the ray flux is synchrotron/Compton emission generated by particles in the pulsar wind. Depending on the local magnetic field strength, the synchrotron cooling timescale could be on the order of a few months, similar to the variability time scale. De Jager et al. (1996) have suggested a similar explanation for a possible variation seen in the Crab at 70-150 Mev. If this is the case, the synchrotron spectrum would mostly dominate the lower energies, and the ray pulse fraction should increase with energy until the pulsar emission cuts off at several GeV. Oka et al. (1999) propose that in the case of GeV J1809-2327, the ray emission is bremsstrahlung photons from a pulsar wind colliding with target baryons in the molecular cloud Lynds 227. In this case, the variability could be due to instabilities in the interaction layer.
6 Conclusions
We have presented a nearly complete 2-10 keV X-ray image catalog of potential counterparts to the brightest sources of GeV emission. In the images of the unidentified sources, we find an excess of X-ray sources with ergs within the 95% error contours. Among these, we find several candidates for isolated, radio-quiet pulsars. We find no evidence for GeV emission from supernova remnant shell shocks, although we cannot yet exclude this possibility. We also find 4-5 extended hard X-ray sources coincident with variable ray sources, representing a potential new class of GeV sources, plausibly associated with pulsar wind nebulae. The sources in this catalog are ready targets for the new generation of X-ray satellites. In particular, Chandra could map the fine structure of the candidate PWN, compare their morphologies with known PWN, and search for the pulsar location. XMM, with its high throughput, could obtain excellent spectra and search for X-ray pulsations. Detailed radio imaging, spectroscopy, and polarimetry could prove very enlightening for many of these sources. Ultimately, it will take further ray measurements to determine which of these sources are true low-energy counterparts. The improved spatial resolution and high-energy sensitivity of the proposed GLAST mission should easily make unambiguous identifications of most of these sources.
| Source | Coverage aa95% contour covered by all pointings combined | Date | Exposure | 3EG ID | Notes |
|---|---|---|---|---|---|
| MJD | ksec | ||||
| GeV J0008+7304 | 0.68 | 50107.35 | 44 | 3EG J0010+7309 | CTA 1? |
| GeV J0210-5053 | IDbbID indicates ray source has been identified with a low energy counterpart. | 49924.84 | 12 | 3EG J0210-5055 | QSO 0208-512 |
| GeV J0237+1648 | ID | 49387.82 | 12 | 3EG J0237+1635 | QSO 0235+164 |
| GeV J0241+6102 | 0.99 | 49386.09 | 17 | 3EG J0241+6103 | LSI+61 303? |
| 49392.34 | 19 | ||||
| GeV J0534+2159 | ID | 51071.43 | 43 | 3EG J0534+2200 | Crab Pulsar |
| GeV J0617+2237 | 1.00 | 49091.34 | 19 | 3EG J0617+2238 | IC 443 SNR? |
| 49092.11 | 23 | ||||
| GeV J0634+1746 | ID | 49439.90 | 74 | 3EG J0633+1751 | Geminga Pulsar; SIS |
| 50521.95 | 38 | OFFSET | |||
| 50523.12 | 18 | OFFSET | |||
| GeV J0835-4512 | ID | 49119.09 | 10 | 3EG J0834-4511 | Vela Pulsar |
| GeV J1025-5809 | 0.78 | 50834.95 | 37 | 3EG J1027-5817 | |
| GeV J1047-5840 | ID | 49379.14 | 18 | 3EG J1048-5840 | PSR B1046-58 |
| GeV J1059-5218 | ID | 49735.14 | 27 | 3EG J1058-5234 | PSR B1055-52; SIS |
| 49735.14 | 37 | GIS lo-res | |||
| GeV J1256-0546 | ID | 49159.94 | 28 | 3EG J1255-0549 | 3C 279 |
| GeV J1417-6100 | 0.96 | 50316.32 | 45 | 3EG J1420-6038 | Kookaburra Nebula? |
| 51222.67 | 59 | ||||
| GeV J1709-4430 | ID | 49605.31 | 17 | 3EG J1710-4439 | PSR B1706-44 |
| GeV J1732-3130 | 0.98 | 51254.85 | 21 | mis ID as 3EG J1734-3232 | |
| 51254.26 | 20 | ||||
| GeV J1746-2854 | 1.00 | 49610.93 | 82 | 3EG J1746-2851 | Gal. Center region |
| GeV J1800-2328 | 1.00 | 49445.08 | 28 | 3EG J1800-2338 | W28/PSR B1758-23? |
| 49445.82 | 21 | ||||
| 49448.95 | 10 | ||||
| 50173.30 | 12 | ||||
| 50173.56 | 10 | ||||
| GeV J1809-2327 | 1.00 | 50525.75 | 71 | 3EG J1809-2328 | |
| GeV J1825-1310 | 0.90 | 51255.25 | 37 | 3EG J1826-1302 | mis ID 3EG J1823-1314 |
| 50548.28 | 10 | GPSccGPS indicates field is from the ASCA Galactic Plane Survey | |||
| 50547.88 | 8 | GPS | |||
| GeV J1835+5921 | 1.00 | 50923.84 | 69 | 3EG J1835+5918 | |
| GeV J1837-0610 | 1.00 | 50905.31 | 20 | 3EG J1837-0606 | |
| 51104.87 | 18 | ||||
| GeV J1856+0115 | 1.00 | 49464.93 | 14 | 3EG J1856+0114 | W44/PSR B1853+01? |
| GeV J1907+0557 | 0.74 | 51096.08 | 23 | mis ID 3EG J1903+0550 | |
| GeV J2020+3658 | 1.00 | 51299.67 | 43 | 3EG J2021+3716 | mis ID 3EG J2016+3657 |
| GeV J2020+4023 | 1.00 | 50219.45 | 39 | 3EG J2020+4017 | Cyg SNR? |
| 50582.71 | 59 | ||||
| 50584.50 | 16 | ||||
| 50584.83 | 12 | ||||
| GeV J2026+4124 | 0.72 | 51339.69 | 21 | ||
| 51340.28 | 22 | ||||
| GeV J2035+4214 | 0.74 | 50948.81 | 37 |
| ray source | Candidate | aaFluxes are from power law + absorption fits | bbDistances estimated from nearby young objects for unknown sources (Yadigaroglu and Romani, 1997) | ccSources with nearby 3EG sources were refit. Otherwise, from Lamb and Macomb (1997) | ddNumber in parentheses is error on last digit, if greater than 1 | ||
|---|---|---|---|---|---|---|---|
| ergs | kpc | ph | |||||
| GeV Selected | |||||||
| GeV J1025-5809 | AX J1025.6-5757 | 5 | 0.45(2) | ||||
| AX J1025.9-5749 | 3 | 0.78 | |||||
| GeV J1417-6100 | AX J1420.1-6049 | 1.5 | 0.68 | ||||
| GeV J1732-3130 | AX J1732.2-3044 | - | - | - | 0.69(2) | ||
| GeV J1809-2327 | AX J1809.8-2333 | 1.9 | 0.76 | ||||
| GeV J1814-1228 | - | - | 2 | - | - | - | |
| GeV J1825-1310 | AX J1826.1-1300 | 4.1 | 0.83 | ||||
| GeV J1835+5921 | AX J1836.2-5928 | - | |||||
| GeV J1837-0610 | AX J1837.5-0610 | 9 | 0.48 | ||||
| GeV J1907+0557 | AX J1907.1+0549 | 2.1 | - | - | 0.64(2) | ||
| GeV J2020+3658 | AX J2021.1+3651 | 5 | 0.69 | ||||
| GeV J2026+4124 | AX J2027.6+4116 | 1.6 | - | - | 0.63(4) | ||
| GeV J2035+4214 | AX J2035.4+4222 | 1 | - | - | 0.64 | ||
| Previously Known Candidate | |||||||
| GeV J0008+7304 | CTA 1 | 2.1 | 0.83 | ||||
| GeV J0241+6102 | LSI+61 303 | 2.4ggSteele et al. (1998) | 0.73 | ||||
| GeV J0617+2237 | IC443 | 1 | |||||
| GeV J1746-2854 | Gal. Center | 1 | |||||
| GeV J1800-2328 | PSR B1758-23 | 3 | |||||
| W28 | 3 | ||||||
| GeV J1856+0115 | PSR B1853+01/W44 | 3.3 | 0.65(2) | ||||
| GeV J2020+4023 | Cygni | 0.7 | |||||
| Identified Sources | |||||||
| GeV J0210-5053 | QSO 0208-512 | - | 0.71 | ||||
| GeV J0237+1648 | QSO 0235+164 | - | 0.67 | ||||
| GeV J0534+2159 | Crab | 2 | 1.28 | ||||
| GeV J0634+1746 | Geminga | 0.32 | |||||
| GeV J0835-4512 | Vela | 0.5 | 0.68 | ||||
| GeV J1047-5840 | PSR B1046-58 | 3 | 0.56(3) | ||||
| GeV J1059-5218 | PSR B1055-52 | 1.5 | 0.47(3) | ||||
| clump 2llValues are for the bright, extended source, (clump 2) from Shibata et al. (1997) | 1.5 | - | - | 0.62 | |||
| GeV J1256-0546 | 3C 279 | - | 0.75 | ||||
| GeV J1626-2955 | PKS 1622-297 | - | - | - | |||
| GeV J1636+3812 | QSO 1633+382 | - | 0.65(2) | ||||
| GeV J1709-4430 | PSR B1706-44 | 1.8 | 0.52(2) | ||||
| ray source | X-ray source | R.A.(2000) | Dec.(2000) | nH | aaPhoton spectral index. | bbNumber of sources with flux greater than the source expected in 95% error contour, from log N-log S distribution of Sugizaki (1999). | ID | Notes | |
|---|---|---|---|---|---|---|---|---|---|
| h m s | ergs | ||||||||
| GeV J1025-5809 | AX J1025.6-5757 | 10 25 35.8 | -57 56 47 | 1.7 | src1 | ||||
| AX J1025.9-5749 | 10 25 56.6 | -57 48 42 | 0.3 | src2, 1E1024.0-5732 | d,o | ||||
| GeV J1417-6100 | AX J1420.1-6049 | 14 20 07.8 | -60 48 56 | 0.2 | K3, obs2 | e | |||
| AX J1418.7-6058 | 14 18 39.8 | -60 58 03 | 0.1 | Rabbit, obs2 | e | ||||
| AX J1418.2-6047 | 14 18 12.8 | -60 46 55 | 0.7 | src2, obs1 | c | ||||
| AX J1418.6-6045 | 14 18 37.0 | -60 45 12 | 0.7 | src3, obs1 | c | ||||
| GeV J1732-3130 | AX J1733.9-3112 | 17 33 52.3 | -31 12 25 | 2.1 | src1 | d | |||
| AX J1732.2-3044 | 17 32 09.9 | -30 43 49 | 0.8 | src2 | d | ||||
| AX J1731.7-3115 | 17 31 41.2 | -31 15 28 | 2.1 | src3 | c | ||||
| AX J1732-3115 | 17 32 01 | -31 14 38 | 0.5 | src4,diffuse | f | ||||
| GeV J1809-2327 | AX J1809.8-2333 | 18 09 47.1 | -23 33 17 | 0.02 | Nebula | e | |||
| AX J1809.8-2332 | 18 09 48.6 | -23 32 09 | (0.05) | sub-peak 1 | c | ||||
| AX J1809.8-2339 | 18 09 49.8 | -23 38 51 | (0.2) | sub-peak 2 | c,o | ||||
| AX J1810.0-2340 | 18 09 57.2 | -23 39 47 | (0.3) | sub-peak 3 | c,o | ||||
| AX J1809.9-2336 | 18 09 55.7 | -23 35 51 | (0.2) | sub-peak 4 | c | ||||
| AX J1810.6-2349 | 18 10 39.5 | -23 48 42 | src2 AGN? | d,n | |||||
| GeV J1825-1310 | AX J1826.1-1300 | 18 26 04.9 | -12 59 48 | 0.2 | Nebula | e | |||
| AX J1826.1-1257 | 18 26 08.2 | -12 56 46 | (0.7) | sub-peak 1 | c | ||||
| AX J1826.0-1303 | 18 26 01.2 | -13 02 54 | (0.8) | sub-peak 2 | c | ||||
| AX J1824.5-1310 | 18 24 32 | -13 09 59 | 0.9 | src3, G18.1-0.2 | e,o | ||||
| GeV J1837-0610 | AX J1837.5-0610 | 18 37 32.5 | -06 09 49 | 0.1 | c | ||||
| GeV J1907+0557 | AX J1907.4+0549 | 19 07 21.3 | +05 49 14 | 2 | 1.0 | e? | |||
| GeV J2020+3658 | AX J2021.6+3656 | 20 21 33.2 | +36 55 36 | 0.1 | src1,WR141 | c | |||
| AX J2021.1+3651 | 20 21 07.8 | +36 51 19 | 0.1 | src2 | c | ||||
| GeV J2026+4124 | AX J2027.6+4116 | 20 27 33.8 | +41 16 12 | 1 | 2 | 1.2 | g,d | ||
| GeV J2035+4214 | AX J2036.0+4218 | 20 35 57.6 | +42 17 38 | 0.8 | src1 | ||||
| AX J2035.4+4222 | 20 35 24.3 | +42 22 04 | 1.2 | src2 | |||||
| AX J2035.9+4229 | 20 35 55.2 | +42 29 09 | 0.9 | src3 | e |
References
- Armitage and Natarajan (1999) Armitage, P.J. and Natarajan, P. 1999, ApJ, L7.
- Brazier et al. (1998) Brazier, K.T.S., Reimer, O., Kanbach, G., and Carramiñana, A. 1998, MNRAS, 295, 819
- Case and Bhattacharya (1999) Case, G. and Bhattacharya, D. 1999, ApJ, 521, 246
- Clegg et al. (1991) Clegg, A.W., Cordes, J.M., Simonetti, J.H., and Kulkarni, S.R. 1992, ApJ, 386, 143
- D’Amico et al. (2000) D’Amico, N. et al. 2000, in preparation.
- Eichler and Usov (1993) Eichler, D. and Usov, V. 1993, ApJ, 402, 271.
- Finley et al. (1998) Finley, J.P., Srinivasan, R., Saito, Y. Hiriyama, M., Kamae, T., and Yoshida, K. 1998, ApJ, 493, 884
- Frail et al. (1996) Frail, D.A., Giaconi, E.B., Goss, W.M., Dubner, G. 1996, ApJ, 464, L165
- Gaensler et al. (1998) Gaensler, B. M., Brazier, K.T.S., Manchester, R.N., Johnston, S., and Green, A.J. 1998, MNRAS, 305, 724.
- Gioia et al. (1990) Gioia et al. 1990, ApJS, 72, 567.
- Gooch (1995) Gooch, R.E. 1995, in Astronomical Data Analysis Software and Systems V, ASP Conf. Series vol. 101, ed. Jacoby, G.H. and Barnes, J., ASP, San Francisco, 80.
- Gotthelf et al. (2000) Gotthelf, E.V., Ueda, Y., Fujimoto, R., Kii, T., and Yamaoka, K. 2000, ApJ in press
- Grenier (1998) Grenier, I.A. 1998, Abstracts of the 19th Texas Symposium on Relativistic Astrophysics and Cosmology, held in Paris, France, Eds.: Paul, J., Montmerle, T., and Aubourg, E., 241.
- Harrus, Hughes, and Helfand (1996) Harrus, I.M., Hughes, J.P., and Helfand, D.J. 1996, ApJ, 464, L161
- Hartman et al. (1999) Hartman, R.C. et al. 1999, ApJS, 123, 79.
- Hnatyk and Petruk (1998) Hnatyk, B. and Petruk, O. 1998, Condensed Matter Physics, 1, 655.
- Kaaret and Cottam (1996) Kaaret, P. and Cottam, J. 1996, ApJ, 462, L35
- Kassim et al. (1989) Kassim, N.E., Weiler, K.W., Erickson, W.C., and Wilson, T.L. 1989, ApJ, 338, 152
- Keohane et al. (1997) Keohane, J.W., Petre, R., Gotthelf, E.V., Ozaki, M., and Koyama, K. 1997, ApJ, 484, 350.
- Kniffen et al. (1997) Kniffen, D.A. et al. 1997, ApJ, 486, 126
- Kubo et al. (1998) Kubo, H., Takahashi, T., Madejski, G., Tashiro, M., Makino, F., Inoue, S., and Takahara, F. 1998, ApJ, 504, 693.
- Lamb and Macomb (1997) Lamb, D.Q. and Macomb, D. J. 1997, ApJ,488,872.
- Lamontagne et al. (1996) Lamontagne, R., Moffat, A.F.J., Drissen,L., Robert, C., and Matthews, J.M. 1996, AJ, 112, 2227
- Leahy, Harrison, and Yoshida (1997) Leahy, D.A., Harrison, F.A., and Yoshida, A. 1997, ApJ, 475, 823.
- Macomb and Lamb (2000) Macomb, D. J. and Lamb, D. Q. 2000, in preparation
- Mattox et al. (1996) Mattox, J. R. et al. 1996, ApJ, 461, 396
- Mayer-Hasselwander et al. (1998) Mayer-Hasselwander, H.A. 1998, A&A, 335, 161
- McLaughlin et al. (1996) McLaughlin, M.A., Mattox, J.R., Cordes, J.M., and Thompson, D.J. 1996, ApJ, 473, 763.
- Merck et al. (1996) Merck, M. et al. 1996, A&AS, 120, 465.
- Mirabal et al. (2000) Mirabal, N., Halpern, J.P., Eracleous, M., and Becker, R.H. 2000, ApJ, submitted
- Normandeau, Joncas, and Green (1992) Normandeau, M., Joncas, G. and Green, D.A. 1992, A&AS, 92, 63
- Ohashi et al. (1996) Ohashi, T. et al. 1996, PASJ, 48, 157
- Oka et al. (1999) Oka, T., Kawai, N., Naito, T., Horiuchi, T., Namiki, M., Saito, Y., Romani, R.W., and Kifune, T. 1999, ApJ, 526, 764
- Tanaka, Inoue, and Holt (1994) Tanaka, Y., Inoue, H., and Holt, S. S. 1994, PASJ, 46, L37
- Piepenbrink and Wendker (1988) Piepenbrink, A. and Wendker, H.J. 1988, A&A, 191, 313
- Pohl and Esposito (1998) Pohl, M. and Esposito, J.A. 1998, ApJ, 507, 327
- Punsly (1999a) Punsly, B. 1999, ApJ, 516, 141
- Punsly (1999b) Punsly, B. 1999, ApJ, 519, 336
- Reig (1999) Reig, P. 1999, ApJ, 345, 576
- Roberts (2000) Roberts, M.S.E. 2000, Ph.D. Thesis, Stanford University
- Roberts and Romani (1998) Roberts, M.S.E. and Romani, R.W. 1998, ApJ, 496, 827.
- Roberts et al. (1999) Roberts, M.S.E., Romani, R.W. , Johnston, S., and Green, A.J. 1999, ApJ, 515, 712.
- Roberts et al. (2000) Roberts M.S.E., Romani, R.W. , Johnston, S., and Kaspi, V.M. 2000, in preparation
- Romani, (1996) Romani, R.W. 1999,ApJ, 470, 469.
- Sault and Killeen (1998) Sault, R.J., and Killeen, N.E.B., The Miriad User’s Guide. Australia Telescope National Facility, Sydney, (http://www.atnf.csro.au/computing/software/miriad/)
- Shibata et al. (1997) Shibata, S. et al. 1997, ApJ, 483, 843.
- Slane et al. (1997) Slane, P., Seward, F.D., Bandiera, R., Torii, K., and Tsunemi, H. 1997, ApJ, 485, 221.
- Steele et al. (1998) Steele, I.A., Negueruela, I., Coe, M.J. and Roche, P. 1998, MNRAS, 297, L5.
- Strickman et al. (1998) Strickman, M.S., Tavani, M., Coe, M.J., Steele, I.A., Fabregat, J., Marti, J., Paredes, J.M., and Ray, P.S. 1998, ApJ, 497, 419.
- Sugizaki (1999) Sugizaki, M. 1999, PhD Thesis, University of Tokyo
- Tompkins (1999) Tompkins, W. 1999, PhD Thesis, Stanford University.
- Volk and Forman (1982) Völk, H.J. and Forman, M. 1982, ApJ, 253, 188.
- Whiteoak and Uchida (1997) Whiteoak, J.B.Z. and Uchida, K.I. 1997, A&A, 317, 563
- Yadigaroglu and Romani (1995) Yadigaroglu, I.-A. and Romani, R.W. 1995, ApJ, 449, 211.
- Yadigaroglu and Romani (1997) Yadigaroglu, I.-A. and Romani, R.W. 1997, ApJ, 476, 347.
- Zombeck (1990) Zombeck, M.V. 1990, Handbook of Space Astronomy and Astrophysics, Cambridge University Press