Multi-Color Observations of the GRB 000926 Afterglow
Abstract
We present multi-color light-curves of the optical afterglow of GRB 000926. Beginning days after the burst, the light-curves of this GRB steepen measurably. The existence of such achromatic breaks are usually taken to be an important observational signature that the ejecta are not expanding isotropically, but rather have a collimated jet-like geometry. If we interpret the data in this context, we derive an opening angle of , which reduces the energy release compared to an isotropic model by a factor of , to erg. To fit the data with a simple jet model requires extinction along the line of sight. The derived is in the range 0.11 – 0.82 mag, depending on the adopted extinction law and whether the electrons giving rise to the optical emission are undergoing synchrotron cooling or not. Since this is in excess of the expected extinction from our Galaxy, we attribute this to the GRB host. We note that this extinction is typical of a galactic disk, and therefore the event likely took place in the disk of its host.
Subject headings:
cosmology: observations; gamma-rays: bursts; galaxies: ISM1. Introduction
Multi-color light-curves of the afterglows of gamma-ray burst (GRB) sources contain information about the evolution of the relativistic blast wave, which results from the progenitor explosion, as it expands into the surrounding medium. Interpreted in the context of a theoretical afterglow model (Sari, Piran & Narayan (1998)), the broad-band light-curve, if observed starting immediately after the GRB through the time when the shock becomes non-relativistic, can, in principle, provide key physical parameters, including the total energy in the expanding ejecta, the density structure of the medium (Chevalier & Li (1999)) and whether the ejecta are spherically-symmetric or restricted to a jet (Rhoads (1997)). The optical window of the afterglow spectrum is particularly useful for determining if the ejecta are highly collimated, since it is generally well-sampled on timescales of hours to days when temporal decay slope breaks due to this geometric effect become manifest. In addition, the effects of dust as seen through extinction are most easily observed in multi-color optical data.
Only about a half-dozen GRB afterglows have been well-sampled in the optical, with data of sufficient quality to test theoretical models and provide significant constraints on the physical parameters. In several cases, e.g. GRB 990510 (Stanek et al. (1999), Harrison et al. (1999)), GRB 991216 (Halpern et al. 2000a ) and GRB 000301c (Berger et al. (2000)), the optical light-curves exhibit achromatic breaks, most easily understood as resulting from jet-like ejecta collimated to angles of , and . The implied degree of collimation reduces the inferred energy release for these events by factors of 50-300. However other events such as GRB 970508 show no evidence for collimation in the optical (but may in the radio — see Frail, Waxman & Kulkarni (2000)), indicating that the collimation angles are significantly larger.
In this letter, we present optical monitoring of the afterglow of GRB 000926 performed by the Palomar 60-inch and 200-inch, the MDM 2.4-m telescope, and the Wise 1.0-m telescopes, and derive the optical transient light-curve from 1 – 7 days after the GRB. In addition, we have obtained high-resolution HST/WFPC2 images in several bands, which allow us to properly subtract the contribution from nearby diffuse emission, possibly associated with the GRB host. We have fit the multi-color data with an afterglow model and find that observed steepening of the light-curve requires the ejecta to be collimated in a cone. In the context of this model, consistency of the multi-color data and temporal decay also implies significant extinction, likely associated with the GRB host.
2. Observations and Data Reduction
GRB 000926 as observed by the Inter-Planetary Network (Ulysses, Konus-Wind, and NEAR) on 2000 Sep 26.993 UT had a duration of 25 seconds, placing it in the class of long-duration GRBs. The position was triangulated to a relatively small error box of approximately 35 arcmin2 and distributed to the GRB community 0.84 days after the burst (Hurley et al. (2000)). The bright afterglow of GRB 000926 was identified by Gorosabel et al. (2000) and Dall et al. (2000) from observations taken less than a day after the burst. Spectra of the afterglow from the Nordic Optical Telescope yielded an absorption redshift of 2.066 (Fynbo et al. 2000a ), later refined to 2.0369 0.0007 from Keck spectroscopy (Castro et al. (2000)).
Our observations commenced with data taken by the MDM 2.4-m on Sep 28.177, 1.18 days after the burst. A complete log of our observations and resulting photometry can be found in Table 1. We used the filter system for all observations save those with the Palomar 200-inch for which observations were obtained in the (Steidel & Hamilton (1993)) and Sloan (Fukugita et al. (1996)) filters.
We calibrated twelve secondary standards in the field from observations of Landolt (1992) standard star fields (Landolt fields 96, 112, 113 and 114). These fields were observed with the Palomar 60-inch telescope on two photometric nights. These observations are sufficient to fit extinction terms, but not to extract a color term which we took to be zero. From these standards and combined images of the field we also calibrated two fainter tertiary standards for use with larger telescopes. For the reference star of Halpern (2000b), we find , , and . We estimate that these calibrations are accurate to approximately 3%.
The Palomar 200-inch telescope photometry were transformed to the system using the published transformations (Steidel & Hamilton (1993), Fukugita et al. (1996)) and OT colors of and . A 3% systematic error in the transformation was added in quadrature to the statistical error in these measurements. We compared magnitudes of field stars measured with the Palomar 60-inch telescope with transformed magnitudes from the 200-inch telescope photometry. This comparison suggests that our derived and magnitudes for the OT are accurate.
The -band images display significant fringing, so the quoted formal errors do not represent the true measurement error. We estimated a systematic -band error of 0.09 mag by fitting a straight line through the first four -band measurements and adjusting the systematic error until .
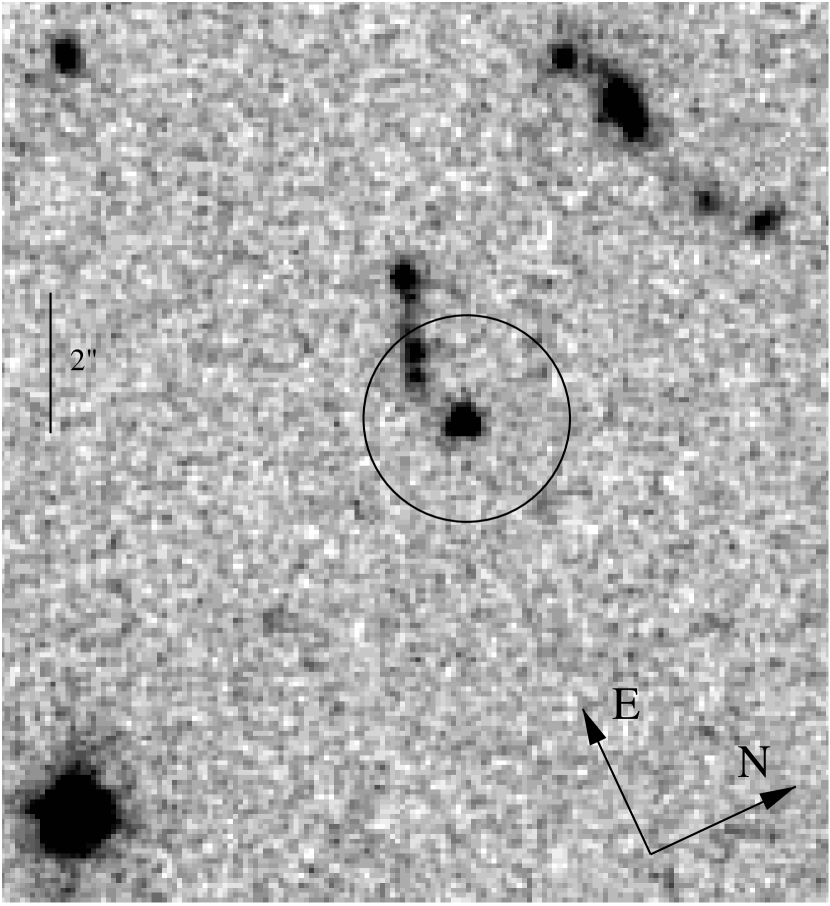
In addition to the ground-based photometric observations, we obtained high-resolution HST/WFPC2 images in F450W, F606W and F814W at three epochs as part of a long-term monitoring program with HST. The 6600 seconds (3 orbits) F450W images were combined using the STSDAS task crrej, while the 13200 seconds (6 orbits) F606W and F814W images were combined and cosmic-ray rejected using the drizzle technique (Fruchter & Hook (1997)). Figure 1 displays the resultant F606W image.
3. The Light-Curve
Both ground-based (Fynbo et al. 2000c ) and HST (Figure 1) imaging have revealed the presence of a galaxy near the OT, which contaminates photometry of the OT by ground-based telescopes. Proper treatment of this contamination is essential, since it can greatly influence the derived late-time slope, and consequently the important physical parameters. For example, Rol, Vreeswijk & Tanvir (2000) have fit a late-time temporal slope of for this afterglow, which is considerably steeper than that of other afterglows observed to date. We therefore use our HST images to measure the contaminating galaxy flux in a 1.5 arcsecond aperture from the OT and convert these to using Holtzman et al. (1995). The results are shown in Table 2. Our -band measurement of the galaxy contribution is fainter than the fit value of Rol, Vreeswijk & Tanvir (2000) of , which may explain their steeper late-time slope.
In deriving flux values for all our ground-based data, we use a 1.5-arcsecond aperture. This allows us to accurately subtract the galaxy flux in a straightforward way, using the values tabulated above. We note that there may be an additional compact component of the host emission not resolved by HST (which may be observed in subsequent, scheduled observations). However, since the light-curve shows no significant flattening, this is not likely to be an important contribution over the interval of our observations.
Since the aperture size used in measurements reported through the GRB Coordinate Network Circulars (GCN)111GCN circulars can be accessed from http://gcn.gsfc.nasa.gov/gcn/gcn3_archive.html is generally unspecified and variable, the amount of contamination by the galaxy in each measurement cannot be determined. Consequently, we include only measurements taken within one day of the GRB (Hjorth et al. (2000), Fynbo et al. 2000b ), in addition to the measurements presented in this paper in constructing the light-curve. These data are important for constraining the early-time temporal slope, and at these times, the OT is bright and the contamination by the galaxy is negligible. The measurements from the GCN were re-calibrated using our secondary standards. We correct all measurements for foreground Galactic extinction using mag from Schlegel, Finkbeiner & Davis (1998). In Figure 2 we display the OT light-curve in which the contribution from the host galaxy has been subtracted and the Galactic reddening has been accounted for. A single power-law temporal decay is clearly excluded, with a probability that it fits the data of .
In order to characterize the light-curve, we have fit it to the functional form (Beuermann et al. (1999))
| (1) |
This function has no physical significance, but provides a simple and general parametric description of the data, allowing for a gradual break in the afterglow decay. In this function, and are the early and late time asymptotic temporal slopes respectively, is the time of the temporal slope break, is the spectral slope, and is a parameter that determines the sharpness of the transition. We leave the break sharpness as a free parameter, since there is disagreement over its theoretical value (eg., Kumar & Panaitescu (2000)).
We first fit equation 1 without any constraints, applying 5% systematic error (in addition to the errors given in Table 1 above) to all measurements to reflect uncertainties in zero point calibrations for the different telescopes and in the conversion of WFPC2 magnitudes to . This form fits well, with and the fit parameters days, , , and , where the errors do not reflect covariance between the parameters. The best fit value for the break sharpness value is , but is not well constrained, due to the lack of early-time data. Figure 2 shows this fit overplotted on the data points.
4. Interpretation
We have demonstrated that the observed break in the light-curve is consistent with being achromatic, since the parameter is independent of frequency. This frequency-independent steepening of the optical light-curve is most easily interpreted as due to collimated, or jet-like ejecta. Once the Lorentz factor of the ejecta falls below the inverse of the opening angle of the jet the light-curve steepens due to geometric effects, as well as due to the sideways expansion of the ejecta (Rhoads 1997, 1999 ). Interpreted in this context, the early and late-time light-curve slopes, the optical spectral index, and the time of the transition constrain the index of the electron spectral energy distribution, , the jet opening angle and the total energy of the afterglow.
We now adopt the simple model developed by Sari, Piran and Halpern (1999). This model predicts the temporal and spectral evolution of synchrotron radiation from a jet expanding relativistically in a constant density medium. The early- and late-time temporal slopes and the optical spectral slope are determined by the electron spectral index, , and the break time is determined by the jet opening angle. Optical data alone do not have sufficient frequency coverage to locate all of the afterglow spectral breaks. Specifically, with the optical light-curve we cannot constrain the position of the cooling break, , and we must consider two cases: 1) is blue-ward of the optical (henceforth referred to as “case B”); and 2) is red-ward of the optical (henceforth “case R”).
We find that when we fit light-curves from all optical bands simultaneously (linking the spectral slope and the two temporal decay slopes) using the theoretical predictions of the model, we cannot produce an acceptable fit to the data. Our values of 195 and 83 for 47 degrees of freedom for case B and case R respectively correspond to a probability that the model describes the data of less than . Clearly, the observed optical spectral index is inconsistent with the model, being too steep for the value of determined from the temporal decay slopes.
This problem can be resolved if we include the effect of extinction in the host galaxy of the GRB, which can modify the spectral index. This explanation is consistent with the strong equivalent widths of absorption lines observed in spectra of this afterglow from the Keck telescope (Castro et al. (2000)). The appropriate extinction law is, however, unknown and unconstrained by our data, so to determine the source-frame we consider several possibilities. We allow for extinction laws corresponding to young star-forming regions (such as the Orion Nebula), the Milky Way, the LMC and the SMC by using the Cardelli, Clayton & Mathis (1989) and the Fitzpatrick & Massa (1988) extinction curves, with the smooth joining calculated by Reichart (1999).
Including extinction provides an acceptable fit to the multi-band data for both cases, with an electron energy spectral index which is consistent with that found for other afterglows. For case B, the derived values range from 0.82 mag for the Milky Way extinction law to 0.28 mag and 0.25 mag for the LMC and the SMC extinction laws ( for 46 degrees of freedom), with a break time of days. For case R, is 0.36/0.12/0.11 for Milky Way/LMC/SMC extinction, with a break time of days. In both cases, an extinction law corresponding to a young star-forming region does not fit the data, since it is ‘grey’ in the source-frame UV. The parameter is insensitive to the extinction law and the position of the cooling break to within the quoted error. We calculate the corresponding jet half-opening angle using Sari, Piran & Halpern (1999) to be , where is the density of the ISM, in units of cm-3.
5. Conclusions
Our well-sampled multi-color light-curve of the afterglow of GRB 000926 is well-described by a physical model where the ejecta are collimated in a jet. The degree of collimation reduces the inferred isotropic radiated energy of the GRB (Bloom et al. (2001)) by a factor of 275, to ergs. This inferred energy release is typical of events observed to-date. Furthermore, we find that in order to properly fit the light-curve of this afterglow extinction is required. Assuming the extinction is at the measured redshift of (Castro et al. (2000)), we can exclude an extinction law corresponding to a young star-forming region, and we find an ranging from 0.11 – 0.82 mag, depending on the assumed curve and on the cooling regime. This value exceeds the expected extinction from our own Galaxy, and is likely due to the host galaxy of the GRB.
References
- Berger et al. (2000) Berger, E.J., et al., 2000, ApJ, 545, 56.
- Beuermann et al. (1999) Beuermann, K., et al., 1999, A&A, 352, L26.
- Bloom et al. (2001) Bloom, J.S., et al., 2001, in prep.
- Cardelli, Clayton & Mathis (1989) Cardelli, J.A., Clayton, G.C. & Mathis, J.S., (1989), ApJ, 345, 245.
- Castro et al. (2000) Castro, S.M., Djorgovski, S.G., Kulkarni, S.R., Bloom, J.S., Galama, T.J., Harrison, F.A. & Frail, D.A., 2000, GCN 851.
- Chevalier & Li (1999) Chevalier, R.A. & Li, Z.-Y., 1999, ApJ, 520, L29.
- Dall et al. (2000) Dall, T., Fynbo, J.P.U., Pedersen, H., Jensen, B.L., Hjorth, J. & Gorosabel, J., 2000, GCN 804.
- Fitzpatrick & Massa (1988) Fitzpatrick, E.L. & Massa, D., 1988, ApJ, 328, 734.
- Frail, Waxman & Kulkarni (2000) Frail, D., Waxman, E. & Kulkarni, S.R., 2000, ApJ, 537, 191.
- Fruchter & Hook (1997) Fruchter, A.S., & Hook, R.N. 1997, in Proc. SPIE 3164, Applications of Digital Image Processing XX, ed. A. Tescher (Bellingham: SPIE), 120
- Fukugita et al. (1996) Fukugita, M., Ichikawa, T., Gunn, J.E., Doi, M., Shimasaku, K. & Schneider, D.P., 1996, AJ, 111, 1748.
- (12) Fynbo, J.P.U., Moller, P.,Dall, T., Pedersen, H., Jensen, B.L., Hjorth, J. & Gorosabel, J., 2000a, GCN 807.
- (13) Fynbo, J.P.U., Moller, P., Gorosabel, J., Hjorth, J., Jensen, B.L. & Pedersen, H., 2000b, GCN 825.
- (14) Fynbo, J.P.U., et al., 2000c, GCN 840.
- Gorosabel et al. (2000) Gorosabel, J., Castro Ceron, J.M., Castro-Tirado, A.J., Greiner, J., Wolf, C. & Lund, N., 2000, GCN 803.
- (16) Halpern, J.P., et al., 2000a, ApJ, 543, 697.
- (17) Halpern, J.P., Mirabal, N., Turnshek, D. & Busche, J., 2000b, GCN 806.
- Harrison et al. (1999) Harrison, F.A., et al., 1999, ApJ, 523, L121.
- Holtzman et al. (1995) Holtzman, J.A., Burrows, C.J. Casertano, S., Hester, J.J., Trauger, J.T. Watson, A.M. & Worthey, G., 1995, PASP, 107, 1065.
- Hjorth et al. (2000) Hjorth, J., Jensen, B.L., Pedersen, H., Fynbo, J.U.P., Moller, P. & Gorosabel, J., 2000, GCN 809.
- Hurley et al. (2000) Hurley, K., Mazets, E., Golenetskii, S. & Cline, T., 2000, GCN 801, GCN 802.
- Kumar & Panaitescu (2000) Kumar, P. & Panaitescu, A., 2000, ApJ, 541, L9.
- Landolt (1992) Landolt, A.U., 1992, AJ, 104, 340.
- Reichart (1999) Reichart, D.E., 1999, ApJ (submitted), astro-ph/9912368.
- Rhoads (1997) Rhoads, J.E., 1997, ApJ, 487, L1.
- Rhoads (1999) Rhoads, J.E., 1999, ApJ, 525, 737.
- Rol, Vreeswijk & Tanvir (2000) Rol, E., Vreeswijk, P.M. & Tanvir, N., 2000, GCN 850.
- Sari, Piran & Halpern (1999) Sari, R., Piran, T. & Halpern, J., 1999, ApJ, 519, L17.
- Sari, Piran & Narayan (1998) Sari, R., Piran, T. & Narayan, R., 1998, ApJ, 497, L17.
- Schlegel, Finkbeiner & Davis (1998) Schlegel, D.J., Finkbeiner, D.P. & Davis, M., 1998, ApJ, 500, 525.
- Stanek et al. (1999) Stanek, K.Z., Garnavich, P.M., Kaluzny, J., Pych, W. & Thompson, I., 1999, ApJ, 529, L39.
- Steidel & Hamilton (1993) Steidel, C.C. & Hamilton, D., 1993, AJ, 105, 2017.
| Date (2000, UT) | Filter | Magnitude | Telescope |
|---|---|---|---|
| Sep 28.183 | MDM 2.4-m | ||
| Sep 28.188 | MDM 2.4-m | ||
| Sep 28.192 | Palomar 60-inch | ||
| Sep 28.202 | Palomar 60-inch | ||
| Sep 29.165 | Palomar 60-inch | ||
| Sep 29.178 | MDM 2.4-m | ||
| Sep 29.188 | MDM 2.4-m | ||
| Sep 29.214 | Palomar 60-inch | ||
| Sep 30.155 | Palomar 60-inch | ||
| Sep 30.183 | MDM 2.4-m | ||
| Oct 1.166 | Palomar 60-inch | ||
| Sep 28.737 | Wise 1.0-m | ||
| Sep 29.194 | Palomar 60-inch | ||
| Sep 29.234 | Palomar 60-inch | ||
| Sep 30.255 | Palomar 60-inch | ||
| Oct 3.138 | Palomar 200-inch | ||
| Sep 28.173 | MDM 2.4-m | ||
| Sep 28.178 | MDM 2.4-m | ||
| Sep 28.212 | Palomar 60-inch | ||
| Sep 28.221 | Palomar 60-inch | ||
| Sep 28.695 | Wise 1.0-m | ||
| Sep 29.155 | Palomar 60-inch | ||
| Sep 29.198 | MDM 2.4-m | ||
| Sep 29.204 | Palomar 60-inch | ||
| Sep 29.207 | MDM 2.4-m | ||
| Sep 29.243 | Palomar 60-inch | ||
| Sep 29.752 | Wise 1.0-m | ||
| Sep 30.189 | Palomar 60-inch | ||
| Sep 30.216 | MDM 2.4-m | ||
| Oct 1.195 | Palomar 60-inch | ||
| Oct 2.164 | Palomar 60-inch | ||
| Oct 2.172 | MDM 2.4-m | ||
| Oct 3.113 | Palomar 200-inch | ||
| Sep 28.172 | Palomar 60-inch | ||
| Sep 28.182 | Palomar 60-inch | ||
| Sep 29.199 | Palomar 60-inch | ||
| Sep 30.228 | Palomar 60-inch | ||
| Oct 1.247 | Palomar 60-inch |
| Band | Magnitude |
|---|---|