ISO spectroscopy of circumstellar dust in 14 Herbig Ae/Be systems: towards an understanding of dust processing.††thanks: Based on observations with ISO, an ESA project with instruments funded by ESA Member States (especially the PI countries: France, Germany, the Netherlands and the United Kingdom) and with the participation of ISAS and NASA.
Abstract
We present Infrared Space Observatory (ISO) spectra of fourteen isolated Herbig Ae/Be (HAEBE) stars, to study the characteristics of their circumstellar dust. These spectra show large star-to-star differences, in the emission features of both carbon-rich and oxygen-rich dust grains. The IR spectra were combined with photometric data ranging from the UV through the optical into the sub-mm region. We defined two key groups, based upon the spectral shape of the infrared region. The derived results can be summarized as follows: (1) the continuum of the IR to sub-mm region of all stars can be reconstructed by the sum of a power-law and a cool component, which can be represented by a black body. Possible locations for these components are an optically thick, geometrically thin disc (power-law component) and an optically thin flared region (black body); (2) all stars have a substantial amount of cold dust around them, independent of the amount of mid-IR excess they show; (3) also the near-IR excess is unrelated to the mid-IR excess, indicating different composition/location of the emitting material; (4) remarkably, some sources lack the silicate bands; (5) apart from amorphous silicates, we find evidence for crystalline silicates in several stars, some of which are new detections; (6) PAH bands are present in at least 50% of our sample, and their appearance is slightly different from PAHs in the ISM; (7) PAH bands are, with one exception, not present in sources which only show a power-law continuum in the IR; their presence is unrelated to the presence of the silicate bands; (8) the dust in HAEBE stars shows strong evidence for coagulation; this dust processing is unrelated to any of the central star properties (such as age, spectral type and activity).
Key Words.:
circumstellar matter - stars: pre-main sequence - infrared: ISM: lines and bands - solar system: formation(e-mail: gwendolyn@ster.kuleuven.ac.be)
1 Introduction


A circumstellar (CS) disc is expected to be a natural byproduct of the star forming process (e.g. Shu et al. 1987). This theoretical expectation has obtained wide support from optical (e.g. McCaughrean & O’Dell 1996), infrared (e.g. Marsh et al. 1995) and millimetre observations of young stars (e.g. Mannings & Sargent 1997). The CS disc is expected and observed to gradually disappear, but remnants are still found around several Main-Sequence (MS) stars, such as Vega (Aumann et al. 1984). Earlier and recent modelling of T Tauri discs have shown that the most successful models are flaring passive discs (Kenyon & Hartmann 1987, Chiang & Goldreich 1997).
Herbig Ae/Be stars (hereafter HAEBEs), first described as a group by Herbig (1960), are believed to be the more massive analogues of T Tauri stars. They are seen as the progenitors of Vega-type stars (for recent reviews, see Waters & Waelkens 1998; Natta et al. 1998). They are characterized by large IR excesses due to thermal re-emission of CS dust, show emission lines in their spectrum due to CS gas and have masses between 2 and 8 (Herbig 1960). Infrared spectroscopy offers a unique opportunity to scrutinize the composition and characteristics of their CS dust. Recent ISO (Kessler et al. 1996) studies have revealed a large variety in the properties of the dust around HAEBEs, from which it became clear that their dust is significantly different from that in the interstellar medium (Waelkens et al. 1996, Malfait et al. 1998a, Malfait et al. 1999b, van den Ancker et al. 1999).
| (1) | (2) | (3) | (4) | (5) | (6) | (7) | (8) | (9) | ||
| Group | Object | Spectral | log | d | log (Age) | |||||
| Type | (K) | (pc) | (yr) | (mJy ) | (m) | |||||
| AB Aur | B9/A0Ve | 9750 | 5.0 | 144 | 6.3 | 0.07 | 11 | 1.1 | 0.48 | |
| Ia | HD100546 | B9Ve | 11000 | 4.5 | 103 | 7.0 | 0.00 | 12 | 1.2 | 0.51 |
| HD142527 | F7IIIe | 6250 | 4.0 | 200 | 5.0 | 0.08 | 166 | 1.1 | 1.06 | |
| HD179218 | B9e | 10000 | 5.0 | 240 | 5.0 | 0.06 | 11 | 1.7 | 0.62 | |
| HD100453 | A9Ve | 7500 | 4.5 | - | - | 0.06 | - | 1.2 | 0.54 | |
| Ib | HD135344 | F4Ve | 6750 | 4.5 | 84 | - | 0.00 | 4 | 1.1 | 0.44 |
| HD139614 | A7Ve | 8000 | 4.5 | 151 | - | 0.01 | 14 | 1.5 | 0.39 | |
| HD169142 | A5Ve | 10500 | 4.5 | 145 | - | 0.00 | 12 | 1.6 | 0.10 | |
| HD104237 | A4Ve | 10500 | 4.5 | 116 | 6.3 | 0.25 | 3 | 1.2 | 0.13 | |
| HD142666 | A8Ve | 8500 | 4.5 | 116 | - | 0.40 | 4 | 1.1 | 0.28 | |
| IIa | HD144432 | A9Ve | 8000 | 4.5 | 200 | - | 0.05 | 4 | 1.1 | 0.26 |
| HD150193 | A1Ve | 10000 | 4.0 | 150 | 6.3 | 0.30 | 3 | 1.2 | 0.15 | |
| HD163296 | A3Ve | 10500 | 4.0 | 122 | 6.6 | 0.02 | 34 | 1.2 | 0.16 | |
| 51 Oph | A0Ve | 10000 | 4.0 | 131 | 5.5 | 0.03 | .8 | 2.3 | 0.024 |
References: (1): Malfait et al. (1998b), Dunkin et al. (1997), Gray & Corbally (1998); (2), (3) and (6): Malfait et al. (1998b); (4) and (5): van den Ancker et al. (1999); (7) and (9): this study, based upon sub-mm measurements by Sylvester et al. (1996), Mannings & Sargent (1997), Walker & Butner (1995), Henning et al. (1998) and Mannings & Sargent (2000); (8): this study.
This paper is one in a series of papers based upon ISO-SWS observations of HAEBE stars. In this study, we compiled a set of data which include, next to the ISO spectra, also UV, optical, IR and sub-mm photometry of a large sample of isolated HAEBE stars. A similar study was already presented by Sylvester et al. (1996) for a sample of Vega-like systems. Their ground-based observations in the IR with UKIRT are restricted to 2 ranges: 7.5-13.5 m and 15.8-23.9 m. Some of their sources (HD135344, HD139614, HD142666, HD144432, HD169142 and 51 Oph) are also part of our HAEBE sample, and it is interesting to compare their results with ours. In this paper we give an overview of the IR features in our sample, together with a description of the Spectral Energy Distributions (SED) and we propose a global model to explain the SEDs. In Sect. 2, we describe our sample stars and their observations. We also present the SEDs (see Fig. 1) and indicate observational trends. ISO-SWS spectra and an inventory of solid state and PAH bands are shown in Sect. 3, where the individual sources are discussed as well. In Sect. 4 we propose a global model, and discuss grain processing. Our conclusions are summarized in Sect. 5. In a forthcoming paper, detailed radiative transfer models of some of the sources will be presented (Bouwman, Meeus & Waters, in preparation).
2 Targets and Observations
The objects we selected are fourteen so-called isolated HAEBE stars. These HAEBE stars are not located inside a star-forming region, but show all the other characteristics of a HAEBE star and are presumably the somewhat more evolved members of the HAEBE group. These objects are best suited for our purpose, which is to discuss the evolution of the CS disc, and offer the additional advantage that the spectra are not strongly affected by loosely bound remnants of the star formation process, but only show the emission of the disc. In Table 1 we list the programme stars and among others their main parameters: spectral type, effective temperature and log .
The sources have been observed with the ISO Short Wavelength Spectrometer (SWS; de Graauw et al. 1996) in mode AOT1. The spectra cover an interval from 2 to 45 m. Some stars have also been observed with ISO-LWS (Clegg et al. 1996), which covers a range from 45 to 200 m. These spectra were discussed by Malfait et al. (1998a, 1999a,b). In this study we will concentrate on the SWS data. The spectra were reduced in a standard way using the ISO-SWS Interactive Analysis (IA) tool containing pipeline processing steps of OLP version 8.5, and the ISO Spectral Analysis Package (ISAP version 1.6a). In Fig. 2 the reduced SWS spectra are shown. For some sources (HD135344, HD150193 and 51 Oph), the ratio signal-to-noise is so low at longer wavelengths that we had to leave out the part longwards of 28 m.
2.1 Spectral Energy Distributions
We also collected photometric data in the literature (Malfait et al. 1998b and references therein; sub-mm data from Sylvester et al. 1996, Mannings & Sargent 1997, 2000; Walker & Butner 1995, and Henning et al. 1998), and composed for each star an SED, ranging from the UV until the sub-mm region. In Fig. 1, we show for each of the fourteen sources its SED, combined with their respective ISO spectrum. An appropriate Kurucz (1993) model atmosphere was fitted through the optical data, representing the photospherical contribution; it emphasizes the shape and the amount of the excess in the IR and sub-mm region. The shortest wavelength at which an excess is discernible is listed in Table 1 as , with an uncertainty of 0.2 m. Also shown in Table 1 is the derived fractional luminosity of the dust, , which is the ratio of the energy radiated by the dust to the stellar luminosity. This ratio was calculated as follows: first, we converted the data into the versus scale. Then we integrated the Kurucz model over its entire wavelength range to calculate . To obtain , we first subtracted the Kurucz model from the observations, and then integrated this curve longwards of . Sylvester et al. (1996) have already calculated this ratio for six of our sample stars, and their results agree very well with four of our stars, while they agree less well for HD135344 (0.64) and HD1444432 (0.48). The values we obtained for are consistent with a passive reprocessing disc, except for the star HD142527 ( = 1.06).
The dust continuum behaves very differently from source to source, especially in the mid-IR (15 to 45 m). In some stars it is rising, in other stars it is rather flat or even descending. Also the strength of the dust continuum in these objects is very diverse: the 12 m excess ranges between 3.5 and 7 magnitudes, the 60 m excess ranges between 4.5 and 12 magnitudes and the 1.3 mm excess between 10 and 13 magnitudes. A second important observational fact is the strong variation of the strength of the 10 m silicate feature from one object to another. In some objects (e.g. HD144432) this feature is very strong, in others (e.g. 51 Oph) it is less so, and in several objects (e.g. HD169142) it is even absent.
Notwithstanding these large differences, the overall structure of the dust discs seems to be similar. It is possible to decompose the spectra into at maximum three components: a power-law, a black body (BB) and the solid state bands. As a first step, we fitted the IR continuum of the stars showing a flat continuum with a power-law. Actually, the determination of the continuum is non-trivial and should be taken with some caution. After some experiments, we found that the continuum can be best determined by plotting the spectrum as log versus log . As an example, we show in Fig. 3, upper panel, how the continuum determination was done for HD150193. It is surprising to see that for at least six sources (HD104237, HD142666, HD144432, HD150193, HD163296 and 51 Oph), the continuum can be fitted very well with a power-law. We have to remark here that we did not remove the photospheric component, since it is only a negligible ( 10 %) fraction of the total flux. Only for one source, 51 Oph, the dust component is less dominant, and the photospheric contribution to the total flux in the IR is much more important. We therefore did not determine the power-law continuum for this source.
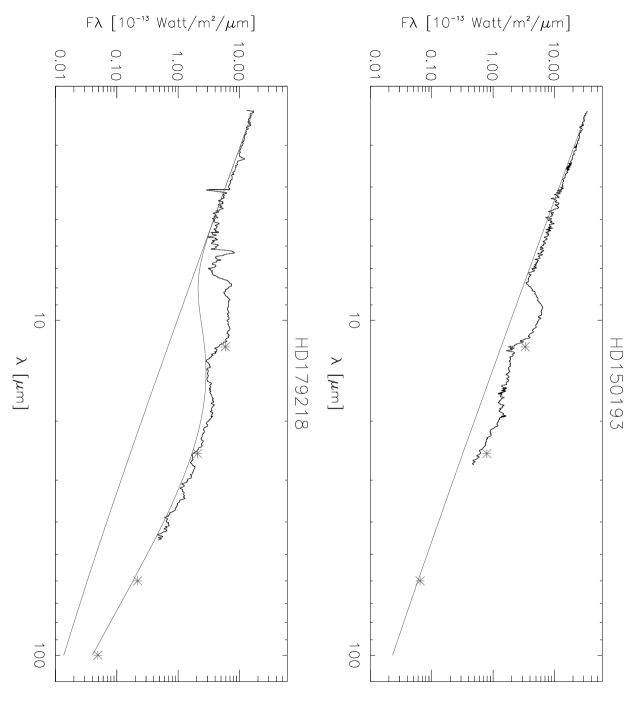


We then proceeded to fit the sources with a rising mid-IR continuum, assuming we could apply a similar power-law continuum fit for these sources. This assumption is supported by the similarity in the near-IR region for all our sample stars. For these sources, such as HD179218 (see Fig. 3, lower panel), an additional black body111This BB component is usually a single-temperature BB, but it also can be a set of typically 2-3 BBs with different temperatures, to which we refer to as ’the’ BB component for convenience, as an analogue to the power-law continuum. (BB) on top of a power-law is needed to fit the continuum. Remarkably, with just these two components (a power-law and a BB), the continuum of all sources can be fitted. The slope of the power-law fits are listed in Table 2, together with the average temperature of the respective BBs, when needed. In the sub-mm region, we observe a turn-down in the slope of the continuum. This is because sub-mm wavelengths are longwards of the peak of the black body for the coolest grains in the disc (thus we observe a Rayleigh-Jeans tail in the SED).
We have accordingly classified the sample: group I contains sources for which the continuum can be reconstructed by a power-law and a black body, and group II sources only need a power-law to fit their continuum. The groups can be further subdivided according to the presence or absence of solid state bands. In group Ia/IIa sources solid state bands are present, while group Ib/IIb sources are without solid state bands. Our sample does not contain a source which would fit in group IIb, i.e. there is no star in our sample with a pure power-law continuum which lacks solid state bands. This can be an observational selection effect, as sources without a BB continuum are already fainter than others. We thus have three distinct groups in our sample. In Fig. 4 we display the combined SWS spectra of the fourteen HAEBE objects arranged in these three groups.
If we neglect the silicates, then the shape of the IR spectra of group Ia and Ib sources is very alike. They both have a prominent cool dust component, rising in the mid-IR. What remains of the group Ib spectra after continuum subtraction is essentially the same as for those of group Ia sources without their silicate features. This is shown in Fig. 5, where we compare HD179218 (group Ia) with HD100453 (group Ib). Adding the right amount of amorphous and crystalline silicate components, we can obtain the spectrum of HD179218 starting from HD100453. It is striking that both groups seem to have a similar continuum, yet the silicates behave completely different in both sources.
To summarize these observational data, it first appears that both the near-IR and sub-mm excesses are similar for all stars in our sample; the mid-IR flux, on the contrary, shows large source to source differences. Furthermore, the spectra can be decomposed into at maximum three parts: a power-law, a BB and the solid state bands.
| Group | Source | IR | BB | sub-mm |
|---|---|---|---|---|
| slope | Temp. (K) | slope | ||
| Ia | AB Aur | -1.20 | 93 | -4.28 |
| Ia | HD100546 | -1.17 | 170 | *-3.08 |
| Ia | HD142527 | -1.15 | 73 | -3.60 |
| Ia | HD179218 | -1.09 | 195 | -4.28 |
| Ib | HD100453 | -1.03 | 148 | - |
| Ib | HD135344 | -1.43 | - | -3.28 |
| Ib | HD139614 | -1.31 | 169 | -3.20 |
| Ib | HD169142 | -1.25 | - | -3.24 |
| IIa | HD104237 | -1.10 | absent | *-2.81 |
| IIa | HD142666 | -1.03 | absent | -2.91 |
| IIa | HD144432 | -1.32 | absent | -2.65 |
| IIa | HD150193 | -0.95 | absent | *-2.67 |
| IIa | HD163296 | -1.07 | absent | -2.94 |
| IIa | 51 Oph | - | absent | - |
2.2 Properties of the cold grains: mass and grain size
The sub-millimetre flux is substantial in all our programme stars, with the exception perhaps of 51 Oph. This implies that a large amount of cold, large grains must be present further away from the star. The group-averaged sub-mm excesses are comparable. To compare the mass of the cold dust between different groups, we calculated , a normalization of the cold dust mass which assumes that the stars are at the same distance. These data are also listed in Table 1. The amount of cold dust does not differ substantially between the three groups.
A first indication of the size of the cold grains can be obtained by inspecting the far-IR to sub-mm region. All our programme stars show a turnover in their SED at far-IR wavelengths, indicating that at sub-mm wavelengths we observe the Rayleigh-Jeans (R-J) SED of the ensemble of cold grains present in the disc. If these grains are large compared to the wavelength at which they radiate, the spectral slope will be , while for small grains this slope will be equal to , where p is defined from , it is the slope of the emissivity law of the dust at sub-mm wavelengths. Estimating the size based on spectral indices should be done with some caution, since the grain emissivity and the temperature distribution of the grains in the disc also affect this slope.
Spectral sub-mm slopes have been determined for our sample and are shown in Table 2. Our sample shows a fair similarity in spectral slope, except for the stars AB Aur and HD179218. For AB Aur, the determination of the slope is more accurate than for HD179218, because the last source has only two sub-mm points at a small -interval. As was already noted by van den Ancker et al. (1999), AB Aur has a very steep spectral slope (); both stars jump out when compared to the average of our sample (); the slope of AB Aur and HD179218 is significantly steeper than that of the tail of a black body (). Bouwman et al. (2000) show that in AB Aur the 10 m silicate band and the mid-IR continuum are dominated by micron-sized grains, while the millimetre continuum is produced by grains with typical sizes of several 100 microns. These grains are optically thin at sub-millimetre wavelengths, contrary to millimetre-sized grains around other HAEBE stars (such as e.g. HD163296, van den Ancker et al. 2000). Possibly the grain size distribution in HD179218 is more similar to that of AB Aur, with somewhat larger grains (but still in the range of 100 m size) producing the sub-millimetre flux. Sylvester et al. (1996) already noted from their mm/sub-mm photometry that the dust grains around most of their Vega-like systems are much larger than those found in the interstellar medium (sub-m sized, Mathis et al. 1977).
3 ISO-SWS spectra and their wealth of features
| Feature | PAH | PAH | PAH | PAH | Si-O | PAHa | Oliv. | Oliv. | O-Si-O | Oliv. | FeO | Oliv. | Oliv. | Oliv. | ice |
| [3.3] | [6.2] | [“7.7”] | [8.6] | [9.7] | [11.2] | [11.3] | [16.3] | [19] | [19.8] | [23] | [23.8] | [27.9] | [33.7] | [43.8] | |
| AB Aur | - | - | - | - | - | - | - | - | |||||||
| HD100546 | |||||||||||||||
| HD142527 | - | - | ? | b | - | - | - | ? | ? | c | |||||
| HD179218 | ? | b | ? | ? | ? | ||||||||||
| HD100453 | ? | - | - | - | - | - | - | - | - | - | - | - | |||
| HD135344 | ? | - | ? | - | - | ? | - | - | - | - | - | n.a. | n.a. | n.a. | n.a. |
| HD139614 | - | - | - | - | - | - | - | - | - | - | - | - | - | - | - |
| HD169142 | ? | - | - | - | - | - | - | - | - | - | - | ||||
| HD104237 | - | - | - | - | - | ? | - | ? | ? | ? | ? | - | |||
| HD142666 | ? | ? | b | - | - | ? | - | ? | - | ||||||
| HD144432 | - | - | - | - | - | ? | - | - | n.a. | - | n.a. | n.a. | |||
| HD150193 | - | - | - | - | - | - | - | ? | n.a. | n.a. | n.a. | n.a. | |||
| HD163296 | - | - | - | - | - | ? | ? | ? | ? | ||||||
| 51 Oph | - | - | - | - | - | ? | - | - | ? | n.a. | n.a. | n.a. | n.a. |
a possible blend with the olivine 11.3 m band
b possible blend with the PAH 11.2 m band
c doublepeaked at 43.8 m, probably also due to montmorillonite
(Malfait et al. 1999a).
We describe general trends in the appearance of the solid state bands we have detected in our sample of stars. We have carefully inspected the individual spectra in order to verify the reality of solid state bands. This can be done by analyzing the individual detector scans, and by inspecting the two independent scan directions at which the data were taken. We list the solid state bands and their possible identifications in Table 3. The features for which we have an unsure identification are listed with a question mark. In particular, the PAH feature at 11.2 m can be easily confused with the olivine feature at 11.3 m. Caution should also be taken around 12 m, where an SWS band jump occurs. In Figs. 6 and 7, we show the continuum subtracted spectra in the 6 to 14 m wavelength region and the 15 to 30 m wavelength region respectively, highlighting the solid state bands found in these spectral regions. Below, we briefly discuss the different solid state components.


3.1 The 2-7 micron wavelength region
From Fig. 4, one can observe immediately that there is a striking similarity between the spectra from 2 to 7 m in all three groups, indicating a similar composition and temperature distribution of the material emitting in this range. This near-IR excess must be caused by small hot grains, most likely metallic Fe (or FeO), or a carbonaceous component, e.g. graphite or amorphous carbon (van den Ancker et al. 1999, Bouwman et al. 2000), as other materials would not survive the high temperatures ( 1000 K) close to the star.
3.2 The PAH bands
PAH bands are present in group Ia and Ib sources, and only weakly in one source of group II (HD142666); they are seen in at least 50% of our total sample. This number might still go up as weak features can be lost in the noise. PAHs are strongest in early type sources, as can be expected (since they are excited by UV radiation). That the PAHs most probably belong to the stellar environment can be ascertained from e.g. ISOCAM data of HD 179218, a source with is not extended (Siebenmorgen et al. 2000). Another interesting observation is their different appearance, at e.g. 6.2 m. PAHs in the ISM and in HII regions peak at 6.20 m, while at our stars they rather peak at 6.25 m. A preliminary result in this context is that non-extended sources tend to have PAHs at 6.25 m (Van Kerckhoven, private communication). A more detailed study will follow (Van Kerckhoven C., in preparation; Peeters E., in preparation).
3.3 The silicates
In Fig. 6 and 7, we show the regions surrounding the strongest amorphous silicate bands. We also included a spectrum of the M supergiant Cep (Kemper, private communication) and the galactic center (Lutz et al. 1996, Tielens, private communication), as prototypes of amorphous silicate. The spectra of group Ib sources are not shown, as they do not show silicate bands. The 8-12 m silicate features are significantly different from the so-called ’astronomical silicate’, in the sense that they peak at 11 m rather than at 9.7 m. The only exception is AB Aur, a group Ia source. The peak shift is attributed to a change in the grain size distribution towards larger (m-sized) grains, and/or the presence of crystalline olivine, causing a peak at 11.3 m (Bouwman et al., in preparation).
In some sources such as HD100546, there is a large amount of crystalline silicates (Malfait et al. 1998a), while in other sources, such as HD163296, it is less so. That both AB Aur and HD100546 are members of group Ia, shows that the crystallization degree of the silicate material is independent of the shape of the overall spectrum. The interpretation from sub-mm data that AB Aur has the least processed dust (smallest grains at sub-mm wavelengths) is here further supported by the lack of crystalline features in its spectrum. We, however, derived a similar slope for the sub-mm region of HD179218 (see Sect. 2.2), a source with a large amount of crystalline silicates. The determination of this slope was less accurate, but it is for sure steeper than the other sources. From this we can infer that coagulation and crystallization processes occur on different time-scales.
3.4 The 23 micron feature
The [15-30] m spectra (see Fig. 7) of group Ia and IIa sources are even more diverse than the [6-14] m spectra. From the spectrum of Cep, we can see that the amorphous silicates alone can not account for the broad bands seen in other sources, e.g. AB Aur and HD142666. An additional component, around 22-28 m must be present as well. This component can be attributed to FeO (van den Ancker et al. 2000) and/or crystalline silicates. 51 Oph shows two clearly separated bands, supporting our interpretation of the two component broad band. The same region for group Ib sources can be fitted very well with black bodies with a temperature ranging between 150 and 170 K. Also here we see no indication for silicate bands in group Ib sources.
3.5 Notes on individual sources
Group Ia:
AB Aur: The 10 m region of AB Aur shows a broad silicate
feature superposed on a rising continuum. The feature peaks at
9.7 m, which is typical for amorphous silicate. It is the only
source in our sample to show merely pure amorphous silicates. The
20 m region shows a broad band, probably due to a combination of
silicates and iron oxide. PAH bands are moderately strong, and present
at 6.2, 7.7, 8.6 and 11.2 m. This star has the steepest spectral
slope at sub-mm wavelengths. For a thorough analysis of this star, we
refer to van den Ancker et al. (1999) and Bouwman et al. (2000).
HD100546: This star is thoroughly analyzed by Malfait et al. 1998a.
Amorphous silicate emission bands are visible at 10 and 18 m. It has the
largest amount of crystallinity in our sample, and shows strong PAH
bands at 3.3, 6.2, 7.7, 8.6 and 11.2 m. The similarity with the SWS
spectrum of comet Hale-Bopp is remarkable (Waelkens et al. 1998). The
comet Hale-Bopp is an end result of grain processing in our solar system.
Given the large similarities in spectral appearence with HD100546, we
can assume that the same kind of dust processing has taken place in
both sources.
HD142527: The silicate feature at 10 m is shifted to longer
wavelengths, pointing to the presence of crystalline silicates. The
continuum rises from longer wavelengths on than most sources, pointing
to colder dust. Weak PAH bands are present at 3.3, 6.2 and 11.2 m.
We refer to Malfait et al. (1998a) for more details. This star is special
because it has a large ratio, typical for stars
with an active disc. But these stars also show evidence for outflow,
what is not observed in HD142527. Another explanation for the large IR
luminosity is the presence of a more embedded companion, but this still
needs to be investigated.
HD179218: The overall shape of this spectrum is quite similar to
that of HD100546. It shows the 10 m silicate feature, and has a rising
continuum. The abundance of crystalline silicates is less, but still quite
high. This source has a higher abundance of crystalline pyroxenes than
crystalline olivines, unlike observed in other sources (Malfait 1999b).
Strong PAH bands are present at 3.3, 6.2, 7.7, 8.7 and 11.2 m.
Group Ib:
HD100453: This star does not show silicate emission bands.
It has a rising continuum and moderately strong PAH bands are present
at 3.3, 6.2, 7.7 and 11.2 m.
HD135344: In this source the silicates are absent. The spectrum
shows a rising continuum, but beyond 27 m the spectrum is no longer
usable due to low S/N. Weak PAH bands are present at 3.3, 7.7 and 11.2 m.
HD139614: Also here there are no silicate bands. The spectrum
shows a rising featureless continuum, PAH bands are absent.
HD169142: Moderately strong PAH bands are present at 3.3, 6.2,
7.7, 8.7 and 11.2 m. The spectrum shows a rising spectrum without
silicate emission bands.
Group IIa:
HD104237: The 10 m spectrum shows a very strong silicate
feature, superimposed on a flat continuum. The feature peaks longwards
of 10 m, so that crystalline silicates and/or larger silicate grains
must be present. PAH bands are absent.
HD142666: The spectrum shows a flat continuum, upon which the
10 m feature is superimposed, peaking at 10.3 m. Very weak PAH
bands are present at 3.3, 6.2, 7.7, 8.6 and 11.2 m. The
20 m region shows a broad band, probably consisting of silicate and
FeO.
HD144432: The spectrum of HD144432 is very similar to that of
HD142666, but PAH bands are absent. Interestingly, these 2 sources are
in general quite similar, the most important difference being the
inclination of their disc (Meeus et al. 1998). The 20 m region shows
a broad band, probably consisting of silicate and FeO.
HD150193: This source has a very strong 10 m feature,
superimposed upon a flat continuum. The shape of the spectrum around
20 m is very peculiar, and we are not sure if it is an artefact
or real. PAH bands are absent.
HD163296: The 10 m silicate feature is superposed on a flat
continuum. The 20 m region shows a broad band, probably consisting
of silicate and FeO. PAH bands might be present, but we cannot
ascertain this. We refer to van den Ancker et al. (1999) and Bouwman
et al. (2000) for more details and modelling.
51 Oph: This source is the most extreme, in the sense that its
turn-over point towards the R-J tail already starts at 30 m;
from which we can conclude is has a smaller amount of dust.
It also has a very rich spectrum, with both gas ( at
4.2 m and at 5-6 m) and solid state bands.
The 10 m silicate feature is strong and imposed on a
descending continuum. The 20-30 m region shows two clearly
separated bands, which we can attribute to amorphous silicate
(18 m), and to FeO or crystalline silicate (23 m). The
evolutionary status of 51 Oph is not very clear. Some authors
classified this object as a Be star (Slettebak 1982), while others
consider it as a Herbig Ae/Be star (Malfait et al. 1998b) or even a Vega-type
star (Sylvester et al. 1996). A more detailed study of this object will be
presented elsewhere (Meeus et al./van den Ancker et al., in preparation).
4 Discussion
Two important results of the comparative study of the SEDs of the programme stars concern the near-IR and the sub-mm excess: 1. a similar near-IR (1-8 m) excess is observed for all stars. Small hot grains close to the star must be replenished because they are continuously destroyed by the UV radiation of the star. The overall IR spectrum being so diverse, but the near-IR so similar indicates that the material close to the star is homogenized; 2. the sub-mm excess is substantial for all stars in our sample. This implies that large grains already formed when the star formation process comes to an end, and that large grains remain present around the stars during their evolution towards Vega-type stars. In a survey of T Tauri Stars (TTS), Beckwith et al. (1990) also found that the disc mass does not decrease with increasing stellar age. Warm grains, however, seem to disappear on a shorter time-scale.
The third remarkable observation is the strong variation in strength of the silicate feature: for some stars it dominates the ISO spectrum, for others it is moderately strong, and for some stars it is even absent. It is surprising that there is no relation between the silicate feature at 9.7 m and the near-IR excess, although both emission features must be caused by hot material, presumably located in the same region, and consisting of grains of a similar size. We can already exclude inclination angle effects since our sample includes two objects, HD142666 and HD144432, with a very different inclination (Meeus et al. 1998) but with almost identical ISO spectra, both showing a prominent 10 m silicate band. There are several possible explanations to our observations, and these ’scenarios’ will need to be confirmed by more detailed observations and by careful modelling of the CS material. In the following subsection we propose a global model.
4.1 Geometry of the disc and its effects on the SED
As stated before, the main difference between group I and II sources is the amount of mid-IR excess, which is dominant and rising for group I sources, while moderate and rather descending for group II sources. Both groups also differ as far as the total IR luminosity is concerned: is on average 0.52 and 0.17 for group I and II respectively (see Table 1). Group II sources thus have the smallest emitting surface, and probably the smallest mass of warm dust. On the other hand, the solid state bands are present with equal average strength in group Ia and IIa sources: the solid state bands thus must be formed in yet another region. Natta et al. (2000) calculated the silicate 10 m feature intensity with the models of Chiang & Goldreich (1997), and they needed to add a power-law component to the emission of the disc atmosphere to fit their 10 micron spectra of T Tauri Stars; this finding supports our distinction between the region in which the solid state bands are formed and the region from which the power-law emission originates.
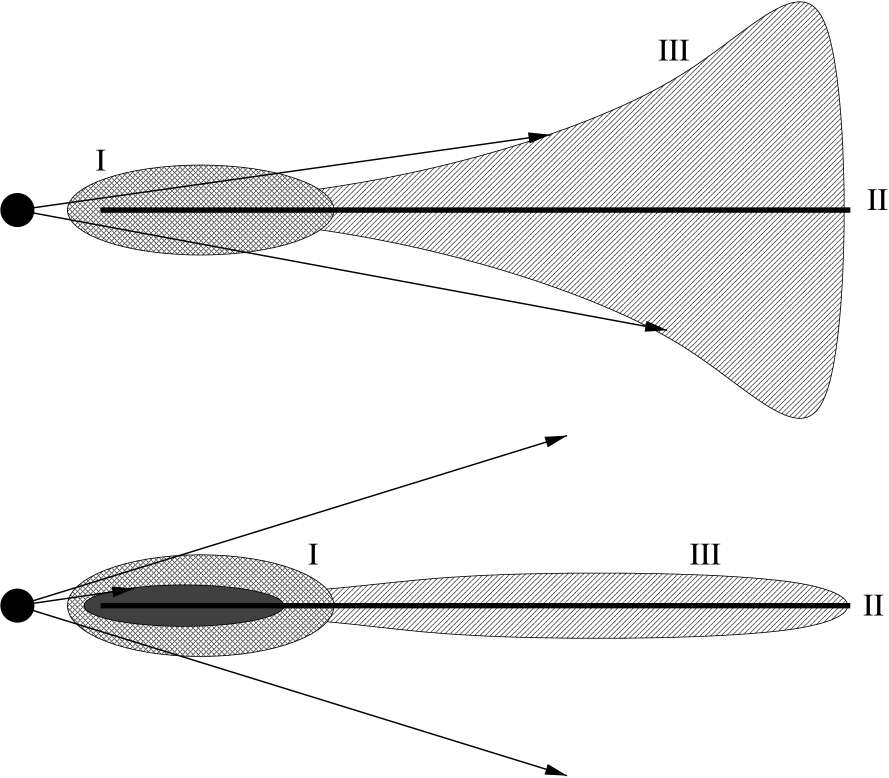
The classification of our sample of HAEBE stars into two main groups could be explained with the following simple physical picture, which is shown schematically in Fig. 8 (upper panel: a group I source, lower panel: a group II source) and consists of the following components: I) a (partially) optically thin inner part ( 10 AU in size); II) an optically thick, geometrically thin disc which forms in an early stage; and III) a flaring part, exposed to stellar radiation. Similar geometries were suggested in studies of protostellar accretion discs by e.g. Bell et al. (1997) and Nelson et al. (2000). There it is shown that the protostellar discs can have an inner disc ( 10 AU in size) with increased scale height (i.e. ”puffed up”) which can shield the outer parts of the disc so that no flaring occurs. One can explain the SEDs of group II sources by assuming that the inner part (component I lower panel Fig. 8) is partially optically thick, shielding the outer parts of the disc from direct stellar radiation, which prevents the disc from flaring (hence one does not observe a BB component). SEDs of group I sources then can be explained by an additional flared component outwards of an optically thin inner disc which does not shield. The non-occurence of a group IIb source could be a selection effect, since one would expect such sources to have the lowest flux levels.
The emission of an optically thick, passive disc varies as (Friedjung 1985). The average IR slope for the sources in our sample is -1.2, very close to the value for the slope of optically thick discs. There is, however, some dispersion in our slopes, but nevertheless the assumption of an optically thick disc to explain the power-law component seems to hold when confronted with theoretical models.
In what follows we discuss the separate components of our model and how they appear in the SED:
-
•
the geometrically thin, optically thick midplane consists of large grains, and is responsible for the IR power-law and the sub-mm continuum emission. Here resides the bulk of the material (Bouwman et al. 2000). The small hot grains in the inner part of the disc are responsible for the near-IR excess. The similarity of the spectra in this wavelength range suggests a very similar chemical composition and temperature distribution.
-
•
hot grains in a (partially) optically thin ”disc atmosphere” cause the 10 and 18 m amorphous silicate emission bands. That the solid state bands are indeed likely not to originate from the flared region around the disc is evidenced by: 1) our group IIa observations (solid state bands are present, but the BB caused by the flaring is absent); 2) the fact that silicate grains causing the 10 m emission are too large to be transiently heated, so they have to be located close to the star; and 3) observations of evolved objects by Molster et al. (2000), who notice that disc sources have a high abundance of crystalline silicates. Where this optically thin region is located exactly is not clear, but it certainly must be close to the disc and to the star.
-
•
the geometrically thick, optically thin, flared dust layer below and above the midplane is well mixed with the gas and contains small, warm grains that cause the 100-200 K black body component. Only a small amount of the total disc mass is located in this flared region. In group II sources this region must be very small or even absent, since we only see a power-law continuum in the IR. This conclusion is also supported by theoretical models from Kenyon & Hartmann (1987), which give an upper value for for flat discs of 0.25, while flaring discs have larger IR luminosities. When comparing the values we determined for (see Table 1) with their predictions, we see that group II sources indeed have values arguing for a flat disc. The scale-height of the flaring determines the amount of mid-IR excess: the larger the flaring, the stronger the excess. The temperature of the BB is determined by the distance of the onset of the flaring to the central star: the further away the flaring starts, the colder the BB. If we e.g. compare HD179218 with HD142527, then the flaring must start further away for the latter object, as evidenced by its BB temperature (see Table 2). That PAHs are only present in group I sources, with the exception of HD142666 (group IIa, but only very weak PAH features), suggests that PAHs are most likely located in the flared region, where they are exposed to the stellar UV radiation. They are small enough to be transiently heated, without needing to be located close to the star.
Other geometries interpreting the SEDs of HAEBEs have been proposed, e.g. Miroshnichenko et al. (1999) propose an envelope in addition to a disc to model the dust emission from HAEBEs. We note, however, that the highly abundant crystalline silicates in HD100546 (that have a temperature of 200 K or less, Malfait et al. 1998a) are most probably formed in the disc (Molster et al. 1999), suggesting that the grains at this temperature are not in a loosely bound envelope, but are intimately connected to the disc. We suggest that the 200 K black body component in this star, and by analogy in other HAEBE stars in our sample, is associated with the (flared) disc and not with an envelope. Waelkens et al. (1994) and van den Ancker et al. (1997) interpret the apparent broad dip around 10 micron in the SEDs of HAEBEs as a physical gap in the radial distribution of the CS dust (there is simply no dust at a certain distance to the star, corresponding with the region where the 10 micron flux should come from). To cause a physical gap, another body surrounding the central star must be present as well. In the light of these different possibilities, detailed spatial information is essential to disentangle the location of the different spectral components.
4.2 Evidence for grain growth
Evidence for grain growth in the discs of HAEBEs has been found by several authors. Radiative transfer modelling by e.g. Bouwman et al. (2000) shows that the dust grains around the Herbig Ae stars AB Aur and HD163296 are much larger than those of the ISM. Furtheron, Grady et al. (1996) observe accreting CS gas in HAEBEs and attribute this to large infalling objects. A population of large ( 0.1-1mm) grains is needed to explain the observed sub-mm fluxes in our sample. These observations show that grains growth indeed takes place around HAEBE stars, and that it is an on-going process which we can observe indirectly by looking at a large sample of objects.
We now consider the cause of the difference in SED between group I and II sources. If our interpretation of a flared region above and below the disc causing the BB component is correct, its absence in group II sources may imply that these small, warm grains have been removed due to coagulation and/or to radiation pressure exerted on the grains by the central star, so that the small warm grains have slowly disappeared and their scale-height has diminished accordingly. The absence of PAH bands in group II stars already supports the assumption that small grains are removed in the extended region. If we expect grains to grow during the star’s evolution towards the MS, then the excess as a whole should decrease. This is consistent with the amount of IR luminosity we derive from the SEDs: stars from group II show a smaller ratio than group I stars, so that group II sources may have the most evolved dust grains. This simple evolutionary assumption is supported by observations of TTSs by Beckwith et al. (1990), where it is shown that older discs tend to be colder and less luminous. The grain-growth assumption to explain the differences between group I and II also holds in the sub-mm region: from Table 2 it is clear that group II sources have a less steep sub-mm slope than group I sources (on average -2.8 versus -3.6), which means that the latter have smaller grains radiating in this region.
To conclude, the SEDs are consistent with a disc model in which the differences between group I and group II can be explained by a different extent of the warm flared layer above and below the mid-plane. Both the ratio and the sub-mm slope suggest that group II sources have larger grains than group I sources. These observations are consistent with an evolution from group I to group II sources. However, a larger sample and spatial information are needed to prove such an hypothesis.
4.3 Influence of the stellar age on dust properties
The age of the sample stars was derived by van den Ancker et al. (1998) using Hipparcos parallaxes, and is listed in Table 1. Unfortunately, we do not dispose of ages for group Ib stars. We are aware of the fact that our sample is biased towards the more evolved sources, since our sources are isolated. However, we can already reach some conclusions. There is no clear trend between age of the central star and amount of crystalline material: the star HD100546 (showing the largest amount of crystalline dust) is probably the most evolved one, while HD179218 (probably the youngest source) also shows a substantial amount of crystalline dust. AB Aur, on the other hand, is also already more evolved, but shows only evidence for amorphous silicates. The range in age is very similar for group Ia and group IIa stars; from a confrontation between both groups we can conclude that the stellar age has no (or little) influence upon: 1) coagulation, since group IIa stars have a less steep sub-mm slope than group Ia stars; 2) amount of material in the flared region, as this is much less or even absent in group IIa stars; and 3) presence of PAH bands, as they are merely absent in group IIa stars. We thus conclude that the timescales on which star and disc evolve are not strongly coupled for the sample of HAEBEs studied here.
4.4 The amorphous silicate behaviour
It is surprising that the silicate feature is absent in group Ib sources, as the rest of the SED argues for similar disc properties as for group Ia sources. It is not unreasonable to assume that grains grow during the stellar evolution towards the MS. Therefore, the absence of the silicate feature could be easily explained by the absence of small grains (with average sizes less than a few m). However, the presence of a near-IR excess points to the presence of small, hot grains. Furthermore, almost all of the group Ib sources show PAHs in their spectra, which are also caused by very small particles. It thus seems that the small silicate grains evolve differently than other small particles. The explanation for group Ib sources could be either that the inner part does not exists (e.g. could be geometrically thin, optically thick), or that there are no small ( 50 m) silicate grains.
Remarkably, in an atmospheric abundance analysis by the authors and another analysis by Dunkin et al. (1997), a silicon depletion around 3 out of 4 of the group Ib HAEBE objects was revealed, while sources from group Ia and IIa were shown to have solar abundances. The photospheric silicon depletion for group Ib stars may further support that around these stars, silicates behave differently. There are three possibilities to remove the small silicate grains selectively: 1) a composition effect; 2) a size-effect: the silicates are too large to be seen in that wavelength-region; or 3) aggregates with other materials. In what follows we will discuss these different effects.
1) A composition effect: We expect the strength of the silicate emission to be related to (among others) the amount of silicates, as the emitting dust around our sources is optically thin. However, it is unrealistic to assume that the sources which do not show silicate emission have no silicates at all in their disc. This would mean that there were no silicates in the material from which the group Ib stars are formed. This hypothesis is most unlikely, since the material from which stars are formed is the ISM, which is relatively uniform in composition. There is no reason to assume that the silicates were not there in the beginning around some stars and were there around others. Besides, the presence or absence of silicate emission does not depend on the initial composition: two very young HAEBE stars, 224 and 225 are located close to one another, so must be formed out of the same material. Surprisingly, the first object does not show any silicate band, while the second object does show silicate absorption (van den Ancker 1999). This observation favours a scenario where the presence or absence of silicate emission is determined by other characteristics than only the chemical composition of the CS disc.
2) A size effect: Since we found evidence for hot grains (from the 2-10 m excess) capable of producing a strong 10 m feature if they are (partially) composed of silicates, we must come to the conclusion that the silicate grains around e.g. HD100453 and HD169142 (both group Ib objects) do not produce a silicate bump because these grains are on average larger than the wavelength (i.e. 10 m). Large silicate grains result in an emission resembling a black body without strong spectral signatures reflecting the chemical composition. Also Hanner et al. (1994) conclude that the absence of small silicate grains is the cause for the weak silicate emission features in comets Austin and Okazaki-Levy-Rudenko.
The absence of the 10 m silicate feature does not necessarily mean that also the 18 m silicate feature must be absent: e.g. in NGC 6302 (Lim et al. 2000), the 10 m silicate feature is supressed because of the cold temperature of the silicate dust and the dominant emission of the C-rich dust, but a 18 m feature is observed. Therefore, we searched the group Ib sources for silicate features at 18 m. But unlike group Ia sources, group Ib sources do not require solid state bands in addition to the BB+power-law to fit their continuum. We cannot fully exclude the possibility that small silicates are present in the discs of group Ib stars, but they must be so by a much smaller amount and/or colder than in group Ia and IIa objects. Sylvester et al. (1996), however, claim to detect silicates (around 18 m) in the spectra of HD169142 and HD135344, indicating that these stars do have larger silicate particles; from our data, we cannot confirm this observation, however. Modelling should determine how much silicate material can be present in the dust without being revealed in the spectrum.
3) Another possibility is that, after coagulation, small silicate particles are locked up into larger grains, composed of both small silicate grains and some other material (as is seen in interplanetary dust particles (IDPs)). This would make them invisible if the mantle surrounding the silicate is sufficiently thick. If these coagulated grains are transported towards the star, the silicate material will start to evaporate when close enough, while Fe or carbonaceous material can survive at higher temperatures. This scenario can account for both the presence of a near-IR excess and for the absence of hot silicate grains.
5 Conclusion
ISO-SWS spectra have shown that there is a large diversity concerning IR spectral features and shapes in Herbig Ae/Be stars. The results from this ISO-sample can be summarized as follows:
-
1.
our sample of 14 HAEBE stars can be classified into two main groups, based upon the shape of the continuum (flat or rising); a division which is further supported by the decomposition of the continuum into a power-law and a BB
-
2.
the disc geometry is as follows: a geometrically thin disc being responsible for the power-law continuum, and a flared region of warm dust around the thin disc, causing a rising continuum in the IR. An optically thin inner disc causes the solid state bands. Hot dust in the inner part of the disc is responsible for the near-IR excess. This disc geometry has also been proposed for TTS (Chiang & Goldreich, 1997)
-
3.
the near-IR spectral region is very similar and the sub-mm emission substantial around all sample sources, indicating homogeneity of the hot material and survival of large grains throughout the whole pre-main sequence evolution towards the MS
-
4.
the mid to far-IR region, on the contrary, is very diverse, and we attribute this to the amount of flaring in the disc
-
5.
group I sources may evolve into group II sources; the latter have evidence for larger grains and lack the flared region present in group I sources
-
6.
the presence of PAH bands cannot be correlated to any of the stellar parameters, but they are only present in stars with a large amount of warm dust (group I). They are most probably located in an extended region around the disc, where they are irradiated by the star. Our PAH bands differ from PAH bands in the ISM
-
7.
surprising is the independent behaviour of the silicate grains: although other small particles are still present, small silicate grains seem to be absent around several stars. This poses an intriguing problem: what happens to the silicates, what causes them to behave so differently? It is important to get a definitive answer on the warm silicates, to know to which extent they can be hidden. Only then can the observations and proposed model converge to a consistent picture. Therefore, the next step in our study will be a detailed modelling of some of the sources
Acknowledgements.
We would like to thank B. Vandenbussche for assisting with the data reduction and IDL; R. Sylvester, C. Dominik and A. de Koter for discussions on CS discs; and S. Hony and C. Van Kerckhoven for fruitful discussions about PAHs. GM acknowledges financial support from the Flemish Institute for fostering scientific and technological research in industry (IWT) under grant IWT/SB/951067. LBFMW acknowledges financial support from NWO pionier grant number 616.078.333.References
- (1) Aumann H.H., Beichman C.A., Gillet F.C. et al. 1984, ApJ278, L23
- (2) Beckwith S.V.W., Sargent A.I., Chini R.S. Guesten R., 1990, AJ99, 924
- (3) Bell K.R., Cassen P.M., Klahr H.H., Henning T., 1997, ApJ486, 372
- (4) Bouwman J., de Koter A., van den Anker M.E., Waters L.B.F.M., 2000, A&A, submitted
- (5) Chiang E.I., Goldreich P., 1997, ApJ490, 368
- (6) Clegg P.E., Ade P.A.R., Armand C. et al. 1996, A&A 315, L38
- (7) Crovisier J., Leech K., Bockelee-Morvan D. et al. 1997, Sci 275, 1904
- (8) de Graauw M.S., Haser L.N., Beintema M.A. et al. 1996, A&A 315, L49
- (9) Dunkin S., Barlow M.J., Ryan S.G., 1997 MNRAS286, 604
- (10) Friedjung M., 1985, A&A 146, 366
- (11) Grady C.A., Perez M.R., Talavera A. et al. 1996, A&AS 120, 157
- (12) Gray R.O., Corbally C.J., 1998, AJ116, 2530
- (13) Hanner M.S., Lynch D.K., Russel R.W., 1994, ApJ425, 274
- (14) Henning Th., Burkert A., Launhardt R., Leinert Ch., Stecklum B., 1998, A&A 336, 565
- (15) Herbig G.H., 1960, ApJS4, 337
- (16) Kenyon S.J., Hartmann L., 1987, ApJ323, 714
- (17) Kessler M.F., Steinz J.A., Anderegg M.E. et al. 1996, A&A 315, L27
- (18) Kurucz, 1993, CD-ROM No. 1-18. Cambridge, Mass.: Smithsonian Astrophysical Observatory.
- (19) Lim T.L., Molster F.J., Sylvester R.J. et al. 2000, A&A , submitted
- (20) Lutz D., Feuchtgruber H., Genzel, R. et al. 1996, A&A 315, L269
- (21) Malfait K., Waelkens C., Waters L.B.F.M. et al. 1998a A&A 332, L25
- (22) Malfait K., Bogaerts E., Waelkens C., 1998b A&A 331, 211
- (23) Malfait K., Waelkens C., Bouwman J., De Koter A., Waters L.B.F.M., 1999a A&A 345, 181
- (24) Malfait K., 1999b, Ph.D. thesis, K.U. Leuven
- (25) Mannings V., Sargent A., 1997, AJ490, 792
- (26) Mannings V., Sargent A., 2000, ApJ529, 391
- (27) Marsh K.A., Van Cleve J.E., Mahoney M.J., Hayward J.L., Houck J.R., 1995, ApJ451, 777
- (28) Mathis J.S., Rumpl W., Nordsieck K.H. 1977, ApJ217, 425
- (29) McCaughran M.J., O’Dell C.R., 1996, AJ111, 1977
- (30) Meeus G., Walkens C., Malfait K., 1998, A&A 329, 131
- (31) Miroshnichenko A., Ivezic Z., Vinkovic D., Elitzur M., 1999, ApJ520, L115
- (32) Molster F.J., Yamamura I., Waters L.B.F.M., et al. 1999 Nature401, 563
- (33) Molster F.J., 2000, PhD Thesis, University of Amsterdam
- (34) Natta A., Grinin V.P., Mannings, V., 1998, PPIV, editors Mannings V., Boss A.P., Russell S.R., in press
- (35) Natta A., Meyer M.R., Beckwith S.V.W., 2000, ApJ534, 838
- (36) Nelson A.F., Benz W. et al. 2000, ApJ529, 357
- (37) Shu F.H., Adams F.C., Lizano S., 1987, ARA&A25, 23
- (38) Siebenmorgen R., Prusti T., Natta A., Mueller T.G., 2000, A&A, in press
- (39) Slettebak A., 1982, ApJS50, 55
- (40) Sylvester R.J., Skinner C.J., Barlow M.J., Mannings V., 1996, MNRAS279, 915
- (41) van den Ancker M.E., The P.S., Tjin A Djie H.R.E. et al. 1997, A&A 324, L33
- (42) van den Ancker M.E., de Winter D., Tjin A Djie H.R.E., 1998, A&A 330, 145
- (43) van den Ancker M.E., 1999, PhD Thesis, University of Amsterdam
- (44) van den Ancker M.E., Bouwman J., Wesselius P.R., 2000, A&A 357, 325
- (45) Waelkens C., Bogaert E., Waters L.B.F.M. 1994, in The nature and evolutionary status of Herbig Ae/Be stars. ASPC Vol 62, ed. The P.S., Perez M.R., Van den Heuvel E.P.J., p. 405
- (46) Waelkens C., Waters L.B.F.M., de Graauw M.S. et al. 1996 A&A 315, L245
- (47) Waelkens C., Malfait K., Waters L.B.F.M., 1998 Ap&SS 255, 25
- (48) Walker H.M., Butner H.J., 1995, Ap&SS 224, 389
- (49) Waters L.B.F.M., Waelkens C., 1998 ARA&A36, 233