A radio and optical study of Molonglo radio sources
Abstract
We present multi-wavelength radio observations with the Very Large Array and narrow- and broad-band optical observations with the 2.5m telescope at the Las Campanas Observatory, of a well-defined sample of high-luminosity Fanaroff-Riley class II radio galaxies and quasars, selected from the Molonglo Reference Catalogue 1-Jy sample. These observations were carried out as part of a programme to investigate the effects of orientation and environment on some of the observed properties of these sources. We examine the dependence of the Liu-Pooley relationship, which shows that radio lobes with flatter radio spectra are less depolarized, on size, identification and redshift, and show that it is significantly stronger for smaller sources, with the strength of the relationship being similar for both radio galaxies and quasars. In addition to Doppler effects, there appears to be intrinsic differences between the lobes on opposite sides. We discuss the asymmetry in brightness and location of the hotspots, and present estimates of the ages and velocities from matched resolution observations at L- and C-bands. The narrow- and broad-band optical images of some of these sources were made to study their environments and correlate with the symmetry parameters. Extended emission-line region is seen in a quasar and in four of the objects, possible companion galaxies are seen close to the radio axis.
keywords:
galaxies: active - galaxies: nuclei - quasars: general - radio continuum: galaxies1 Introduction
There has been a reasonable degree of evidence in support of the unified scheme for powerful radio galaxies and quasars, according to which these sources are intrinsically similar, but appear to be different because they are oriented at different angles to the line of sight (Scheuer 1987; Barthel 1989; Antonucci 1993; Urry & Padovani 1995). When the object is viewed within about 45∘ to the line of sight, it appears as a quasar, while it appears as a radio galaxy when it is oriented at larger angles. The quasars tend to have more prominent radio cores and and one-sided jets compared to radio galaxies, consistent with the ideas of the unified scheme. The prominence and apparent one-sidedness of jets is attributed to relativistic beaming of the radio emission in sources inclined at small angles to the line of sight. One of the strongest pieces of evidence in favour of the relativistic beaming hypothesis for the apparent asymmetry of the jets comes from the the discovery by Laing (1988) and Garrington et al. (1988) that double radio sources depolarize less rapidly on the side with the radio jet than on the opposite side. The approaching side is seen through less of the depolarizing medium, and the Laing-Garrington effect can be understood as an orientation effect (cf. Garrington, Conway & Leahy 1991; Garrington & Conway 1991). In addition to the effects of orientation, the depolarization of the lobes could also be affected by any asymmetry in the distribution of gas in the vicinity of the radio source. The possibility of an intrinsic asymmetry in the distribution of gas was suspected from the fact that the lobe on the jet side, which is approaching us, is often closer to the nucleus (Saikia 1981). An intrinsic asymmetry was demonstrated clearly by McCarthy, van Breugel & Kapahi (1991) who showed that there was invariably more emission-line gas on the side of the source which is closer to the nucleus. For a sample of 12 radio galaxies observed with the Very Large Array (VLA), Pedelty et al. (1989) found the arm-length ratios to be correlated with the amount of depolarization and emission line gas.
We have been making a systematic radio and optical study of a well-defined sample of Fanaroff-Riley class II radio sources selected from the 408 MHz Molonglo Reference Catalogue (McCarthy et al. 1990, 1996; Kapahi et al. 1998a,b; Baker et al. 1999), to investigate the effects of orientation and environment on the observed symmetry parameters and depolarization characteristics of the lobes of radio emission. The complete sample consists of about 560 sources with S0.95 Jy in the declination range and above a galactic latitude of 20∘. From this complete sample we compiled a list of 15 quasars and a representative sample of 27 radio galaxies, which have similar size, redshift and luminosity distributions, to study the effects of orientation and environment in this class of objects. Sources were restricted to those with a somewhat large angular size (), so that it would also be possible to make further measurements at lower frequencies (610 and 327 MHz) with the Giant Metrewave Radio Telescope, with a reasonable number of beamwidths along the source axes. Some of the angular sizes listed in Ishwara-Chandra et al. (1998, hereinafter referred to as IC98), are incorrect, although this has not affected the results presented in the paper. The sample of 42 sources along with the corrected sizes is listed in Appendix 1.
| Array | Obs. | Obs. | Band- | Date of obs. |
|---|---|---|---|---|
| Conf. | band | Freq. | width | |
| MHz | MHz | |||
| BnA | L | 1365 | 50 | 1995 Sep 20 |
| L | 1665 | 25 | ||
| CnB | C | 4635 | 50 | 1996 Jan 20,31 |
| C | 4935 | 50 | ||
| DnC | U | 14965 | 50 | 1997 Sep 15, 16 |
| DnC | U | 14965 | 50 | 1997 Oct 3, 4, 12 |
| BnA | X | 8447 | 25 | 1997 Feb 3 |
Some of the results from our study have been presented earlier. The polarization observations of the lobes at L- and C-bands and the effects of the environment and orientation on the observed depolarization characteristics of the lobes have been presented in IC98. These observations show that the nearer lobe tends to be more depolarized and is also brighter, suggesting that these objects are evolving in an asymmetric environment. In addition, the effects of orientation are also marginally seen with the quasars exhibiting a higher degree of depolarization asymmetry compared to the radio galaxies. Radio observations of two new giant quasars found in our sample, along with a study of the evolution of giant radio sources have been presented by Ishwara-Chandra & Saikia (1999). We have also determined the spectra of the cores and hotspots and demonstrated that they show the effects of relativistic motion, consistent with the unified scheme. We have used the measurements to estimate the velocity of advance of the hotspots (Ishwara-Chandra & Saikia 2000). In this paper, we describe the results of the radio and optical observations (Sections 2 and 3), and present a few typical images of the radio galaxies and quasars at the X- and U-bands. We examine the Liu-Pooley effect (Liu & Pooley 1991) and discuss the brightness asymmetries of the hotspots (Section 3). We present the estimates of ages and velocities in our sample using the matched resolution observations at the L- and C-bands (Section 4). In Section 5, the optical narrow- and broad-band observations and their results are presented. The conclusions are summarized in Section 6. We have defined the spectral index as .
2 Observations and analyses
2.1 Radio observations
The observations were made with scaled arrays of the VLA at 1.4 and 1.7 GHz (L-band), 5 GHz (C-band) and 15 GHz (U-band) with resolutions of 5′′, while observations at 8 GHz (X-band) have a resolution of 1′′. At 15 GHz, 14 quasars and 10 radio galaxies were observed, while at 8 GHz only those sources in the RA range 03h to 13h were observed due to scheduling constraints. The observing log is summarized in Table 1. All the data were calibrated and analyzed using the National Radio Astronomy Observatory (NRAO) AIPS package. The images at X band and U band were corrected for primary beam attenuation. The U-band images have been restored with the same resolutions as the L- and C-band images, which are listed in Table 2.3 of IC98. However, no polarization information is available for sources observed in the X- and U-band.


| Source | Id | z | filter | t | Date of |
|---|---|---|---|---|---|
| Name | /band | min | Observation | ||
| 0346297 | G | 0.416 | 7052 | 70 | 1997 Mar 7,8 |
| 13 | 1997 Mar 8 | ||||
| 0428281 | G | 0.65 | 6147 | 75 | 1997 Mar 7 |
| 10 | 1997 Mar 7 | ||||
| 1023226 | G | 0.586 | 7935 | 140 | 1997 Mar 5 |
| 26 | 1997 Mar 5 | ||||
| 1052272 | Q | 1.103 | 60 | 1997 Mar 8 | |
| 40 | 1997 Mar 8 | ||||
| 1126290 | G | 0.41 | 20 | 1997 Mar 7 | |
| 25 | 1997 Mar 7 | ||||
| 1226297 | Q | 0.749 | 6520 | 57 | 1997 Mar 5 |
| 20 | 1997 Mar 5 | ||||
| 5 | 1997 Mar 5 | ||||
| 1232249 | Q | 0.352 | 6781 | 131 | 1997 Mar 8 |
| 20 | 1997 Mar 8 | ||||
| 5 | 1997 Mar 8 | ||||
| 1247290 | Q | 0.77 | 20 | 1997 Mar 6 | |
| 40 | 1997 Mar 6 | ||||
| 1257230 | Q | 1.109 | 40 | 1997 Mar 7 | |
| 30 | 1997 Mar 7 | ||||
| 1358214 | G | 0.5 | 7531 | 80 | 1997 Mar 4 |
| 42 | 1997 Mar 5 | ||||
| 42 | 1997 Mar 5 |
2.2 Optical observations
Optical narrow-band imaging at the redshifted O[II] or O[III] lines with appropriate filters and broad-band imaging using , and V filters were done for a subset of sources from the original sample. For broad-band imaging the filter of the Thuan & Gunn (1976) system, the filter of Wade et al. (1979) system and the filter of the Johnson (1963) system were used. For narrow-band observations, filters centered at 6147, 6520, 6781, 7052, 7531 and 7935 Å with widths of about 70 to 80 Å, courtesy of the Lick Observatories, were used. The observations were carried out with the 2.5m Du Pont Telescope at Las Campanas Observatory (LCO), Chile. A 2048 2048, thinned and UV flooded, Textronix CCD with 24 m 24 m sized pixels was used. The 2048 2048 image was rebinned to derive 1024 1024 images. Astrometry was performed using the Digitized Sky Survey (DSS) images which have a pixel size of about 1.′′7. Using these DSS images a pixel scale of about 0.′′52 pixel-1 was derived for our final images. This corresponds to total field size of 532 532 arcsec2 per CCD frame. We have checked our identifications with the finding charts given in McCarthy et al. (1996) and Kapahi et al. (1998a) for radio galaxies and quasars respectively. For CCD image pre-processing, the bias correction was done using the 16 column overscan region of the individual CCD frames. Flat-fielding was done for each filter using master dome flats, which were obtained by averaging corresponding individual dome flats. Multiple frames of individual sources were properly aligned and summed to produce the final image. Absolute photometry was not performed on our images as we are interested only in the morphology of the source and in the distribution of the emission-line gas around the source. Instead, each final image was normalised with respect to its mean value near the source. The normalised broad-band continuum images were used to subtract from the normalised narrow-band images to produce the continuum subtracted narrow-band images, except in one source (1023226) where the narrow- and broad-band filters did not overlap. The data were analysed using the IRAF package provided by National Optical Astronomy Observatory (NOAO).
The properties of the sources and the observing log are presented in Table 2, which is arranged as follows. Columns 1, 2 and 3: source name, its optical identification (G for galaxy and Q for quasar) and redshift; column 4: filters used in the observations; column 5: integration time in minutes and column 6: date of observation.
3 Results from the radio observations
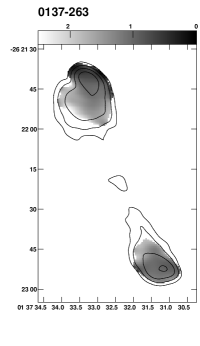
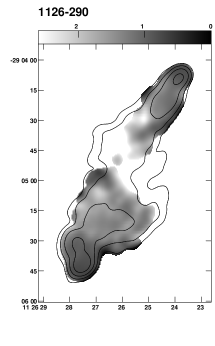
We present the X- and U-band images for a few sources in Figure 1. The images of all the sources are presented in Ishwara-Chandra 1999. We summarise the restoring beam and the rms noise in each of the images, and the total and peak flux densities of the lobes on opposite sides of the nucleus in Table 3 for X-band images and in Table 4 for U-band images. The sources which have been used in the discussion of Section 3.2 have been marked with an asterisk. The core flux densities estimated from these images have been listed by Ishwara-Chandra & Saikia (2000).
| Source | maj | min | PA | Cp | Pk. | Tot | |
| 0325260 | 2.38 | 0.70 | 37 | 43 | N | 8.8 | 16.0 |
| S | 0.6 | 6.4 | |||||
| 0346297 | 2.33 | 0.65 | 35 | 95 | N | ||
| S | 1.8 | 21.2 | |||||
| 0428281∗ | 1.90 | 0.66 | 31 | 84 | E | 15.0 | 39.9 |
| W | 24.8 | 64.0 | |||||
| 0437244 | 1.89 | 0.58 | 35 | 85 | N | 2.2 | 19.6 |
| S | 5.7 | 19.1 | |||||
| 0454220∗ | 1.88 | 0.57 | 36 | 311 | N | 5.2 | 93.0 |
| S | 11.2 | 107.0 | |||||
| 0551226 | 1.76 | 0.56 | 33 | 82 | N | 0.5 | 2.4 |
| S | 0.24 | 1.7 | |||||
| 0937250 | 1.20 | 0.72 | 21 | 79 | N | 2.0 | 7.1 |
| S | 1.0 | 15.6 | |||||
| 0938205 | 1.22 | 0.69 | 28 | 78 | N | 0.3 | 6.1 |
| S | 0.8 | 13.7 | |||||
| 0947247∗ | 1.19 | 0.73 | 19 | 138 | N | 30.3 | 78.6 |
| S | 12.7 | 27.8 | |||||
| 0955283 | 1.46 | 0.72 | 9 | 86 | E | 0.8 | 10.1 |
| W | 12.2 | 41.4 | |||||
| 1022250 | 1.24 | 0.74 | 7 | 79 | N | 0.8 | 6.3 |
| S | 0.5 | 5.9 | |||||
| 1023226 | 1.30 | 0.68 | 31 | 83 | N | 2.4 | 14.6 |
| S | 0.8 | 4.6 | |||||
| 1025229 | 0.80 | 0.61 | 53 | 73 | N | 3.1 | 16.1 |
| S | 0.9 | 2.6 | |||||
| 1026202 | 0.85 | 0.72 | 9 | 101 | N | 1.4 | 57.8 |
| S | 4.1 | 71.9 | |||||
| 1029233∗ | 1.22 | 0.72 | 17 | 79 | E | 15.1 | 43.7 |
| W | 1.7 | 11.3 | |||||
| 1052272∗ | 1.12 | 0.71 | 4 | 80 | N | 1.8 | 33.8 |
| S | 1.8 | 31.0 | |||||
| 1107218∗ | 1.23 | 0.69 | 26 | 86 | E | 17.0 | 23.1 |
| W | 9.4 | 11.7 | |||||
| 1107227∗ | 1.22 | 0.75 | 7 | 86 | N | 17.7 | 32.5 |
| S | 8.3 | 14.6 | |||||
| 1126290∗ | 1.55 | 0.75 | 16 | 90 | N | 5.1 | 17.4 |
| S | 14.1 | 51.8 | |||||
| 1224208 | 1.31 | 0.67 | 32 | 53 | N | 0.7 | 10.8 |
| S | 2.0 | 6.9 | |||||
| 1226297 | 1.41 | 0.71 | 6 | 100 | N | 1.3 | 2.3 |
| S | 46.3 | 79.3 | |||||
| 1232249∗ | 1.21 | 0.7 | 1 | 298 | N | 33.3 | 204.9 |
| S | 52.4 | 179.2 | |||||
| 1247290∗ | 1.17 | 0.7 | 6 | 117 | N | 3.5 | 51.4 |
| S | 12.0 | 33.6 | |||||
| 1257230∗ | 1.16 | 0.73 | 3 | 113 | N | 2.7 | 22.0 |
| S | 45.7 | 91.3 | |||||
| 1358214 | 1.34 | 0.73 | 25 | 89 | N | 2.6 | 15.1 |
| S | 2.4 | 15.9 |
| Source | maj | min | PA | Cp | Pk. | Tot | |
| 0017207∗ | 4.5 | 3.5 | +70 | 162 | N | 14.0 | 22.0 |
| S | 10.6 | 21.2 | |||||
| 0058229∗ | 4.2 | 3.5 | +80 | 134 | N | 5.3 | 17.1 |
| S | 4.6 | 16.8 | |||||
| 0148297∗ | 4.5 | 3.5 | +60 | 223 | N | 31.2 | 106.5 |
| S | 32.4 | 148.4 | |||||
| 0428281∗ | 6.0 | 3.5 | 70 | 202 | E | 16.7 | 27.3 |
| W | 26.1 | 36.7 | |||||
| 0437244∗ | 9.0 | 5.0 | 25 | 183 | N | 6.9 | 10.8 |
| S | 3.8 | 6.0 | |||||
| 0454220∗ | 6.0 | 3.0 | 70 | 439 | N | 19.3 | 50.9 |
| S | 32.0 | 63.5 | |||||
| 0947247∗ | 8.0 | 4.0 | 50 | 327 | N | 41.6 | 57.3 |
| S | 20.2 | 28.6 | |||||
| 1025229 | 8.0 | 4.5 | 50 | 272 | N | 3.9 | 4.8 |
| S | 4.0 | 15.3 | |||||
| 1026202∗ | 8.0 | 4.2 | 50 | 214 | N | 6.9 | 20.4 |
| S | 17.4 | 40.3 | |||||
| 1052272∗ | 6.0 | 5.0 | 50 | 229 | N | 9.0 | 13.8 |
| S | 7.9 | 19.8 | |||||
| 1107227∗ | 6.5 | 4.5 | 50 | 200 | N | 11.3 | 16.2 |
| S | 4.8 | 7.2 | |||||
| 1126290∗ | 6.0 | 5.0 | 50 | 230 | N | 7.4 | 26.9 |
| S | 17.4 | 67.6 | |||||
| 1226297 | 7.0 | 4.5 | 50 | 198 | N | 1.2 | 1.4 |
| S | 40.6 | 47.2 | |||||
| 1232249∗ | 7.0 | 4.5 | 50 | 335 | N | 50.1 | 112.9 |
| S | 77.3 | 135.1 | |||||
| 1247290∗ | 7.0 | 5.5 | 50 | 288 | N | 14.5 | 28.0 |
| S | 9.0 | 17.1 | |||||
| 1257230∗ | 7.0 | 4.5 | 50 | 282 | N | 8.8 | 11.2 |
| S | 57.5 | 70.1 | |||||
| 2035203 | 7.0 | 3.0 | +50 | 279 | E | 71.2 | 83.0 |
| W | 1.4 | 7.3 | |||||
| 2040236 | 6.4 | 3.0 | +50 | 274 | E | 10.7 | 21.9 |
| W | 1.0 | 2.3 | |||||
| 2045245∗ | 7.5 | 3.0 | +50 | 167 | N | 12.9 | 22.1 |
| S | 5.7 | 20.2 | |||||
| 2118266 | 7.5 | 3.0 | +50 | 242 | E | 9.5 | 19.4 |
| W | 0.7 | 1.6 | |||||
| 2213283∗ | 6.5 | 3.0 | +50 | 213 | E | 9.1 | 33.0 |
| W | 8.3 | 14.1 | |||||
| 2311222∗ | 5.0 | 3.0 | +60 | 237 | E | 68.9 | 85.2 |
| W | 8.4 | 13.7 | |||||
| 2325213∗ | 5.0 | 3.0 | +60 | 202 | N | 8.8 | 21.6 |
| S | 13.2 | 34.6 | |||||
| 2338290 | 5.0 | 3.5 | +60 | 290 | N | 6.7 | 12.1 |
| S | 1.5 | 5.3 |
3.1 The Liu-Pooley effect

We have investigated the trend for the lobe with the flatter spectral index to be less depolarized, also known as the Liu-Pooley effect for our sample of sources, along with those from Liu & Pooley (1991), Garrington et al. (1991) and Pedelty et al. (1991). The sources in these samples have all been observed with the VLA between 20 and 6 cm and the authors have tabulated the DP or depolarization values and spectral indices for the individual lobes. DP is defined as /, where is the degree of polarization at the two wavelengths. The results from the different samples are summarized in Table 5, which is arranged as follows. Column 1: the different samples where LP91 denotes Liu & Pooley, G91-S and G91-L denote the samples of small and large sources from Garrington et al. (1991), P91 the sources from Pedelty et al. (1991) and MRC the present sample; column 2: the total number of galaxies and quasars in each of these samples; column 3: the number of galaxies and quasars which show the Liu-Pooley effect. The typical error in the difference in DP and spectral index is about 0.1. The first number indicates the number of sources where the differences in DP and spectral index are larger than 0.1, while the number in brackets indicates the total number of sources consistent with the the Liu-Pooley relation. Column 4: the median values of , the difference in spectral indices between the lobes, for the galaxies and quasars; columns 5 to 8: the corresponding median values of DP defined to be the difference in depolarization between the two lobes, projected linear size in kpc, redshift and the fraction of emission from the core at an emitted frequency of 8 GHz.
We first consider the samples consisting of small sources, namely from the LP91 and G91-S samples (Figure 2, upper panel) where the median linear sizes are about 85 and 88 kpc respectively. Among the sources whose values of DP and are 0.1, all the 4 galaxies and the 20 quasars are consistent with the Liu-Pooley effect. If we consider all the sources, about 91 per cent of the galaxies and 85 per cent of the quasars are consistent with the Liu-Pooley effect. In the samples consisting of larger sources (Figure 2, lower panel), namely the G91-L, P91 and the IC98 samples, where the median linear sizes are about 347, 350 and 595 kpc respectively, we find that the effect is weaker, the difference in DP also being smaller (see Figure 3). Among those whose values of DP and are 0.1, 6 of the 8 galaxies (75 per cent) and 7 of the 10 quasars show the Liu-Pooley effect. The corresponding values for the entire data are 58 and 59 per cent for the galaxies and quasars respectively.
Ideally, since the DP values depend on wavelength, and the objects are at different redshifts one should estimate the DP values at fixed wavelengths in the emitted frame. However, the curves for the individual lobes are usually not known. We have therefore examined the trends for objects in a narrower range of redshift, namely 0.4 to 1, and find the results to be similar to that of the entire sample where the redshift ranges from 0.06 to 2.3.


| Samp | Number | LP | DP1 - DP2 | Linear size | redshift | fc | ||||||||
|---|---|---|---|---|---|---|---|---|---|---|---|---|---|---|
| G | Q | G | Q | G | Q | G | Q | G | Q | G | Q | G | Q | |
| (1) | (2) | (3) | (4) | (5) | (6) | (7) | (8) | |||||||
| LP91 | 9 | 4 | 3(8) | 4(4) | 0.16 | 0.25 | 0.22 | 0.52 | 85 | 94 | 0.9 | 1.05 | 0.00339 | 0.0978 |
| G91S | 2 | 23 | 1(2) | 16(19) | 0.15 | 0.20 | 0.24 | 0.59 | 148 | 87 | 0.8 | 1.618 | 0.0034 | 0.1198 |
| G91L | 5 | 17 | 0(2) | 4(7) | 0.03 | 0.09 | 0.33 | 0.14 | 264 | 373 | 0.689 | 0.743 | 0.0032 | 0.2309 |
| P91 | 10 | 2(6) | 0.07 | 0.22 | 330 | 1.026 | 0.0019 | |||||||
| MRC | 23 | 12 | 4(14) | 2(6) | 0.06 | 0.12 | 0.25 | 0.38 | 595 | 583 | 0.73 | 0.738 | 0.0012 | 0.073 |
Considering all the sources which are 300 kpc, we have examined whether the Liu-Pooley effect depends on the redshift of the objects. 19 of the 26 objects with redshift 1.15, the median value for these sources, show the effect compared to 19 of the 25 with larger redshifts. Confining ourselves to only those whose values of DP and are 0.1 shows that 10 of 11 objects with redshift 1.15, and 15 of 16 objects with larger redshifts show the effect. There appears to be no dependence on redshift.
A possible interpretation of the Liu-Pooley effect has been in terms of relativistic motion of the hotspots, so that the one which is on the approaching side is less depolarized and also has a flatter spectral index. One might be tempted to infer that the tendency for the Liu-Pooley effect to be stronger for the smaller sources is consistent with this interpretation since the small sources might be expected to be inclined at smaller angles to the line of sight. However, we note that considering the samples consisting largely of smaller and larger sources separately, there is no significant difference in the number of objects which show the Liu-Pooley effect between galaxies and quasars. We have also examined whether the Liu-Pooley effect depends on the fraction of emission from the core, which is being used as a statistical measure of the orientation of the source axes to the line of sight, but find no significant dependence on it.
The lack of a difference in the strength of the correlation between galaxies and quasars suggests that Doppler effects may not be the only factor. It is relevant to note from Table 5, that the absolute values of DP and do tend to be larger for quasars compared to galaxies of similar size and redshift, suggesting that Doppler effects do play a role in the location of points in the Liu-Pooley diagram. The tendency for the jet side lobe to be flatter as well as less depolarized suggests that Doppler effects could provide a viable explanation of the Liu-Pooley relation for quasars. At present, it seems necessary to postulate intrinsic differences in the oppositely-directed lobes of radio galaxies which affect their spectra as well as depolarization properties.


3.2 Brightness and arm-length asymmetry
From VLA observations at L- and C-bands with an angular resolution of about 5 arcsec, IC98 reported a trend for the nearer component to be brighter and more depolarized. This is consistent with the idea that these sources are evolving in an asymmetric environment leading to a higher luminosity for the nearer lobe which is possibly traversing through the denser medium. In Figure 4 we show the relationship for the sources observed in the U-band with an angular resolution of about 5 arcsec, and for the sources observed in the X-band with a higher resolution of about 1 arcsec. To minimise the errors, we have considered only the strong hotspots in both bands with a peak flux density greater than about 10 times the lowest contour level (sources marked with an asterisk in the Table 3 and 4). The minimum values of the hotspot flux density in the U- and X-bands are approximately 5 and 1.5 mJy respectively. The flux-density ratio - armlength ratio diagram for the U-band sources shows a similar relationship reported earlier (Fig 6 of IC98), although the number of sources is now much smaller. The trend is stronger for galaxies than the quasars, where the effects of relativistic beaming is more significant. The brighter component is nearer in all the 9 galaxies and 6 of the 9 quasars. We have checked these trends at a fixed frequency in the emitted frame using the estimates of the hotspot spectral indices from our L- and C-band observations, and find that the results are almost identical.
However, in the higher-resolution X-band observations, one of the five quasars and five of the six radio galaxies have the brighter component closer to the nucleus. At higher resolutions, where the emission is dominated by the hotspots, the effects of mild relativistic motion of the hotspots appear to be more noticeable in quasars. Two quasars move significantly along the y-axis, and are shown in the Figure 4. The numbers are small and need to be investigated more carefully using larger samples.
3.3 Spectral ageing
The spectral age, which is estimated from the change in the spectral index due to radiative and other losses, is the time elapsed since the electrons were last accelerated. The electrons are believed to be accelerated at the hotspot and ‘age’ as they diffuse outwards. These electrons form the backflow from the hotspot towards the nucleus leading to the formation of lobes and bridges of radio emission. From a steepening of the radio spectrum due to radiative losses along this backflow, it is possible, in principle, to estimate the spectral age. However, there are several caveats in interpreting these spectral ages as the dynamical ages of these sources (cf. Blundell & Rawlings 2000, and references therein). Nevertheless, we have estimated the spectral ages and the relative velocity of advance of the hotspots, usually in a region which is within a few beamwidths of the peak of emission in the hotspots. We derive the spectral ages for our sample of sources using the formalism of Myers & Spangler (1985), assuming initialy that the change in spectra are only due to synchrotron losses. The spectral index maps and corresponding spectral index slices for two representative sources are presented in Figure 5, demonstrating the range in the spectral index gradients.
| Source | z | Beq | Age | Vel | Age∗ | Vel∗ |
|---|---|---|---|---|---|---|
| Name | nT | Myr | 0.1c | Myr | 0.1c | |
| 0017207 N | 0.545 | 0.762 | 14.0 | 0.18 | 7.0 | 0.36 |
| 0017207 S | 0.545 | 0.709 | 47.5 | 0.07 | 22.0 | 0.15 |
| 0058229 N | 0.706 | 0.718 | 32.5 | 0.14 | 12.1 | 0.36 |
| 0058229 S | 0.706 | 0.633 | 50.0 | 0.20 | 15.8 | 0.64 |
| 0133266 N | 1.530 | 1.326 | 10.5 | 0.36 | 3.1 | 1.22 |
| 0133266 S | 1.530 | 1.254 | 9.5 | 0.54 | 2.6 | 1.99 |
| 0137263 N | 1.100 | 1.106 | 24.0 | 0.35 | 9.1 | 0.91 |
| 0137263 S | 1.100 | 0.977 | 20.0 | 0.27 | 6.5 | 0.84 |
| 0148297 N | 0.410 | 0.738 | 34.5 | 0.17 | 19.8 | 0.30 |
| 0148297 S | 0.410 | 0.734 | 22.5 | 0.38 | 12.9 | 0.67 |
| 0325260 N | 0.638 | 0.708 | 22.0 | 0.35 | 8.9 | 0.85 |
| 0325260 S | 0.638 | 0.644 | 28.5 | 0.29 | 10.3 | 0.81 |
| 0346297 S | 0.413 | 0.682 | 38.0 | 0.25 | 20.2 | 0.48 |
| 0428281 E | 0.650 | 1.062 | 22.5 | 0.27 | 13.5 | 0.46 |
| 0428281 W | 0.650 | 1.174 | 22.5 | 0.42 | 14.5 | 0.65 |
| 0437244 N | 0.840 | 0.737 | 31.5 | 0.20 | 10.0 | 0.65 |
| 0437244 S | 0.840 | 0.608 | 14.3 | 0.17 | 3.4 | 0.72 |
| 0454220 S | 0.533 | 1.269 | 18.5 | 0.35 | 13.7 | 0.47 |
| 0551226 N | 0.800 | 0.709 | 45.0 | 0.19 | 14.3 | 0.59 |
| 0551226 S | 0.800 | 0.730 | 20.0 | 0.29 | 6.6 | 0.89 |
| 0937250 N | 0.900 | 0.812 | 39.5 | 0.36 | 13.1 | 1.09 |
| 0937250 S | 0.900 | 0.932 | 22.0 | 0.40 | 8.7 | 1.02 |
| 0938205 N | 0.371 | 0.441 | 66.0 | 0.17 | 23.1 | 0.49 |
| 0938205 S | 0.371 | 0.462 | 75.5 | 0.15 | 28.0 | 0.39 |
| 0947249 N | 0.854 | 1.147 | 40.0 | 0.30 | 20.8 | 0.58 |
| 0947249 S | 0.854 | 0.841 | 39.0 | 0.15 | 14.4 | 0.41 |
| 0955283 E | 0.800 | 0.696 | 47.5 | 0.23 | 14.7 | 0.75 |
| 0955283 W | 0.800 | 0.856 | 39.5 | 0.29 | 16.0 | 0.72 |
| 1022250 E | 0.340 | 0.605 | 58.5 | 0.15 | 30.8 | 0.29 |
| 1022250 W | 0.340 | 0.661 | 47.0 | 0.13 | 26.8 | 0.22 |
| 1023226 N | 0.586 | 0.744 | 52.5 | 0.17 | 24.2 | 0.37 |
| 1023226 S | 0.586 | 0.552 | 61.5 | 0.12 | 19.7 | 0.38 |
| 1025229 N | 0.309 | 0.313 | 80.5 | 0.09 | 19.8 | 0.38 |
| 1025229 S | 0.309 | 0.296 | 134.0 | 0.05 | 30.2 | 0.20 |
| 1026202 N | 0.566 | 0.632 | 54.5 | 0.16 | 21.4 | 0.41 |
| 1026202 S | 0.566 | 0.735 | 35.0 | 0.21 | 16.3 | 0.45 |
| 1029233 E | 0.611 | 0.866 | 49.0 | 0.19 | 25.5 | 0.36 |
| 1029233 W | 0.611 | 0.693 | 33.5 | 0.16 | 13.7 | 0.38 |
| 1052272 N | 1.103 | 1.173 | 19.5 | 0.30 | 7.9 | 0.75 |
| 1052272 S | 1.103 | 0.996 | 20.5 | 0.39 | 6.8 | 1.16 |
| Source | z | Beq | Age | Vel | Age∗ | Vel∗ |
|---|---|---|---|---|---|---|
| Name | nT | Myr | 0.1c | Myr | 0.1c | |
| 1107218 E | 1.500 | 1.278 | 14.5 | 0.49 | 4.2 | 1.67 |
| 1107218 W | 1.500 | 1.542 | 22.5 | 0.42 | 8.4 | 1.12 |
| 1107227 N | 2.000 | 2.371 | 8.5 | 1.04 | 3.4 | 2.58 |
| 1107227 S | 2.000 | 2.139 | 8.5 | 0.96 | 3.0 | 2.71 |
| 1126290 N | 0.410 | 0.562 | 59.0 | 0.13 | 25.8 | 0.30 |
| 1126290 S | 0.410 | 0.514 | 94.0 | 0.12 | 37.2 | 0.30 |
| 1224208 N | 1.500 | 1.188 | 18.5 | 0.52 | 4.8 | 2.01 |
| 1224208 S | 1.500 | 0.965 | 16.5 | 0.49 | 3.1 | 2.59 |
| 1226297 N | 0.749 | 0.615 | 36.5 | 0.05 | 10.3 | 0.17 |
| 1226297 S | 0.749 | 1.221 | 15.5 | 0.41 | 9.4 | 0.67 |
| 1232249 N | 0.352 | 1.024 | 34.0 | 0.20 | 25.6 | 0.26 |
| 1232249 S | 0.352 | 0.820 | 35.0 | 0.18 | 23.2 | 0.27 |
| 1247290 N | 0.770 | 0.991 | 26.0 | 0.25 | 12.8 | 0.50 |
| 1247290 S | 0.770 | 0.841 | 36.5 | 0.34 | 15.1 | 0.82 |
| 1257230 N | 1.109 | 1.756 | 2.5 | 2.93 | 1.5 | 4.85 |
| 1257230 S | 1.109 | 1.842 | 8.0 | 1.27 | 5.0 | 2.03 |
| 2035203 E | 0.516 | 0.832 | 22.0 | 0.22 | 12.3 | 0.39 |
| 2035203 W | 0.516 | 0.701 | 25.5 | 0.15 | 12.1 | 0.31 |
| 2040236 E | 0.704 | 1.270 | 15.0 | 0.31 | 9.8 | 0.48 |
| 2040236 W | 0.704 | 0.642 | 31.0 | 0.19 | 10.0 | 0.58 |
| 2042293 N | 1.900 | 1.237 | 16.5 | 0.68 | 2.9 | 3.91 |
| 2042293 S | 1.900 | 1.055 | 16.0 | 0.41 | 2.1 | 3.06 |
| 2045245 N | 0.730 | 0.857 | 44.5 | 0.14 | 19.8 | 0.33 |
| 2045245 S | 0.730 | 0.759 | 30.0 | 0.20 | 11.6 | 0.51 |
| 2118266 E | 0.343 | 0.483 | 60.0 | 0.10 | 24.7 | 0.25 |
| 2118266 W | 0.343 | 0.409 | 66.5 | 0.06 | 22.2 | 0.17 |
| 2132235 N | 0.810 | 0.727 | 37.0 | 0.28 | 12.0 | 0.85 |
| 2132235 S | 0.810 | 0.864 | 25.0 | 0.20 | 10.1 | 0.50 |
| 2137279 N | 0.640 | 0.875 | 27.0 | 0.44 | 13.7 | 0.87 |
| 2137279 S | 0.640 | 0.814 | 19.5 | 0.17 | 9.2 | 0.36 |
| 2213283 E | 0.946 | 1.040 | 14.0 | 0.39 | 5.9 | 0.93 |
| 2213283 W | 0.946 | 1.252 | 16.5 | 0.29 | 8.5 | 0.56 |
| 2311211 E | 0.434 | 1.159 | 14.5 | 0.45 | 11.0 | 0.60 |
| 2311211 W | 0.434 | 0.751 | 32.0 | 0.15 | 18.1 | 0.26 |
| 2325213 N | 0.580 | 1.024 | 12.5 | 0.69 | 7.8 | 1.11 |
| 2325213 S | 0.580 | 1.086 | 13.0 | 0.45 | 8.4 | 0.69 |
| 2338290 N | 0.446 | 0.529 | 35.5 | 0.08 | 13.6 | 0.20 |
| 2338290 S | 0.446 | 0.479 | 41.0 | 0.23 | 13.9 | 0.68 |
| 2348235 N | 0.952 | 1.042 | 13.0 | 0.31 | 5.5 | 0.72 |
| 2348235 S | 0.952 | 1.116 | 14.0 | 0.59 | 6.4 | 1.29 |
Following Myers & Spangler (1985), a quantity X∘ is defined as
which is an indicator of the synchrotron age of the source. The constants are defined in Pacholczyk (1970), is the magnetic field strength, is the radio frequency and is the time since the electrons were accelerated. From the above expression, the age is given by
Here is the time in millions of years, is the magnetic field strength in units of 10-5 G, is the observing frequency in GHz and , the redshift of the source. The quantity X∘ can be obtained by assuming that the electron spectrum evolves due to synchrotron radiation losses over a time .

The spectral ages and the speeds of separations were calculated using the magnetic field Beq estimated from the minimum energy arguments from the L- and C-band observations. The 15 GHz observations were not used in the estimates of spectral ages because of the lack of detection of the lobe emission at this frequency. The age estimates were not done for northern lobe of 0346297 because of poor signal to noise ratio, for northern lobe of 0454220 because the spectral index variations were within the measurement errors and for the radio galaxy 1358214 which does not have the C-band data. The distribution of the spectral ages is presented in Figure 6. The spectral ages, equipartition magnetic field strengths, and the velocity estimates are presented in Table 6, which is arranged as follows. Columns 1 & 2: Source name and its redshift; column 3: the equipartition magnetic field in nT, columns 4 & 5: age in 106 yr and speed of separation in units of 0.1c, Column 6 & 7: same as Columns 4 & 5, but after taking into account the radiation losses due to inverse-Compton scattering with the microwave background radiation. The synchrotron ages range from 2.5 years to 1.34 years with a median value of about 2.8 years, and the speed of separation is in the range 0.0046c to 0.29c with a median value of 0.025c. If we take account of the energy losses due to inverse-Compton scattering with the microwave background radiation, the ages are in the range of 1.5 years to 3.7 years with a median value of about 1.2 years while, the speed of separation is in the range 0.015c to 0.48c with a median value of 0.058c.
4 Results from the optical observations
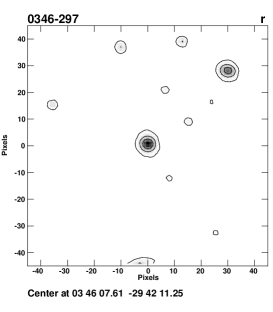
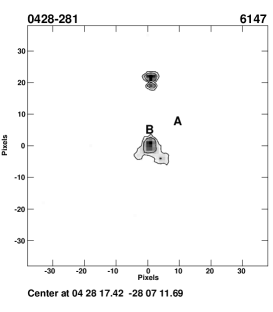
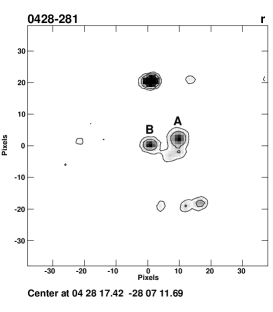
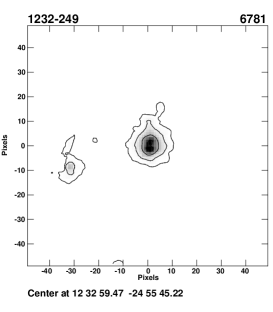
The narrow- and broad-band images of the radio galaxies and quasars are presented in Figure 7 for the objects with significant extension of emission-line gas and evidence of galaxies in the broad-band images for signs of possible interaction with the radio source. The optical images for all the sources are presented in Ishwara-Chandra (1999.) We now compare the distribution of emission-line gas and galaxies along the radio source axis and correlate these with the symmetry parameters of the radio source. Four galaxies and two quasars have narrow-band observation, and significant extension of emission-line gas is seen in one quasar (1232249) and possibly in one galaxy (0428281). In the case of this weak-cored quasar, the emission-line gas is extended within about 20∘ of the radio source axis, consistent with the alignment effect noted in high-redshift radio galaxies (Chambers et al. 1987; McCarthy et al. 1987). In the case of the radio galaxy 0428281, the extension is possibly due to the companion object. The radio lobe of 1232249 lie well outside the emission-line gas extension, and do not show any significant depolarization between 1.4 and 5 GHz (IC98).
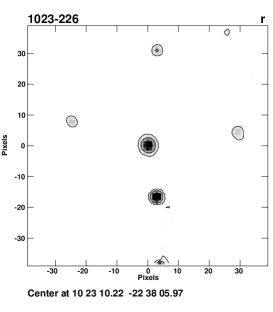
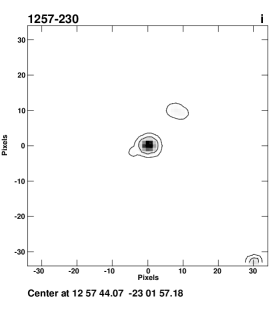
We have also looked for evidence of galaxies in the broad-band images for signs of possible interaction with the radio source. In the broad-band images, three galaxies (0346297, 0428281, 1023226) and possibly in one quasar (1257230), a galaxy is seen close to the radio axis. The arm-length ratios for 0428281 and 1023226 are consistent with slowing down of the jet by possible interaction with the galaxy. In the radio galaxy 3C34 where Best, Longair & Röttgering (1997) have presented evidence of jet-cloud interaction at a distance of 120 kpc from the nucleus of the parent optical galaxy, the primary hotspot on the side of the interaction is closer to the nucleus than the one on the opposite side. This is consistent with the these two sources. However, in the case of 0346297, where an optical galaxy is seen towards the north-west lobe of the radio source, the radio lobe on this side is weaker and longer compared to the lobe on the opposite side. For the quasar 1257230, a faint galaxy-like object is seen towards the northern lobe, within 10∘ of the radio source axis. This radio lobe is shorter, but weaker compared to the lobe on the opposite side. We comment below briefly on the above objects.
Notes on individual sources
0346297: This galaxy has a very asymmetric radio morphology. Almost the entire radio flux density of the source is due to south-eastern lobe. There is no evidence of extended emission-line gas. In the broad-band image a galaxy is seen about 135 kpc from the radio galaxy towards the north-west within about 10∘ of the radio source axis. The radio lobe on this side is weaker and farther away ( 1.5) from the host galaxy compared to the lobe on the opposite side.
0428281: There appears to be weak extension of the emission-line gas distribution. An optical galaxy (B) is seen physically connected to the galaxy (A) identified by McCarthy et al. (1996) . However, in the continuum subtracted emission-line image, the galaxy A disappears completely and the galaxy B appears bright. The astrometric position of galaxy B is RA 04h 28m 17.44s and DEC 07′ 11.′′9 (B1950), while that of galaxy A is RA 04h 28m 17.09s and DEC 07′ 10.′′9 (B1950). The position of the possible radio core seen in the 8 GHz image is RA = 04h 28m 17.33s and DEC 07′ 11.′′20 (B1950), which is within about 1.′′5 of the position of B. If the radio core is confirmed, this is likely to be the correct identification. The galaxy A lies about 40 kpc west of B within 10∘ of the radio source axis. Extended emission is seen in the narrow band image after subtracting the continuum emission of the galaxy A.
1023226: In the broad-band image a faint optical galaxy is seen within about 20∘ of the radio axis, at a distance of about 110 kpc towards north-west. The arm-length ratio of the lobe on this direction is 0.75 and the brightness ratio is 1.8.
1232249: The emission-line gas in this quasar is elongated towards the north, within about 20∘ of the radio source axis. This lobe is farther from the nucleus than the opposite lobe. Both the lobes do not show depolarization between 1.4 and 5GHz. Lower radio frequency polarization observations along with deeper emission-line imaging will be useful in understanding the relationship between the emission-line gas distribution and possible depolarization.
1257230: This quasar also has only broad-band observations which shows a faint galaxy within about 10∘ of the northern radio lobe. The radio lobe on this side is shorter and fainter.
5 Concluding remarks
We have presented the results of our radio observations at the X and U bands, and the optical narrow- and broad-band images. We summarise the main conclusions in this section.
-
1.
Considering the objects where the difference between the spectral indices and depolarization values of the lobes on opposite sides is larger than the errors, the Liu-Pooley relation appears stronger for sources of smaller linear size, with no signficant dependence on the redshift of the objects. This relationship which shows that the lobe with the flatter spectral index is less depolarized is similar for both radio galaxies and quasars, suggesting that in addition to orientation effects intrinsic differences also play a role.
-
2.
In the brightess ratio - armlength ratio diagram derived from our observations with an angular resolution of about 5 arcsec, there is a significant trend for the nearer component to be brighter, especially for galaxies. This component also tends to be more depolarized (cf. IC98), suggesting that the nearer component is moving through a denser medium leading to larger dissipation of energy and more depolarization. The tendency for the nearer component to be brighter is weaker when considers the flux density of the hotspots from our higher resolution observations with an angular resolution of about 1 arcsec. The effects of mild relativisitic motion of the hotspots appear to be more noticeable in the high-resolution images.
-
3.
The ages of the relativistic electrons in the lobes due to radiative losses range from 1.5 to 3.7 years with a median value of about 1.2 years while, the speed of separation is in the range 0.015c to 0.48c with a median value of 0.058c.
-
4.
A significant extension of emission-line gas was seen in one quasar 1232249 and possibly in one galaxy 0428281. In the case of the quasar, the emission line gas is extended within about 20∘ of the radio source axis, while in the radio galaxy 0428281, it may be related to an apparent companion galaxy.
-
5.
We have identified four cases where there appears to be a galaxy projected within about 20∘ of the position angle of the source. In two of these (0428281 and 1023226) their arm-length and brightness ratios are consistent with slowing down of the jet by possible interaction with the galaxy.
Acknowledgments
We thank Yogesh Wadadekar for introducing us to IRAF. We are indebted to an anonymous referee for very helpful and critical comments on the paper. The work by WvB was performed under the auspices of the U.S. Department of Energy by University of California Lawrence Livermore National Laboratory under contract No. W-7405-Eng-48. The National Radio Astronomy Observatory is a facility of the National Science Foundation operated under co-operative agreement by Associated Universities Inc. We thank the staff of the Very Large Array for the observations. This research has made use of the NASA/IPAC extragalactic database (NED) which is operated by the Jet Propulsion Laboratory, Caltech, under contract with the National Aeronautics and Space Administration.
References
- [] Antonucci R., 1993, ARA&A, 31, 473
- [] Baker J. C., Hunstead R. W., Kapahi V. K., Subrahmanya C. R., 1999, ApJS, 122, 29
- [] Barthel P. D., 1989, ApJ, 336, 606
- [] Best P. N., Longair M. S., Röttgering H. J. A., 1997, MNRAS, 286, 785
- [] Blundell K.M., Rawlings S., 2000, AJ, 119, 1111
- [] Chambers K. C., Miley G. K., van Breugel W. J. M., 1987, Nature, 329, 604
- [] Garrington S. T. Leahy J. P., Conway R. G., Laing R. A., 1988, Nature, 331, 147
- [] Garrington S. T., Conway R. G., Leahy J. P., 1991, MNRAS, 250, 171
- [] Garrington S. T., Conway R. G., 1991, MNRAS, 250, 198
- [] Ishwara-Chandra C. H., Saikia D. J., Kapahi, V. K., McCarthy, P. J., 1998, MNRAS 300, 269 (IC98)
- [] Ishwara-Chandra C. H., 1999, Ph. D Thesis, Indian Institute of Science, Bangalore India.
- [] Ishwara-Chandra C. H., Saikia D. J., 1999, MNRAS, 309, 100
- [] Ishwara-Chandra C. H., Saikia D. J., 2000, MNRAS, 317, 658
- [] Johnson H. L., 1963, in Strand K. AA., ed Basic Astronomical Data, University of Chicago Press
- [] Kapahi V. K., Athreya R. M., Subrahmanya C. R., Baker J. C., Hunstead R. W., McCarthy P. J., van Breugel W., 1998a, ApJS, 118, 327
- [] Kapahi V. K., Athreya R. M., van Breugel W., McCarthy P. J., Subrahmanya C. R., 1998b, ApJS, 118, 275
- [] Laing R. A., 1988, Nature, 331, 149
- [] Liu R., Pooley G., MNRAS, 1991, 253, 669
- [] McCarthy P. J., van Breugel W. J. M., Spinrad H., Djorgovski S. G., 1987, ApJL, 321, L29
- [] McCarthy P. J., Kapahi, V. K., van Breugel, W., Subrahmanya, C. R., 1990, AJ, 100, 1014
- [] McCarthy P. J., van Breugel W., Kapahi V. K., 1991, ApJ, 371, 478
- [] McCarthy P.J., Kapahi V.K., van Breugel W., Persson S.E., Athreya R.M., Subrahmanya C.R., 1996, ApJS, 107, 19
- [] Myers S. T., Spangler S. R., 1985, ApJ, 291, 52
- [] Pacholczyk A. G., 1970, Radio Astrophysics, Freeman & Company
- [] Pedelty J. A., Rudnick L., McCarthy P. J., Spinrad H., 1989 AJ, 97, 647
- [] Saikia D. J., 1981, MNRAS, 197, L11
- [] Scheuer P. A. G., 1987 in Zensus J. A., Pearson T. J., eds., Superluminal Radio Sources ,Cambridge University Press, p. 104
- [] Thuan T. X., Gunn J. E., 1979, PASP, 88, 543
- [] Urry C. M., Padovani P., 1995, PASP, 107, 803
- [] Wade R.A., Hoessel J. G., Elias J. H., Huchra J. P., 1979, PASP, 91, 35
Appendix: The sample of sources
| Source | Id | z | S1365 | P1365 | LAS | LLS |
|---|---|---|---|---|---|---|
| Name | mJy | W/Hz/sr | ′′ | kpc | ||
| 0017-207 | Q | 0.545 | 467 | 25.76 | 96 | 705 |
| 0058-229 | Q | 0.706 | 396 | 25.95 | 63 | 505 |
| 0133-266 | Q | 1.53 | 348 | 26.61 | 53 | 454 |
| 0137-263 | G | 1.1 | 509 | 26.51 | 76 | 655 |
| 0148-297 | G | 0.41 | 2778 | 26.28 | 136 | 883 |
| 0325-260 | G | 0.638 | 286 | 25.70 | 57 | 445 |
| 0346-297 | G | 0.413 | 620 | 25.65 | 127 | 831 |
| 0428-281 | G | 0.65 | 956 | 26.25 | 62 | 482 |
| 0437-244 | Q | 0.84 | 459 | 26.19 | 125 | 1040 |
| 0454-220 | Q | 0.533 | 1993 | 26.35 | 83 | 608 |
| 0551-226 | G | 0.8 | 330 | 26.00 | 53 | 438 |
| 0937-250 | G | 0.9 | 445 | 26.28 | 63 | 533 |
| 0938-205 | G | 0.371 | 444 | 25.39 | 88 | 543 |
| 0947-249 | G | 0.854 | 1487 | 26.75 | 69 | 575 |
| 0955-283 | G | 0.8 | 470 | 26.14 | 75 | 620 |
| 1022-250 | G | 0.34 | 338 | 25.20 | 52 | 305 |
| 1023-226 | G | 0.586 | 298 | 25.64 | 58 | 436 |
| 1025-229 | Q | 0.309 | 489 | 25.28 | 186 | 1041 |
| 1026-202 | G | 0.566 | 664 | 25.95 | 61 | 456 |
| 1029-233 | G | 0.611 | 403 | 25.80 | 68 | 521 |
| 1052-272 | Q | 1.103 | 553 | 26.56 | 73 | 630 |
| 1107-218 | G | 1.5 | 302 | 26.53 | 54 | 460 |
| 1107-227 | G | 2.0 | 781 | 27.40 | 64 | 527 |
| 1126-290 | G | 0.41 | 1086 | 25.89 | 104 | 676 |
| 1224-208 | G | 1.5 | 268 | 26.57 | 61 | 517 |
| 1226-297 | Q | 0.749 | 435 | 26.00 | 65 | 525 |
| 1232-249 | Q | 0.352 | 1988 | 25.97 | 108 | 648 |
| 1247-290 | Q | 0.77 | 696 | 26.27 | 58 | 470 |
| 1257-230 | Q | 1.109 | 788 | 26.65 | 51 | 441 |
| 1358-214 | G | 0.5 | 317 | 25.34 | 88 | 629 |
| 2035-203 | Q | 0.516 | 752 | 25.87 | 63 | 457 |
| 2040-236 | Q | 0.704 | 428 | 25.89 | 54 | 431 |
| 2042-293 | G | 1.9 | 414 | 26.99 | 66 | 547 |
| 2045-245 | G | 0.73 | 639 | 26.21 | 76 | 615 |
| 2118-266 | G | 0.343 | 403 | 25.24 | 86 | 510 |
| 2132-235 | G | 0.81 | 333 | 26.02 | 54 | 444 |
| 2137-279 | G | 0.64 | 455 | 25.93 | 58 | 447 |
| 2213-283 | Q | 0.946 | 820 | 26.53 | 58 | 491 |
| 2311-222 | G | 0.434 | 965 | 25.85 | 79 | 528 |
| 2325-213 | G | 0.58 | 986 | 26.17 | 75 | 566 |
| 2338-290 | Q | 0.446 | 427 | 25.51 | 72 | 489 |
| 2348-235 | G | 0.952 | 503 | 26.34 | 67 | 570 |