Mapping the Dynamics of the Quasar 3C 48
Abstract
The archetypical, nearby (z=0.37) quasar 3C 48 is an unusual CSS radio source with excess far-IR emission, whose one-sided radio jet is aligned with the extended ionized emission and a putative second nucleus. Because of its high AGN luminosity and proximity, 3C 48 is a good candidate to search for kinematic signatures of the radio jet-gas coupling and/or of a recent interaction. The radio morphology and our ground-based integral field spectroscopy suggest that the jet is interacting with its immediate environment. Using STIS aboard HST in several slit positions within the central 1”, we map the kinematics and physical conditions of the extended emission line gas and their relations to near-nuclear star forming regions found in existing HST images.
NASA/Goddard Space Flight Center, Code 681, Greenbelt, MD 20771
1. Introduction
In quasars and radio galaxies there is a relation between the properties of the radio source and those of the (optical) line-emitting gas (e.g., Miley 1983; Tadhunter, Fosbury, & Quinn 1989; Jackson et al. 1995). Compact steep-spectrum (CSS) radio sources often show disturbed kinematics of the interstellar gas coupled to associated radio components, providing evidence for gas outflow. The interaction between radio jets and the host galaxy’s ISM may be responsible for the jet confinement to small scales and can contribute to the ionization of the medium and lead to star formation (e.g., Axon et al. 1998; Clark et al. 1998; Villar-Martin et al. 1998 and 1999). Thus, detailed study of the circumnuclear regions is essential in understanding the processes that drive the kinematics, physical conditions and morphology of the line emitting gas.
![[Uncaptioned image]](/html/astro-ph/0012130/assets/x2.png)
2. Previous and Current Work
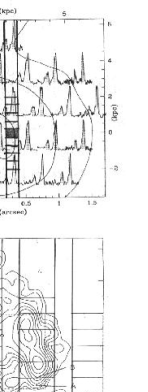
3C 48 harbours an unusually steep-core (0.7) powerful compact radio source deeply embedded in the host galaxy. Its VLBI radio structure (Figure 1 lower panel) comprises a relatively weak core, elongated N-S and a powerful one-sided jet to the north, highly disrupted at 0.05′′ from the core, through collisions with the dense interstellar medium. This jet then expands out to 1′′ NE i.e., within the body of the host galaxy. About 1.3′′ NE from the main nucleus of 3C 48, i.e., roughly coinciding with the edge of the radio jet, a high surface brightness region (3C 48A) was detected in stellar continuum light, which was tentatively identified with a second nucleus in the process of capture (Stockton & Ridgway 1991; Hook et al. 1994). In a recent paper (Chatzichristou, Vanderriest, & Jaffe 1999) we have shown that this is more likely a region of intense star formation, triggered by the interaction of the radio jet with the dense interstellar medium of the host galaxy. This interpretation is further supported by the diffuse, knotty morphology of 3C 48A as seen in HST images (Project ID#05235; also, Canalizo & Stockton 2000).
Using the technique of integral field spectroscopy at the CHFT, we have mapped the dynamics and emission line properties of the extended ionized gas of 3C 48 at a resolution of 0.7′′. In particular, we have found that the narrow emission line profiles in the central () region are split in two components, a fast moving (580 km s-1 with respect to the systemic velocity), blue-shifted, broad (1000 km s-1) component, co-spatial with the radio-jet and a spatially resolved, narrow (400 km s-1) component at the systemic redshift (Figure 1 upper panel). On the basis of these results and simple energetic arguments we argued (Chatzichristou et al. 1999) that the blue-shifted component might represent the imprint of the jet interaction, with the ambient gas. Its emission line ratios indicate that the dominant ionizing mechanism are most probably shocks driven by the radio jet into the interstellar medium. These results are intriguing and need further investigation, using data of higher quality and better spatial/spectral resolution, to establish the detailed gas kinematics in the innermost (1-2 kpc) region. Detection of additional velocity components coupled to the associated radio components (e.g., Figure 1 lower panel), will provide direct observational evidence for the AGN-driven outflow and for the motions due to bow-shocks driven by the radio jet into the ambient gas.
Using STIS aboard HST in long slit mode, we mapped the central 1′′ region in steps of 0.3′′ placing the slit along the extended line emission (N-S) previously detected 15′′ north from the nucleus. The spectral and spatial resolution of these new data represent an improvement by factors 5-10 compared to the previous data (e.g., Figure 1, upper panel). The analysis of these data is in progress. We study the gas kinematics primarily through the narrow emission line and use a variety of diagnostic emission line ratios () to investigate the ionization structure of the emitting regions. The complexity of the line profiles and the multiplicity of detected velocity components is obvious in Figure 2. A third high velocity component, at -1150 km s-1, is clearly identified and dominates the line emission at 0.5′′ NE of the nucleus. There is a wealth of structure in the line profiles, obviously coupled to the radio components seen in Figure 1 and on more recent VLBI data. The full analysis and results will be presented in a forthcoming paper, where the main questions addressed will be: what is(are) the acceleration mechanism(s) and where exactly in the flow is the gas accelerated? What is the dominant ionization mechanism? Furthermore, comparison with the ionized gas that lies further out from the radio axis allows us to estimate the cooling times and thus the shock velocities involved. Comparison of these results with existing dynamical models for the formation of NLR in AGNs will help to further constrain these models for larger jet powers and to clarify the regime of jet confinement.
References
Axon, D.J., Marconi, A., Capetti, A., Maccetto, F.D., Schreier, E., Robinson, A. 1998, ApJ, 496L, 75
Canalizo, G., Stockton, A. 2000, ApJ, 528, 201
Chatzichristou, E.T., Vanderriest, C., Jaffe, W. 1999, A&A, 343, 407
Clark, N.E., Axon, D.J., Tadhunter, C.N., Robinson, A., O’Brien, P. 1998, ApJ, 494, 546
Hook, R., Lucy, L., Stockton, A., Ridgway, S. 1994, ST-ECF Newsletter, 21, 16
Jackson, N., Sparks, W.B., Miley, G.K., Macchetto, F. 1995, A&A, 296, 339
Miley, G.K. 1983, in Proceedings of the International Workshop, Astrophysical Jets, ed. A. Ferreri & A.G. Pacholczyk (Dordrecht: Reidel), 99
Stockton, A., Ridgway, S.E. 1991, AJ, 102, 488
Tadhunter, C.N., Fosbury, R.A.E., Quinn, P.J. 1989, MNRAS, 240, 225
Villar-Martin, M., Tadhunter, C., Morganti, R., Clark, N., Killeen, N., Axon, D. 1998, A&A, 332, 479
Villar-Martin, M., Tadhunter, C., Morganti, R., Axon, D., Koekemoer, A. 1999, MNRAS, 307, 24
Wilkinson, P.N., Tzioumis, A.K., Benson, J.M., Walker, R.C., Simon, R.S., Kahn, F.D. 1991, Nature, 352, 313