Near-IR Spectroscopy and Population Synthesis
of Super Star Clusters in NGC 1569
11institutetext: Astronomy Department, University of California, Berkeley CA
94704, USA
Near-IR Spectroscopy and Population Synthesis
of Super Star Clusters in NGC 1569
Abstract
We present H- and K-band NIRSPEC spectroscopy of super star clusters (SSCs) in the irregular starburst galaxy NGC 1569, obtained at the Keck Observatory. We fit these photospheric spectra to NextGen model atmospheres to obtain effective spectral types of clusters, and find that the information in both H- and K-band spectra is necessary to remove degeneracy in the fits. The light of SSC B is unambiguously dominated by K0 supergiants (T K, ). The double cluster SSC A has higher Teff (G5) and less tightly constrained surface gravity (), consistent with a mixed stellar population dominated by blue Wolf-Rayet stars and red supergiants. We predict the time evolution of infrared spectra of SSCs using Starburst99 population synthesis models coupled with empirical stellar spectral libraries (at solar metallicity). The resulting model sequence allows us to assign ages of 15–18 Myr for SSC B and 18–21 Myr for SSC A.
1 Introduction
At a distance of about 2 Mpc kt94 , the irregular galaxy NGC 1569 is one of the nearest starbursts i88 . It is rich in ionized and neutral gas, and recently underwent a global starburst that lasted at least 100 Myr and ended 5–10 Myr ago g98 . The starburst produced numerous Hii regions and young star clusters, and still drives an x-ray superwind w91 ; h95 . One of the most notable features of the starburst is the super star clusters (SSCs) near the center of the galaxy as85 ; o94 . They are some of the nearest and earliest-known examples of young, massive, compact star clusters. These SSCs, which may evolve into clusters resembling present-day globulars m95 , have been found in all types of starburst environments, from dwarf irregulars to galaxy mergers.
2 Observations & Data Reduction
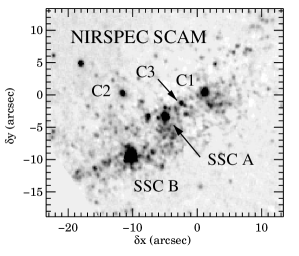
We obtained spectra and images of the SSCs in NGC 1569 on January 17, 2000 UT using the near-infrared spectrometer NIRSPEC on the Keck II telescope at the W. M. Keck Observatory. The night was photometric, with seeing of about . The K-band image (taken with the N7 filter by NIRSPEC’s slit-viewing camera) in Fig. 1 shows the brightest central SSCs of which we obtained K-band spectra (2.03–2.47 m), along with many other clusters and stellar sources. For the brightest clusters, SSCs A and B, we also obtained H-band spectra (1.49–1.78 m).
Date were reduced in the usual fashion, and the optimally extracted K-band spectra are shown in Fig. 2a. The strongest features in K band are the CO first overtone bands longward of 2.295 m. These saturated bands are found in the cool atmospheres of supergiants and giants. Their presence implies that the clusters contain stars that are at least 6 or 7 Myr old, since that much time is required before the most massive stars evolve off of the main sequence.
Stellar evolution models for a simple stellar population predict that the hot blue stars capable of driving nebular emission will have completely evolved off of the main sequence by the time red supergiants appear. Thus the conjunction of strong CO bands together with weak Br and Hei emission in the spectra of Clusters A and C1 suggests that they are not instantaneous bursts. In the case of cluster C1 we believe that the weak emission lines are explained by contamination from a nearby Hii region w91 . The weak nebular emission from SSC A (a double cluster dm97 ) is likely due to the Wolf-Rayet stars known to be present there gd97 . Thus the spectrum of SSC A cannot be explained with a single simple stellar population according to current population synthesis models. Cluster C2, on the other hand, shows both Br and Hei in absorption, which may be due to a much older population dominated by A stars and red giants.

Optimally extracted H-band spectra of SSCs A and B are shown in Fig. 2b, together with the spectrum of a K1.5 Ib supergiant from the KPNO stellar atlases wh96 ; m98 . A comparison of the star and cluster spectra reveals that most of the features in the cluster spectra are real, not noise, and that H-band photospheric spectra are remarkably rich in strong metallic and molecular features. Only the CO bands stand out in the K-band spectra, while many metal features in H band are as strong as the second overtone CO bands. Most of the features in H band are blends of lines from CO, OH, and metals such as Fe, Si, Al, and Mg.
3 The Cluster Integrated Light
The most massive, evolved members of a single-aged stellar population tend to dominate its integrated light. Thus the simplest approach to interpreting the integrated light may be to ask, what is the dominant spectral type of the cluster? We attempt to characterize a cluster by an effective spectral type by fitting its H- and K-band spectra to a grid of NextGen model atmospheres h99 , in order to determine an effective temperature, surface gravity, and metallicity for each object. The NextGen atmospheres were available for spherically symmetric giant stars with a range in Teff of 3000 K to 6800 K, a range in of 0.0 to 3.5, and metallicities of [Fe/H] 0.0 (solar), 0.3, 0.5, and 0.7.
We first test the utility of this procedure by fitting the model atmospheres to an empirical spectrum of a star of known spectral type to evaluate the precision and accuracy with which it selects the atmospheric parameters. Fig. 3a shows the resulting contours for a fit to a solar-metallicity K1.5 Ib spectrum. The resulting parameters, T K and , are a good match to those of the star. Both H- and K-band spectra were required in order to remove degeneracies in the fits.
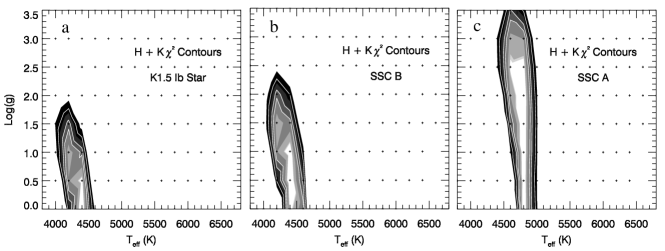
Next we fit the NextGen atmospheres at metallicity [Fe/H] (which is closest to that of NGC 1569, [Fe/H] to gd97 ; ks97 ) to the H + K spectra of the brightest K-band cluster, SSC B. The resulting contours in Fig. 3b have the same shape as those found for the star in Fig. 3a, indicating that the light of cluster B is heavily dominated by stars with a very narrow range in spectral type. The effective spectral type for SSC B is that of a K0 supergiant, with T K and .
For the double cluster, SSC A, the contours are less tightly constrained in the fit parameters than for SSC B. Fig. 3c shows them to be centered at a hotter T K and larger range of , typical for stars of types G5 I and G5 III. It is unlikely, however, that such stars dominate the cluster’s emission, since optical/UV evidence indicates that hot blue Wolf-Rayet stars are present together with the red evolved stars creating the strong infrared CO bands. Thus the inferred effective spectral type determined from the stellar atmospheres may simply result from the superposition of the two distinct populations.
4 IR Spectral Population Synthesis
Since a cluster consists of stars with a range of stellar masses, luminosities, and temperatures, it is more informative to model the integrated population directly than to focus on its effective spectral type. Thus we employ the technique of population synthesis to calculate the distribution of stars in the H-R diagram of a cluster as a function of time. We then calculate the integrated spectrum of the cluster by adding the appropriate numbers of stellar spectra – either empirical spectra or model atmospheres.
4.1 Models
All models in this paper were constructed using the updated evolutionary synthesis code Starburst99 l99 . The code incorporates the most recent stellar evolutionary tracks from the Geneva group at metallicities ranging from very metal-poor, to twice solar metallicity s92 ; s93 , and it has been updated to allow the use of isochrone synthesis. Starburst99 is a particular set of synthesis models which are optimized to reproduce properties of galaxies with active star formation, so it puts most of the emphasis on early evolutionary phases. Later phases, like AGB stars or white dwarfs, are covered only crudely or not at all.

Origlia et al. o99 show that low-metallicity tracks do not reproduce the CO 1.62 m and CO 2.29 m indices of young LMC clusters. However, if the fraction of time spent as a RSG during the core-helium phase is forced to at least 50%, and if the RSG temperature is maintained to less than 4000 K, the models agree well with the observations. Our modeling technique was modified according to this prescription (Leitherer, private communication, 2000).
In order to generate model cluster spectra, we combine the Starburst99 models with the empirical libraries of stellar spectra obtained at Kitt Peak by Wallace & Hinkle wh96 and Meyer et al. m98 . For a given cluster population, we add up the spectra of component stars, and include nebular continuum emission (but not the recombination lines) based on the number of ionizing photons predicted for the cluster. Thus we generate a time series of model cluster spectra such as that shown in Fig. 4a for a 106 M⊙ cluster with Salpeter IMF ranging from 0.1 to 100 M⊙. For the first few Myr, nebular emission powered by the hottest stars dilutes the photospheric emission from the cluster, but by an age of 6–7 Myr, the most massive stars have evolved off of the main sequence to become red supergiants, whose spectra are marked by deep CO bands.
Finally, we can place observed cluster spectra in an evolutionary sequence by fitting them to the model sequences. Figure 4b displays the H-band spectra of SSCs A and B together with the three model cluster spectra (15, 18, and 21 Myr) which most closely resemble the observations. Note the correspondence between features and the decrease in their strength with time. Since the models are for solar metallicity clusters, they presumably have stronger metal features at a given age than expected for a lower-metallicity cluster. Thus the age estimates we derive from these models will be too large during this epoch of the cluster’s evolution.
5 Conclusions
We have presented new high-quality near-infrared spectra of several of the SSCs in the nearby irregular starburst, NGC 1569, and demonstrated the utility of the rich H-band spectral region for modeling stellar populations. We found that combining H- and K-band spectra removed some of the degeneracy in fitting just one band to model spectra.
We used population synthesis models together with model stellar atmospheres and empirical stellar spectra to fit for the effective spectral type of a cluster, and to generate sequences of synthetic cluster spectra to help determine the ages of observed clusters. Since the empirical libraries are only complete for solar metallicity, we are constructing models that use model atmospheres at lower metallicities that are more appropriate for systems like NGC 1569.
References
- (1) H. Arp, A. Sandage: AJ 90, 1163 (1985)
- (2) G. De Marchi et al.: ApJ 479, L27 (1997)
- (3) R.M. Gonzalez Delgado et al.: ApJ 483, 107 (1997)
- (4) L. Greggio et al.: ApJ 504, 725 (1998)
- (5) P.H. Hauschildt, F. Allard, E. Baron: ApJ 512, 377 (1999)
- (6) T.M. Heckman et al.: ApJ 448, 98 (1995)
- (7) F.P. Israel: AAp 194, 24 (1988)
- (8) I.D. Karachentsev, N.A. Tikhonov: AAp 286, 718 (1994)
- (9) H.A. Kobulnicky, E.D. Skillman: ApJ 489, 636 (1997)
- (10) C. Leitherer et al.: ApJS 123, 3 (1999)
- (11) G.R. Meurer: Nature 375, 742 (1995)
- (12) M.R. Meyer, S. Edwards, K.H. Hinkle, S.E. Strom: ApJ 508, 397 (1998)
- (13) R.W. O’Connell, J.S. Gallagher III, D.A. Hunter: ApJ 433, 65 (1994)
- (14) L. Origlia, J.D. Goldader, C. Leitherer, D. Schaerer, E. Oliva: ApJ 514, 96 (1999)
- (15) G. Schaller, D. Schaerer, G. Meynet, A. Maeder: AApS 96, 269 (1992)
- (16) D. Schaerer et al.: AApS 102, 339 (1993)
- (17) L. Wallace, K.H. Hinkle: ApJS 107, 312 (1996)
- (18) W.H. Waller: ApJ 370, 144 (1991)