EUV and soft X–rays from clusters of galaxies – the ‘cluster soft–excess’ phenomenon
Abstract
Clusters of galaxies are strong emitters of EUV and soft X-rays substantially in excess of the contribution from the hot intra–cluster medium at X–ray temperatures. After the initial discovery of EUV excess emission in the Virgo cluster, the phenomenon was reported also for the Coma, A1795 and A2199 clusters. Recent reobservations confirmed the finding, and further searches on a large sample of nearby galaxy clusters are clearly revealing the cosmological impact of the discovery.
1 Introduction
The launch of the first X–ray satellites brought the astounding discovery that the space between galaxies in clusters is filled with a very hot (T K) and tenuous gas which emits X-ray radiation by bremsstrahlung processes. It is now clear that a hot intra–cluster medium (ICM) is a general feature of clusters of galaxies, which carries a susbstantial fraction of a cluster’s total mass.
As free-free radiation in a hot plasma generates broad band emission, some extreme–ultraviolet (EUV) and soft X–ray radiation from clusters of galaxies is expected as the low–energy tail of the hot ICM radiation. In recent years, the Extreme Ultraviolet Explorer (Bowyer and Malina 1991), an explorer class mission of NASA, opened a unique window to the EUV sky in the 65-200 eV passband 111With the Deep Survey Lexan/Boron filter, revealing that many clusters of galaxies emits EUV radiation substantially in excess of the expected contribution from the hot plasma. The Virgo (Lieu et al. 1996a) and Coma clusters (Lieu et al. 1996b), two among the nearest clusters of galaxies that lie along lines of sight of low Galactic hydrogen column densities (), were the first to show this cluster soft–excess (CSE) phenomenon, later followed by A1795 (Mittaz et al. 1998) and A2199 (Lieu, Bonamente and Mittaz 1999).
In this paper we highlight some of the main features of the CSE by reporting the analysis and interpretation of recent EUVE re–observations and of ROSAT PSPC data. Although the cause of the phenomenon is still actively under investigation, we indicate the possible origin of the emission, and comment on the cosmological impact of the CSE.
2 EUVE observations with in situ background measurements
The EUVE detectors are known to have a time–variable background which originates from several sources (Lieu at al. 1993). It was recently shown (Lieu at al. 1999a) that the most appropriate way of handling the EUVE DS background is via an in situ measurement, i.e. a background measurement from a portion of sky devoid of celestial sources which is placed at small off-set angles from the source under investigation, the measurement being carried out time-contiguously to the source pointing.
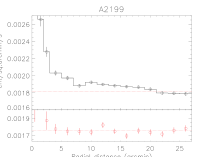
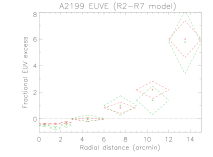
Abell 2199 was the first cluster re-observed by EUVE in the forementioned manner (Lieu et al. 1999a) , with resulting EUV emission detected out to a radial distance of 20 arcmin (Fig. 1a), confirming the early findings. When compared to the emission expected from the hot ICM 222 This is a relatively straightforward procedure. For more detailed information, we refer the reader to Lieu et al. 1996a; Lieu, Bonamente and Mittaz 1999; Mittaz et al. 1998; Bonamente, Lieu and Mittaz 2000a and references therein. Essentially we model the PSPC spectra (R2-R7 bands, or 0.2-2.0 keV by photon energy) with a thin plasma emission code appropriate to the hot ICM, and calculate the expected fluxes from this component in soft X-rays and EUV. the CSE was found to be relatively more prominent at large cluster radii (Fig. 1b): the surface brightness of the CSE peters out with radius less rapidly than that of the hot ICM emission. (the latter follows the customary profile of intensities, see e.g. Cavaliere and Fusco–Femiano 1978). A similar trend, to which we shall refer hereafter as the soft–excess radial trend (SERT), is also seen in Virgo and A1795, as follows.
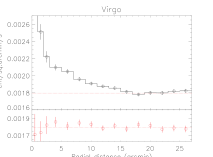
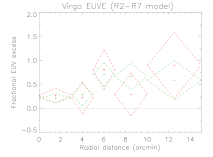
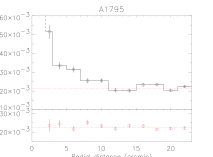
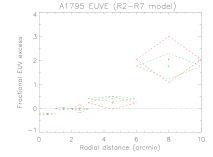
EUVE reobservations were also performed on the A1795 and Virgo clusters with pointings (Bonamente, Lieu and Mittaz 2000a). Following the analysis method (of Lieu at al. 1999a) previously applied to A2199, the Virgo cluster showed a halo of diffuse EUV emission out to a radial distance of about 15 arcmin (Fig. 2a), and A1795 was detected out to a radius of about 10 arcmin (Fig. 3a), confirming the early results. The radial profiles of the excess emission for these two clusters, see Fig. 2b and Fig. 3b, show a clear signature of the SERT effect.
3 Soft excess emission in the PSPC passband
The ROSAT PSPC instrument has significant effective areas at soft X–ray energies ( keV, the so called R2 or C-band, pulse–invariant channels 20-41; Snowden et al. 1994). It is therefore possible to explore the presence of excess soft X–ray emission from clusters of galaxies in a band that is neighboring to that of the EUVE Deep Survey instrument. This was already clear since the early investigations of the CSE, as Lieu et al. (1996a, 1996b) reported detections of 1/4 keV band excess emission from Coma and Virgo. Later, also two pointed PSPC observations of A1795 revealed similar excesses at soft X–ray energies (Bonamente, Lieu and Mittaz 2000a). In Fig. 4 we summarize the data.


The employment of PSPC carried the advantage of a large database of clusters to be searched for soft–excess emission. We started our search for soft X–ray excess emission in the PSPC passband with a sample of four nearby clusters member of the Shapley concentration: A3571, A3558, A3560 and A3562, in the redshift range z 0.05-0.058. A3571 and A3558 are rich and hot clusters (Markevitch et al. 1998), while A3560 and A3562 show a lower X–ray luminosity. The Shapley concentration lies along lines of sight of moderate Galactic hydrogen ( 4-4.5 cm-2), which absorbs about 95-99 % of source soft X–ray photons. This results in observations of moderate S/N, particularly for the lower intensity clusters; four pointed PSPC observations showed nonetheless clear evidence for soft excess emission among all of these clusters, and particularly evident in A3571 and A3558 (Fig. 5). The detection of excess soft X–ray emission in the Shapley supercluster sample indicates that CSE may be a common syndrome of galaxy clusters. A more detailed investigation of these and other clusters is in progress (Bonamente et al. 2001).


4 Interpretation of the excess fluxes
Currently there are two main scenarii which contend for the interpretation of the excess fluxes: the non–thermal model (Sarazin and Lieu 1998; Hwang 1997; Ensslin and Biermann 1998), which invokes an Inverse Compton effect as cause for the emission, and the original thermal model (Lieu et al. 1996a) which invokes ‘warm’ intra–cluster gas (at T K). Although the issue may ultimately be resolved by spectroscopy, energetic requirements of the non–thermal scenario appear quite demanding. For the case of the Coma cluster (Lieu et al. 1999b), a population of cosmic rays (CR) in approximate energy equipartition with the hot ICM was enlisted to explain the detected signals. The requirements appear even more severe in the case of A1795, and the excess emission of Virgo meets no compelling interpretation as an IC effect (Bonamente, Lieu and Mittaz 2000a). On the other hand, the CSE may be interpreted as radiation from a thin plasma at ‘warm’ temperatures (T 0.1 keV). In more quantitative terms, we provide in Tables 1–4 a comparison between the two interpretations for Virgo and A1795, where we also entertained the notion of ‘aging’ of the relativistic electrons for the non–thermal model.
| MEKAL+MEKAL | MEKAL+PO | MEKAL+‘aged’ PO | |||
|---|---|---|---|---|---|
| Region | red. | ||||
| (arcmin) | (keV) | (Gyrs) | (d.o.f.) | ||
| 0–3 | 0.066 | 0.36 | 3.3 | 0 | 1.6(181) |
| 3–5 | 0.079 | 0.28 | 4 | 0 | 1.66(181) |
| 5–7 | 0.079 | 0.4 | 4.4 | 1.1 | 2(180) |
| 7–10 | 0.09 | 0.59 | 4.2 | 1.8 | 1.11(180) |
| 10–15 | 0.083 | 1.1 | 4.5 | 2.1 | 1.2(180) |
| MEKAL+MEKAL | MEKAL+‘aged’ PO | ||||
|---|---|---|---|---|---|
| Region | red. | Red. | |||
| (arcmin) | (keV) | (d.o.f.) | (Gyrs) | (d.o.f.) | |
| 1–2 | 0.125 | 0.045 | 1.0(363) | 1.7 | 1.0(363) |
| 2–3 | 0.11 | 0.0285 | 1.16(363) | 2.25 | 1.15(363) |
| 3–6 | 0.049 | 0.12 | 0.97(363) | 2.8 | 0.98(363) |
| 6–10 | 0.025 | 110 | 0.88(363) | 3.7 | 0.88(363) |
| Region | |||||
|---|---|---|---|---|---|
| (arcmin) | (erg cm-3) | ||||
| 1–2 | 0.9 | 1.6 | 88.3 | 35.3 | 1.9 |
| 2–3 | 1.3 | 1.0 | 128 | 85.8 | 4.8 |
| 3–6 | 4.5 | 1.0 | 120 | 52.7 | 2.3 |
| 6–10 | 22.0 | 6.8 | 17.6 | 2.5 | 0.22 |
| Virgo | A1795 | ||||
| Region | Region | ||||
| (arcmin) | ( cm-3) | ( cm-3) | (arcmin) | ( cm-3) | ( cm-3) |
| 0–3 | 5.2 | 50 | 0–1 | — | 3.7 |
| 3–5 | 2.4 | 10 | 1–2 | 0.92 | 3.3 |
| 5–7 | 1.9 | 7.5 | 2–3 | 0.45 | 2.7 |
| 7–10 | 1.4 | 5 | 3–6 | 0.3 | 1.6 |
| 10–15 | 1.0 | 3 | 6–10 | 4.5 | 0.93 |
If the CSE is indicative of ‘warm’ baryons in clusters of galaxies, what are then their mass implications? In absence of a precise knowledge of the clumping of the warm gas, a 100 % filling factor results in masses comparable to those of the hot phase (see Table 4 for the cases of Virgo and A1795), and potentially even larger at large cluster radii, as indicated by the increasing trend (SERT) of the fractional EUV excesses (Fig. 2 and 3). Similar mass implications also apply to the excess emission of A2199 (see Lieu et al. 1999a).
The consensus on the baryonic content of our Universe, as reported by many independent researchers also at this Conference, ranges between , whereby the total matter content is currently parametrised as . Our results show that the cluster soft–excess phenomenon may be indicative of a new baryonic component with mass density (relative to the ‘critical’ density) which could constitute a sizeable fraction of , although probably not so massive as to bridge the gap between the current estimates of and .
5 Conclusions
We showed that EUV and soft X–ray observations of clusters of galaxies reveal the presence of excess emission above the well known radiation from the hot ICM. A possible interpretation of this phenomenon invokes substantial quantities of warm gas that may coexist with gases at higher and lower temperatures. Recent investigations of PSPC images also provided evidence for cold gas (T K) with small covering factors (Bonamente, Lieu and Mittaz 2000b). As more clusters are found to exhibit the phenomenon, its possible relevance to cosmology increases. Could this be in the form of a new contribution to the baryonic content of our Universe () ?
Acknowledgments
We acknowledge NASA/ADP for financial support. MB acknowledges the support of a post–doctoral fellowship at the Catania Astrophysical Observatory. RL is grateful to the IAP and Florence Durret for hospitality.
References
- [1] M. Bonamente, R. Lieu and J.P.D. Mittaz, ApJL in press, (2000a).
- [2] M. Bonamente, R. Lieu and J.P.D. Mittaz, ApJ 545, - (2000b).
- [3] S. Bowyer and R.F. Malina , EUV Astronomy, eds. R.F. Malina and S. Bowyer (New York:Pergamon) , 397 (1991).
- [4] A. Cavaliere and R. Fusco–Femiano, A&A 70, 677 (1978).
- [5] T.A. Ensslin and P.L. Biermann, A&A 330, 90 (1998).
- [6] R. Lieu, S. Bowyer, M. Lampton, P. Jelinsky and J. Edelstein, ApJ 417, 41L (1993).
- [7] R. Lieu, J.P.D. Mittaz, S. Bowyer, F.J. Lockman, C.-Y. Hwang and J.H.H.M. Schmitt 1996a, ApJ 458, L5 (1996a).
- [8] R. Lieu, J.P.D. Mittaz, S. Bowyer, J.O. Breen, F.J. Lockman, E.M. Murphy and C.-Y. Hwang,1996b, Science 274, 1335 (1996b).
- [9] R. Lieu, M. Bonamente, J.P.D. Mittaz, F. Durret, S. Dos Santos and J.S. Kaastra, 1999, ApJ 527, L77 (1999a)
- [10] R. Lieu, W.-I. Ip, W.I. Axford and M. Bonamente, ApJ 510, L25 (1999b).
- [11] Lieu R., Bonamente M., Mittaz ApJ 517, L91 (1999).
- [12] M. Markevitch, W.R. Forman, C.L. Sarazin and A. Vikhlinin, ApJ 503, 77 (1998).
- [13] J.P.D. Mittaz, R. Lieu, F.J. Lockman, ApJ 498, L17 (1998).
- [14] C.L. Sarazin and R. Lieu, ApJ 494, L177 (1998).
- [15] S.L. Snowden, D. McCammon, D.N. Burrows and J.A. Mendenhall, ApJ 424, 714 (1994).,