PMN J0525-3343: soft X–ray spectral flattening in a blazar at z=4.4
Abstract
We report optical, radio and X–ray observations of a new distant blazar, PMN J0525-3343, at a redshift of 4.4. The X-ray spectrum measured from ASCA and SAX flattens below a few keV, in a manner similar to the spectra of two other blazars, GB 1428+4217 (=4.72) reported by Boller et al and RXJ 1028.6-0844 (=4.28) by Yuan et al. The spectrum is well fitted by a power-law continuum which is either absorbed or breaks at a few keV. An intrinsic column density corresponding to H-atoms cm-2at solar abundance is required by the absorption model. This is however a million times greater than the neutral hydrogen, or dust, column density implied by the optical spectrum, which covers the rest-frame UV emission of the blazar nucleus. We discuss the problems raised and suggest that, unless there is intrinsic flattening in the spectral distribution of the particles/seed photons producing X–rays via inverse Compton scattering, the most plausible solution is a warm absorber close to the active nucleus.
keywords:
galaxies: active - galaxies: individual: PMN J0525-3343 - X-ray: galaxies.1 Introduction
Active Galactic Nuclei (AGN) at high redshift are powerful tools with which to study the evolution of massive black holes and of their young galaxy hosts. A particularly interesting class is formed by several high redshift (), X-ray bright, radio–loud quasars (Fabian et al 1997, 1998; Moran & Helfand 1997; Zickgraf et al 1997; Hook & McMahon 1998) which present characteristics typical of blazars. One such source, GB 1428+4217, is variable in both the X-ray and radio bands and has a spectral energy distribution which peaks at hard X-ray energies (Fabian et al 1998). Recently this object (Boller et al 2000) and RXJ1028.6-0844 (Yuan et al 2000) have been found to show spectral flattening which is interpreted as due to X-ray absorption, implying an absorbing column density of cm-2and cm-2, respectively, if intrinsic. We report here on the discovery and study of a similar object, PMN J0525-3443 at , which shows similar spectral flattening.
Fiore et al (1998) have earlier found from ROSAT data an apparent systematic decrease with redshift of the spectral slope of the soft X–ray emission of radio-loud quasars from local to objects. The change in spectra with redshift might be associated with an increase with redshift in the amount of absorbing (intrinsic or external) gas. Cappi et al (1997) find evidence for absorption using ASCA data for a small sample of high-redshift () radio-loud quasars. Confirmation of a systematic spectral flattening has been also reported by Reeves & Turner (2000) for a significant number of radio–loud sources observed by ASCA up to =4.2. Understanding the nature and evolution of this spectral change will be of great importance for our knowledge of gaseous environments of powerful quasars, their intrinsic properties as well as their cosmological evolution and the radio–loud quasar/galaxy connection.
The object under study here, PMN J0525-3343, was identified by McMahon and Hook as part of their program to identify high redshift radio–loud quasars (Hook & McMahon 1998). The quasar was selected as a flat spectrum (i.e. 0.5; ) radio source using the 4850 MHz Parkes-MIT-NRAO (PMN) survey (Wright et al 1996) and 1.4 GHz NRAO VLA Sky Survey (NVSS, Condon et al 1998). The 5.0GHz and 20cm fluxes are 21018 and 188.75.7 mJy, respectively, giving a spectral index . The radio sources were matched against the APM UKST catalogue using the NVSS radio position and it was identified as a red stellar object with R=18.5 and colour B–R=2.80. Subsequent optical spectroscopy identified the radio source as a quasar with z=4.4. It was confirmed to be an X–ray source with the ROSAT HRI and we have since observed it with ASCA and SAX. We present here X-ray fluxes and spectra, together with measurements of its radio and optical spectra. PMN J0525-3443 is the second most distant object in the X–ray bright, radio–loud class of quasars.
The optical, radio and X–ray data analysis procedure and results are reported in Sections 2, 3 and 4, respectively, while discussion and conclusions are presented in Sections 5 and 6. =50 km s-1 Mpc-1 and =0.5 have been used throughout the paper.
2 Identification and Optical data
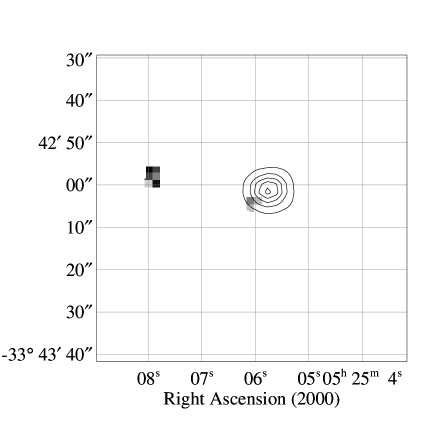
An X–ray image of the quasar was obtained with the ROSAT HRI on 1998 March 4–6 for 8222 s. Contours of X-ray emission are overlaid on the POSS optical image in Fig. 1, demonstrating that the X–ray identification is secure (the approximately 4 arcsec offset is within the ROSAT positional uncertainties).
An optical spectrum covering the spectral range 4000-9000Å was obtained on 1998 October 15 with the R-C spectrograph on the CTIO 4m telescope. It is shown in Fig. 2 (reproduced from Peroux et al 2000, in prep). The spectrum is characterized by emission lines at 6600Å from the Lyman-(1216Å)+NV(1240Å) blend and CIV(1549) at 8300Å. The Lyman- line has a peak at 658710Å corresponding to a redshift of 4.418. The observed equivalent width of the Ly-/NV blend is 191Å (EW(rest)=35Å). This is relatively small compared with radio–quiet 4 quasars, but similar to that of the other strongly X-ray emitting radio–loud quasars (see Figure 4 in Hook & McMahon 1998). The peak of the CIV emission line is at 834010Å corresponding to a redshift of 4.384. The observed and rest frame equivalent widths are 131Å and 30Å, respectively. The CIV line is asymmetric with a strong CIV absorption doublet (observed EW=13.5Å) at 0.0005 i.e. redshifted with respect to the peak of the CIV emission line by 2700 km s-1. This absorption system also displays absorption from SiIV(1394,1403) and NV and Lyman- where the observed EW of Lyman- is 7.9 (rest=1.45) Å.
There is no evidence for an optically thick Lyman-limit system at the redshift of the quasar and we set a conservative upper limit of the column density at cm-2 i.e. 1. To be consistent with the above Lyman- absorption line strength and the constraint on , the doppler parameter 40 km s-1.
The emission line redshift difference of 1800 km s-1 is smaller than the CIV line width (FWHM) of 11,500 km s-1 and is within the range observed in other 4 quasars (11001790 km s-1; Storrie-Lombardi et al 1996) and in lower redshift quasars (Tytler & Fan 1992). We take the redshift of the quasar to be the mean of these two lines at 0.006. CIV absorption within 5000 km s-1 of the CIV emission line redshift is quite common in radio–loud quasars, though its origin is debatable (Anderson et al 1987).
The continuum flux at a rest frame wavelength of 1450Å is 5.8 10-17 erg s-1 cm-2 Å-1, while the spectral index is difficult to measure due to the presence of broad weaker emission lines that lie between NV and CIV.

3 Radio data
PMN J0525-3343 was observed for two hours on 1998 December 30 with the Very Large Array in the C (3 km) configuration, and for 2 hr on 1999 February 26 in the D (1 km) configuration. The radio source was observed at 8.4 GHz, 22 GHz, and 43 GHz. The spatial resolutions for the 3 km array observations were: x, x, and x, respectively (FWHM of major and minor axes of the Gaussian restoring beam, with major axis position angle oriented north-south at all frequencies). The absolute flux scale was set by observing 3C 286. The radio source position was found to be: 05 25 06.180.16, -33 43 05.55 (J2000). Its flux density on 1998 December 30 was 41.0 0.8 mJy at 8 GHz, 12.1 0.5 mJy at 22 GHz, and 5.5 0.6 mJy at 43 GHz. On 1999 February 26 it was 39.9 0.8 at 8 GHz, 11.1 0.7 at 22 GHz, and 6.5 0.9 at 43 GHz. Thus no significant variability has been detected on a time scale of two months, with limits of 3 per cent at 8 GHz, 7 per cent at 22 GHz, and 18 per cent at 43 GHz. The source appeared spatially unresolved at all frequencies. The 43 GHz image constrains the size to be less than 0.4′′ in the east-west direction, and less than about 1′′ in the north-south direction.
The spectral index over the observed frequency range of 8 to 43 GHz is =1.2. The steep spectral index for this blazar may be due to the high rest frame frequency range of 44 GHz to 240 GHz. Steep spectrum cores at observed frequencies 8 GHz have been seen in many 2 radio–loud quasars and radio galaxies (Lonsdale, Barthel & Miley 1993, Carilli et al 1997). Lonsdale et al (1993) present models in which the dominant component in the core-jet may not be synchrotron self-absorbed at these high frequencies, thereby setting a lower limit of about 1 mas to the typical size of the dominant core radio component.
Our present observations do not constrain the sub-arcsec radio structure of the object; very long baseline interferometry is in progress.
4 X–ray data
The ROSAT HRI count rate of the source on 1998 March 4–6 was ct s-1. PMN J0525-3343 was next observed with ASCA on 1999 March 1-2. The data reduction was done using FTOOLS version 4.2 and the standard calibration provided by the ASCA Guest Observer Facility (ASCA GOF) at NASA/Goddard Space Flight Center. Good exposure times for each detector pair are 34 ks for the SIS and 31 ks for the GIS.
We consider the 0.8–10 keV data from both the SIS and GIS detectors, taking into account the possible systematic error discussed below. Although a significant deficiency in the SIS detector response curve below 1 keV has been reported for observations carried out after 1994 (ASCA GOF 1999), which could lead to an overestimate in measured absorption column densities, this effect should not be relevant here since the statistical error dominates over the systematic one in this faint X-ray source. In the energy range we use, the SIS and GIS data are indeed in good agreement and therefore an X-ray deficit in the low energy band, as reported below, is not an artifact of the calibration uncertainty. The SIS data in the 0.6–0.8 keV band are consistent with the trend found from the higher energy data. The result is also confirmed by the SAX/LECS data.
A fit with a simple power-law modified only by the Galactic absorption (a column density of cm-2; Elvis, Lockman & Fassnacht 1994) yields a photon index () of with for 210 degrees of freedom (uncertainties on all spectral parameters are quoted at the 90 per cent confidence level). This fit is statistically acceptable, but leaves systematic, curved residuals across the fitted energy range. This spectral feature can be accounted for by introducing a flattening in the low energy part of the spectrum either due to excess absorption – local or intrinsic – or to an intrinsic change in the (power–law) slope. The inclusion of the low energy spectral flattening improves the quality of the fit by about 10 in for both models (see Table 1; these improvements are significant at the 99.9 and 99 per cent confidence levels for the absorption and broken power-law models, respectively). We assume neutral absorption and solar abundances (solar or higher nuclear abundances appear to be present even at such high , eg Shields & Hamann 1997).
SAX observed the source on 2000 February 27-28, with the three main detectors of the Narrow Field Instrument package. The exposure times for each detector are 24 ks, 60 ks and 29 ks for the LECS, MECS and PDS, respectively. The background subtracted PDS count rate is cts s-1, which is just above the systematic error of the instrument ( cts s-1, Guainazzi & Matteuzzi 1997). We therefore consider the PDS detection as not significant. The extrapolation of the best-fit model obtained from the LECS and MECS data is consistent with the PDS result (marginally significant detection would be achieved at the ASCA flux level). Spectral flattening is evident at low energies; drops by 2 for intrinsic absorption and 7 for a broken power law.
| Model | /d.o.f. | ||||
|---|---|---|---|---|---|
| (1021 cm-2) | (keV) | ||||
| ASCA | |||||
| Power-law | 1.38 (1.32-1.44) | 201.0/210 | |||
| Broken power-law | 0.93 (0.52-1.15) | 1.72 (1.35-2.12) | 1.54(1.43-1.66) | 189.7/208 | |
| Power-law + free local | 2.0(1.1-2.9) | 1.60(1.47-1.73) | – | – | 190.0/209 |
| Power-law + intrinsic | 180(68-260) | 1.67(1.51-1.85) | – | – | 190.1/209 |
| SAX+ASCA | |||||
| Power-law | 1.40 (1.34-1.46) | 233.2/237 | |||
| Broken power-law | 0.90(0.54-1.12) | 1.72(1.35-2.10) | 1.57(1.47-1.68) | 216.3/235 | |
| Power-law + free local | 1.9(1.1-2.8) | 1.63(1.52-1.75) | – | – | 216.7/236 |
| Power-law + intrinsic | 170(95-360) | 1.67(1.54-1.82) | – | – | 218.5/236 |
As the fit to the SAX data is consistent with the ASCA one (no indication of spectral changes between the two observations can be found) we performed a joint fit of the two datasets, leaving the relative normalization free. The flattening is convincingly seen from both instruments (see Fig. 3) and both the (intrinsically) absorbed power-law model and the broken power–law give statistically good fits to the combined data (see Fig. 4, Table 1).
The observed flux is erg cm-1 s-1 (ASCA). No statistically significant variations were found within the individual observations – weak variability is only hinted at in the second half of the ASCA observation, with an amplitude not exceeding 30 per cent (see Fig. 5). However the flux change between the ASCA and SAX datasets corresponds to a variation of 60 per cent over 2 months in the source frame, i.e. the flux ratio ASCA/SAX is 1.60.2. Note that the agreement in flux calibration between SAX (MECS) and ASCA is better than 3 per cent, according to the results of the (quasi-) simultaneous observations of 3C273 (see Yaqoob & ASCA Team 2000). Although this intercalibration might depend on the spectral shape of a source, the spectra of 3C273 and PMN J0525-3343 are similarly hard and thus we expect that the agreement should be at the same level. Therefore systematic errors between the two instruments are much smaller than the statistical one.
Only marginal variability has been instead found between the ASCA and SAX observations and the ROSAT HRI one: the HRI count rate in the 0.1–2.4 keV band corresponds to a flux of erg cm-2 s-1, assuming Galactic absorption and the ASCA/SAX photon index of , to be compared to erg cm-2 s-1 for the ASCA (SAX) observations, respectively.


The integrated hard X–ray luminosity, not corrected for absorption, is erg s-1 (rest frame range 11 – 54 keV).
Finally, we note that the observed X–ray variability, which sets limits on the emitting region size cm, being the Doppler factor, and the broad band spectral indices (i.e, , where the optical radiation is assumed unbeamed) suggest that the emission properties of PMN J0525-3433 resemble those of blazars (see also Fabian et al 1999).
5 Discussion
PMN J0525-3433 (here), GB 1428+4217 (Boller et al 2000) and RXJ 1028.6-0844 (Yuan et al 2000) are the most distant objects for which it has been possible to determine X-ray spectral features, i.e. a flattening of the lower energy X–ray spectrum. Intriguingly, the inferred soft energy (observer frame) spectral slope of PMN J0525-3433 follows the trend found by Fiore et al (1998) and Reeves & Turner (2000) for sources up to 4.2. As it is not yet clear whether this is due to external or intrinsic absorption, or to the shape of the emitting particle or soft photon spectra we will discuss all possibilities in turn.
5.1 Absorption
The first issue concerns whether absorbing material is located along the line of sight or is intrinsically associated with the system. The hypothesis in which the spectral flattening is due to changes in the source, either evolutionary or cosmological changes, is favoured by the fact i) that the flattening seems to be associated mostly with higher redshift radio–loud quasars (although the data are sparse, the only two radio-quiet quasars showing a flattening in the Reeves & Turner sample seem to be atypical sources); ii) that as well as PMN J0525-3433 the other three quasars show this feature: it therefore appears unlikely that an (unusually thick) absorber is located along the lines of sight to all of them.
It is therefore interesting to explore viable origins of the putative intrinsic absorbing gas. Note that the results on PMN J0525-3343 seem to definitely exclude that the trend in flattening is due to a shift of a soft X–ray excess component out of the observational band in the higher redshift objects: since the soft X-ray spectrum is flatter than, and not similar to, the hard X–ray one. 111Note also that the ROSAT PSPC (data used by Fiore et al) would not have enabled a flattening in PMN J0525-3343 (and thus in all lower redshift objects) to be seen, as the break energy would have been close to the upper extreme of its spectral coverage.
It is possible that the gas occupies a large scale, although this requires high values of the mass of the absorber. It might, for example, be associated with a galactic outflow, perhaps following the formation and initial activity of the central black hole, which expels gas from the host–galaxy (Silk & Rees 1998, Fabian 1999), with inferred mass outflows of the order of few yr-1.
On the other hand, Elvis et al (1998) have pointed out that in the ‘flattening’ sources the presence of absorbing line systems at high velocities (up to 10,000 km s-1) and/or reddening, are unusually common. Thus a nuclear origin is favoured, at least for the highest line velocity systems.
5.1.1 X-ray vs optical-UV absorption
We stress however that serious problems arise, independently of the location or nature of the absorbing material. The column densities inferred from the X–ray spectrum imply, for a standard gas-to-dust ratio and composition, an extinction in the optical–UV band far in excess of that allowed from the detected optical fluxes. The UV reddening constraints indicate that the column density in neutral hydrogen is less than cm-2 to the nucleus whereas the X-ray spectrum requires a column corresponding to cm-2(equivalent to ).
High metal enrichment or the presence of large dust grains (presumably not yet fragmented at high redshift) are possibilities which can account for the qualitatively similar discrepancy between the inferred and in both local radio–quiet sources (e.g. Salvati & Maiolino 2000) and in radio–galaxies (e.g. Cen A). Nevertheless, such possibilities do not seem sufficient to account for the large discrepancy found in PMN J0525-3343.
A possibility is that the optical photons are scattered along the line of sight. Strong (if unbeamed) emission and a high covering factor for the scattering medium are required. Note that the optical component cannot be totally dominated by beamed emission, although the intrinsic EW of the lines appear rather low compared to those of unbeamed objects. Although possible for one object it would be very unlikely if this geometry applied to all three objects yet studied above .
One alternative solution to the millionfold discrepancy is that the absorbing gas is highly ionized and dust destroyed, because of the nuclear source itself or high temperature, so that the absorber is, say, OVII (most absorption will be due to oxygen at the observed energies). The absorber therefore resembles a warm absorber such as is common in Seyfert galaxies (Reynolds 1997). Indeed, the presence of absorption features associated with CIV (and Lyman- + NV), which are seen in almost all luminous quasars with X–ray absorption column densities comparable to that inferred from PMN J0525-3343 (e.g. Brandt, Laor & Wills 2000), supports this hypothesis. (The CIV and X-ray absorbers in low objects are not due to exactly the same material, but are clearly associated in some way.)
In order to verify the viability of the warm absorber hypothesis, we have performed X–ray spectral fits using the results from the photoionization code CLOUDY, allowing the column density and ionization parameter to vary. and are the luminosity of the ionizing source, the density of the absorber and its distance from the source, respectively. The intrinsic spectral index of the ionizing radiation is fixed at the value obtained from the fitting of the highest X-ray energy spectrum. The results are shown as confidence contours of vs in Fig. 6, and are well consistent with a moderate ionization parameter of and a high column cm-2. The attenuation of the optical–UV spectrum obtained is consistent with observations, provided that (so that the HI photoelectric edge remains small; i.e. ).

5.2 Intrinsic spectral properties
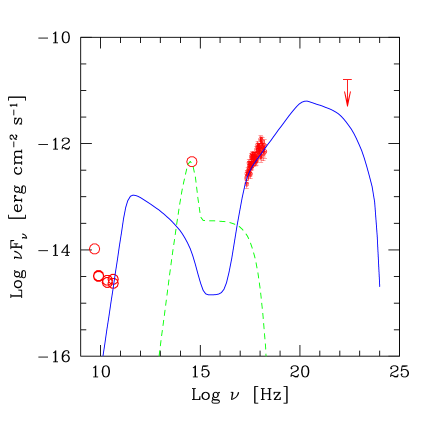
An alternative view might invoke evolution with redshift of the spectral characteristics of either the emitting particle distribution and/or an external photon field. The most accepted scenario for blazar emission attributes the production of the high energy component to inverse Compton scattering of soft photons on relativistic electrons. For the powerful sources an intense quasi–isotropic radiation field, peaked at frequency , is believed to be produced in the nuclear regions. This dominates over the synchrotron photon energy density emitted locally inside the jet, and provides the seed photons for scattering (Sikora, Begelman & Rees 1994). This scenario has been quite convincingly tested by fitting the spectral energy distributions of tens of local () blazars (e.g. Ghisellini et al 1998) and at least two at the largest redshifts: GB 1428+4217 at (Fabian et al 1998) and in Fig. 7 we show the specific modeling for PMN J0525-3343 (see the figure caption for the parameters involved in the fit). Note in particular that there is an apparent tendency for the high redshift sources to require more extreme values of the intensity of the external soft photon field compared with lower redshift objects, in turn leading to larger cooling through scattering on external photons.
Note that the spectral break observed here is significantly different from that already found in some blazars, where both convex and concave (e.g. Wolter et al 1998) X–ray spectra are observed. The former ones are interpreted as due to the contribution of both the steep synchrotron and flat inverse Compton emission, at lower and higher frequencies, respectively, while the latter ones are well reproduced as the tail of the synchrotron component: there however the higher energy part of the spectrum is extremely steep, at odds with the flat high energy component detected in PMN J0525-3343.
5.2.1 A cutoff in the particle distribution
A flattening of the spectrum could indeed be expected if there is a low energy cutoff in the emitting particle distribution. In fact, within the above picture, a low energy cutoff in the relativistic particle distribution at would produce a flattening in the scattered spectrum below , where is the bulk Lorentz factor. The flattest slope which could in principle be obtained corresponds to the energy distribution produced by the scattering of a single electron on an isotropic field, i.e. . Therefore the results on PMN J0525-3433 are fully consistent with such a hypothesis 222Note that also the findings on RXJ1028.6-0844 (Yuan et al 2000) are consistent with a flattening of the spectrum rather than excess absorption.. In particular if Hz (rest frame), the break observed in the X–ray spectrum of this source would imply a cutoff in the particle distribution at a Lorentz factor a few.
The importance of such a finding would be two-fold. On one side constitutes a crucial parameter to determine the nature of the power and matter flowing in the jet, as it determines the total density of (relativistic) particles present in the flow (Celotti & Fabian 1993; Sikora & Madejski 2000). On the other side, a cutoff in the particle distribution implies, as the cooling timescales are extremely short, that an highly efficient re–acceleration process is operating at the same rate.
Problems arise also with this interpretation (see also Fiore et al 1998), as there is no evidence of intrinsic breaks in the X–ray spectra of nearby radio–loud quasars which would be well detectable if located at the corresponding intrinsic energy 8 keV. Indeed one might expect that in less powerful (nearby) objects, the density in the external radiation field would be lower and the cooling less dramatic and thus under these conditions the cooling break in the particle distribution would be located at even higher energies.
5.2.2 Sharply peaked soft photon distribution
An alternative scenario occurs if the seed photon distribution is peaked, or at least rapidly decreases below . If so, the distribution of the scattered photons (by the lowest energy electrons) would reproduce such a slope (e.g. Ghisellini 1996). As the scattering electrons are moving with Lorentz factor , in the observed frame the scattered radiation will appear boosted in frequency by a factor . Thus below a spectral decline will be observable. The sharpness of such a spectral break could be accounted for by the strong anisotropy of the scattered radiation (we see only photons within a small angle).
Clearly such a possibility is highly speculative given the lack of information on the nuclear soft photon field distribution. Note however, that if the electron distribution extends down to low energies, the location of the X-ray spectral break in PMN J0525-3343 would indicate the beaming Lorentz factor of the emitting plasma, which then must be , if Hz.
The main difficulty arising with scenarios attributing the flattening to intrinsic properties of the electron/soft seed photon distributions, is to convincingly account for the intriguing trend with of the soft X–ray spectrum of radio–loud objects which systematically flatten with redshift (Fiore et al 1998). An interesting possibility, within the external Compton scenario, is that by increasing the redshift (and luminosity) of the source, the ratio of external Compton (EC) to synchrotron self–Compton (SSC) increases. If so, in high power sources the EC strongly dominates the emission, and leads to the depression (extreme flattening of soft X–rays) in the spectrum, while in increasingly lower redshift (weaker) sources the SSC contributes to the soft-medium X–ray emissions, filling the spectral depression (e.g. Sikora et al 1994). Clearly such an increase in the external photon energy density could be associated both with the source power and with the nuclear conditions of quasars at higher .
6 Conclusions
We have studied the X-ray spectral properties of the high redshift radio–loud quasar PMN J0525-3343, by means of ROSAT, ASCA and SAX observations. We have found that the spectrum flattens at the lowest energies, indicating either a spectral flattening or a significant absorption in excess of the Galactic one. This finding is consistent with and extends the range in redshift of the systematic trend of increasing flattening with increasing redshift found previously for radio–loud sources. Several possibilities have been discussed.
The most plausible hypotheses include either an intrinsic flattening of the soft X–ray spectrum, originating from the shape of the energy distribution of particles and/or seed photons involved in the production of the Compton component, or the presence of warm absorbing gas in the nuclear region. If this is similar to the absorber found in local (Seyfert) objects, its distance from the central source would be of order cm. Evidence for CIV absorption in the spectrum supports the warm absorber hypothesis. The equivalent width of the absorption and value of for PMN J0525-3343 fall on the correlation of Brandt et al (2000; Figure 4). Indeed the objects neighbouring PMN J0525-3343 in that correlation are observed to have X-ray warm absorbers. The velocity difference between the CIV absorption and emission are unlikely, in an object at to be due to an intervening galaxy in a massive cluster of galaxies, since such clusters would not have then formed. Possibly the absorption line redshift is that of the quasar nucleus, and the broad emission line profiles have been altered by further, unresolved, absorption into peaking at a lower redshift.
In the former case, the column-redshift dependence could be accounted for by the decreasing contribution of synchrotron self–Compton emission at the softest energies due to an increasingly intense external photon field. In the latter, one might envisage an increase in the amount of nuclear gas and/or of ionizing radiation with . Interestingly, it has been suggested (e.g. Reeves & Turner 2000 and references therein) from the observed characteristics of the spectra of radio–quiet sources, that the key parameter regulating their spectral properties is the mass accretion rate in Eddington units: high luminosity sources would thus be characterized by an increasing ionization state of the reflecting disc and possibly of any nuclear absorber. A similar trend might be at the origin of the increasing photon density required by the above scenario in radio–loud objects.
Future observations with Chandra and XMM-Newton, and in the optical, will enable us to discriminate between the models for these sources.
Clearly, this issue needs more investigation, since it represents a potential means for understanding the conditions and evolution of the nuclear/galactic environment and the galaxy–quasar connection. In particular future X–ray observations with wide energy coverage and good spectral resolution as provided by a significant number of high redshift radio–loud objects, will allow us to a) establish the origin of the spectral flattening, determining the abundance and ionization state of any absorber and – if variability or clear features are detected – its spatial location and redshift/velocity and b) assess its evolutionary properties. Information from the optical–UV spectrum are also of prime importance, as the amount of (or limit on) the extinction can be directly compared to the X–ray one and any line absorption feature would determine the absorbing gas velocity, although photometry alone might not be sufficient to distinguish between the steep non–thermal continuum typical of blazars and a reddened quasar spectrum.
Acknowledgments
The VLA is operated by the National Radio Astronomy Observatory, which is a facility of the National Science Foundation operated under cooperative agreement by Associated Universities, Inc. CLC would like to thank G. Taylor for useful discussions. The Royal Society (ACF), the Italian MURST (AC) and the NASA LTSA grant NAG 5-8107 (WNB) are acknowledged for financial support.
References
- [1] Anderson S.F., Weymann R.J., Foltz C.B., Chaffee F.H. Jr., 1997, AJ, 94, 278
- [2] Boller Th., Fabian A.C., Brandt W.N., Freyberg M.J., 2000, MNRAS, 315, L23
- [3] Brandt W.N., Laor A., Wills B., 2000, ApJ, 528, 637
- [4] Cappi M., Matsuoka M., Comastri A., Brinkmann W., Elvis M., Palumbo G.G.C., Vignali C., 1997, ApJ, 478, 492
- [5] Carilli C.L., Rottgering H.A., van Ojik R., Miley G., van Breugel W., 1997, ApJS, 109, 1
- [6] Celotti A., Fabian A.C., 1993, MNRAS, 264, 228
- [7] Condon J.J., Cotton W.D., Greisen E.W., Yin Q.F., Perley R.A., Taylor G.B., Broderick J.J., 1998, AJ, 115, 1693
- [8] Elvis M., Lockman F.J., Fassnacht C, 1994, ApJS, 95, 413
- [9] Elvis M., Fiore F., Giommi P., Padovani P., 1998, ApJ, 492, 91
- [10] Fabian A.C., 1999, MNRAS, 308, L39
- [11] Fabian A.C., Brandt W.N., McMahon R.G., Hook I., 1997, MNRAS, 291, L5
- [12] Fabian A.C., Iwasawa K., Celotti A., Brandt W.N.., McMahon R.G., Hook I., 1998, MNRAS, 295, L25
- [13] Fabian A.C., Celotti A., Pooley G., Iwasawa K., Brandt W.N., McMahon R.G., Hoenig M.D., 1999, MNRAS, 308, L6
- [14] Fiore F., Elvis M., Giommi P., Padovani P., 1998, ApJ, 492, 79
- [15] Ghisellini G., 1996, Gamma-ray Emitting AGN, eds J. Kirk, C. von Montigny, S. Wagner, MPI H-V37, 77
- [16] Ghisellini G., Celotti A., Fossati G., Maraschi L., Comastri A., 1998, MNRAS, 301, 451
- [17] Guainazzi M., Matteuzzi A., 1997, SDC-TR-011
- [18] Hartmann R.C., et al, 1996, ApJ, 461, 698
- [19] Hook I., McMahon R.G., 1998, MNRAS, 294, L7
- [20] Lonsdale C.J., Barthel P.D., Miley G.K., 1993, ApJS, 87, 63
- [21] Moran E.C., Helfand D.J., 1997, ApJ, 484, L95
- [22] Reeves J.N., Turner M.J.L., 2000, MNRAS, in press (astro-ph/0003080)
- [23] Reynolds C.S., 1997, MNRAS, 286, 513
- [24] Salvati M., Maiolino R., 2000, in Large Scale Structure in the X-ray Universe, conference held in Santorini, Greece, September 1999 (astro-ph/0001332)
- [25] Shields J.C., Hamann F., 1997, Revista Mexicana de Astronomia y Astrofisica Serie de Conferencias, 1st Guillermo Haro Conference on Astrophysics: Starbursts Activity in Galaxies, 6, 221
- [26] Sikora M., Madejski G., 2000, 534, 109
- [27] Sikora M., Begelman M., Rees M.J., 1994, ApJ, 421, 153
- [28] Silk J., Rees M.J., 1998, A&A, 331, L1
- [29] Storrie-Lombardi L.J., McMahon R.G., Irwin M.J., Hazard C., 1996, ApJ, 468, 121
- [30] Tytler D., Fan X., 1992, ApJS, 79, 1
- [31] Wolter A., et al, 1998, A&A, 335, 899
- [32] Wright A., Griffith M.R., Hunt A.J., Troup E., Burke B.F., Ekers R.D., 1996, ApJS, 103, 145
- [33] Yaqoob T. and ASCA Team, 2000, ASCA GOF calibration memo, ASCA GOF web page at Goddard Space Flight Center
- [34] Yuan W., Matsuoka M., Wang T., Ueno S., Kubo H., Mihara T., 2000, ApJ, submitted (astro-ph/0006148)
- [35] Zickgraf F.-J., Voges W., Krautter J., Thiering I., Appenzeller I., Mujica R., Serrano A., 1997, A&A, 323, L21