An Extinction Map and Color Magnitude Diagram for the Globular Cluster NGC 3201
Abstract
Differential variations of up to mag on a scale of arcminutes across NGC 3201 are presented in the form of an extinction map. This map, created by calculating average values for stars in small subregions of the field with respect to a fiducial region, greatly improves the appearance of the CMD of the cluster. We describe how we implemented this technique in detail with our data for NGC 3201. A comparison between our map and that of the same region extracted from the COBE/DIRBE reddening maps published by Schlegel, Finkbeiner, & Davis (1998) (SFD) displays larger-scale similarities between the two maps as well as smaller-scale features which show up in our map but not in the SFD map. Several methods of determining an zeropoint to add to our differential extinction map are presented. Isochrone fitting proved to be the most successful one, but it produces an average for the cluster which is smaller than previously published values by . Finally, our results seem to support the statement by Arce & Goodman (1999) that the SFD maps overestimate the reddening in regions of high extinction.
Subject headings:
color-magnitude diagrams — dust, extinction — globular clusters: individual (NGC 3201) — methods: data analysis — stars: fundamental parameters1. Introduction
We are currently undertaking a survey of approximately 15 Galactic globular clusters (GCs) with the aim of identifying eclipsing binary stars around or below the turn-off-point by means of detecting brightness variations. These systems can provide masses for Population II main sequence stars. High-quality photometry is essential for obtaining reliable values for surface temperatures, luminosities, ages, etc. Precise extinction determinations are a critical part of obtaining these results from our photometry.
NGC 3201, by chance one of the first GCs we analyzed, is a low-latitude cluster located at and or and (Harris 1996) with a retrograde orbit around the center of the Milky Way. Its nearby location ( = 5.2 kpc) and low concentration ( = 1.31) (Harris 1996) make it an attractive target for photometric studies. Recent such studies include Cacciari (1984), Brewer et al. (1993), Côté et al. (1994), Covino & Ortolani (1997) (hereafter C&O), and Gonzalez & Wallerstein (1998) (hereafter GW).
Due to its low-latitude position, the effects of differential reddening across the face of NGC 3201 are quite substantial. The existence of variable extinction was noted in practically all earlier studies of this cluster. Cacciari (1984), for instance, finds an irregular reddening distribution with a variation of = 0.03 mag in addition to a mean value of = 0.21. GW report a range in of as much as 0.1 mag across NGC 3201. Using spectroscopic data for 18 giants in NGC 3201, GW correct for the color spread by modelling the reddening in as a plane in and .
Recently published dust infrared emission maps by Schlegel, Finkbeiner, & Davis (1998) (SFD hereafter) seem to indicate, however, that the dust distribution in the region of NGC 3201 is too clumpy to be fitted by a linear function in position, even on the scale of arcminutes (see Fig. 6).
In this work, we attempt to remove the differential reddening across the cluster by using our high-quality photometry. Our procedure is, in principle, similar to the one used by Piotto et al. (1999). It aims to find the average for subregions of the cluster field of approximately 1 arcmin2 in size with respect to a fiducial region in the cluster where little or no differential reddening is apparent and where the overall is small compared to the rest of the cluster. The pixel size (resolution) of this extinction map is approximately one fourth of the size (in area) of the SFD maps. Since the SFD maps are based on infrared emission from dust, our map will provide an independent check of whether, if at all, they tend to overestimate reddening, as was suggested by, e.g., Arce & Goodman (1999) for regions with mag.
Our results indicate variations in of up to 0.2 mag. Differential reddening this strong can wreak havoc with photometric and spectroscopic studies of cluster stars. The inherent uncertainties in the various parameters of the CMD (e.g., magnitude and color of the main-sequence turnoff (MSTO), horizontal branch features, etc.) are greatly amplified. Moreover, one may “detect” age or surface-temperature gradients where there are none in reality. To give an example of the magnitude of the effect, using the recently published color-temperature relations by Houdashelt, Bell, & Sweigart (2000), the effective temperature of a solar-metallicity, main sequence star with would vary by approximately 600 for a differential reddening effect of mag, which, in turn, could lead to errors in the metallicity determination.
Using our internal dereddening technique, we obtain a high-quality, deep-photometry CMD of NGC 3201 comprised of approximately ninety 600s exposures as well as some shorter ones, all using the and bands.
Our observations and data reductions, as well as the details about our internal dereddening method, are documented in Section 2. Section 3 contains our results concerning the reddening map and the CMD of NGC 3201. Finally, we discuss the determination of the reddening zeropoint of our extinction map in Section 4 and give a brief summary of our work in Section 5.
2. Observations, Data Reduction, and Internal Dereddening
2.1. Observations and Basic Data Reductions
The NGC 3201 observations were obtained during the nights of April 26 through May 6, 1998, at the Las-Campanas-Observatory (LCO) 1m Swope Telescope, using Johnson-Cousins filters and a SITe 1 CCD with a field-of-view of 23.5 arcmin on a side. Table 1 gives the number of epochs we observed for different exposure times which were chosen in order to cover a larger magnitude range in the CMD.
The initial processing of the raw CCD images was done with the routines in the IRAF111IRAF is distributed by the National Optical Astronomy Observatories, which are operated by the Association of Universities for Research in Astronomy, Inc., under cooperative agreement with the NSF. CCDPROC package. For each night, 10 bias frames were combined for the bias subtraction. The band flats were produced by combining between 4 and 6 twilight flat images per night. All band data were first flattened using an image comprised of 15 individual band domeflats, and then divided by a normalized, dome-flattened dark-sky-flat which itself was created by median-averaging approximately 40 individual different blank sky fields. Finally, the band images were corrected for fringing by subtracting a fringe image which was created by subtracting the mean pixel value of the dark-sky-flat from the dark-sky-flat image itself.
The processed data were reduced using DoPHOT (Schechter, Mateo, and Saha 1993) in “fixed-position mode” where the positions of stars are fixed (after correcting for global frame-to-frame shifts as well as small distortions) to the positions measured on a deep-photometry template image obtained by co-adding the 15 best-seeing frames.
The photometric results for every star were averaged over all frames with the same exposure time to obtain the final magnitude for the star under investigation. For the 600s exposures, our only requirement was that a star appear in more than 75% of the epochs. The 60s images were taken to complete the CMD in the brighter regions; we only took magnitudes from these exposures of stars which were saturated in the 600s exposures. The same procedure was followed for the 10s frames. Aperture corrections were applied by calculating one constant value for the whole chip after we found little dependence upon position on the CCD. The data from the shorter exposures were shifted to the photometric system of the 600s exposures using non-saturated stars in common.
During our consecutive two photometric nights (May 2 & 3, 1998), we obtained a total of more than 140 observations of various Landolt (1992) standard stars which covered a range of in color as well as in airmass. Using the IRAF PHOTCAL package, we applied one single standard star solution for data from both nights of the form
| (1) |
| (2) |
where the , , and are the fitted constants, is the airmass of the exposure taken with the respective filter, the lowercase magnitudes are instrumental, and the uppercase ones are the known magnitudes of the standard stars. The root mean square error was 0.007 mag and 0.016 mag for and , respectively
Astrometry was performed by identifying 59 USNO reference stars (Monet et al. 1996) in NGC 3201 and using the IRAF IMAGES package for the coordinate transformation. A linear fit in and produced errors around 0.2 arcsec, consistent with the USNO precision. The tangent point of the transformation was and corresponds to and . The rotation of and with respect to and was , and the pixel scale came out to be 0.695 pix/arcsec. These results enabled us to create the reference grid in Fig. 3.
2.2. Mapping the Differential Reddening
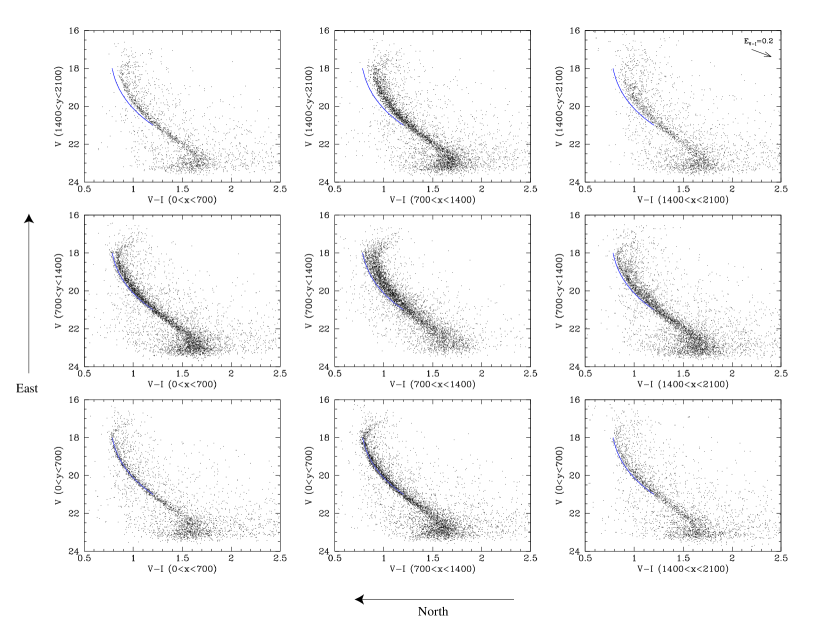
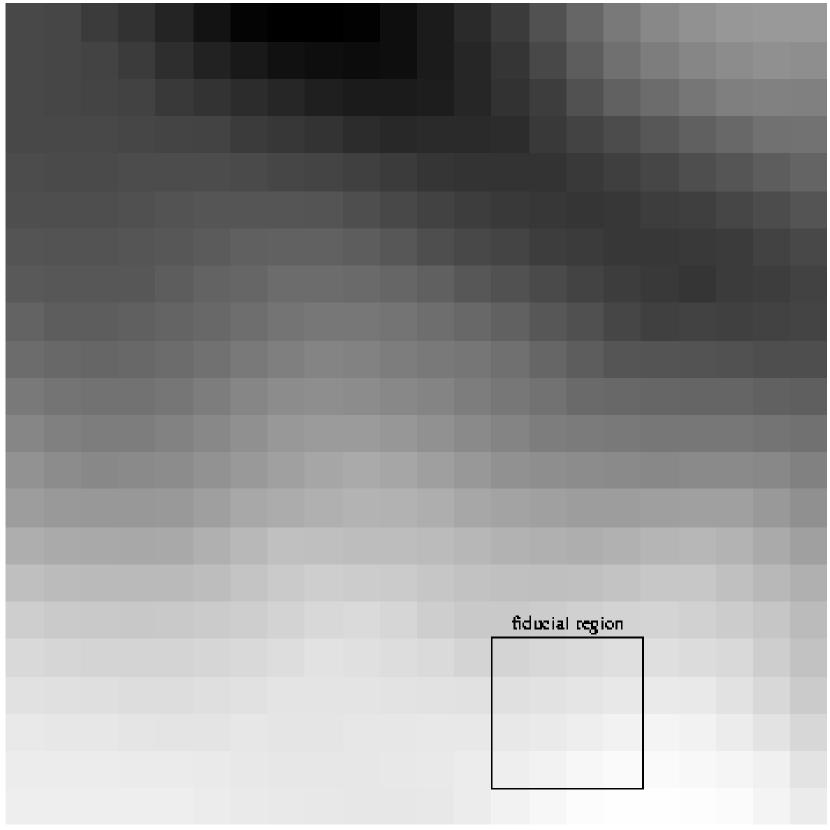
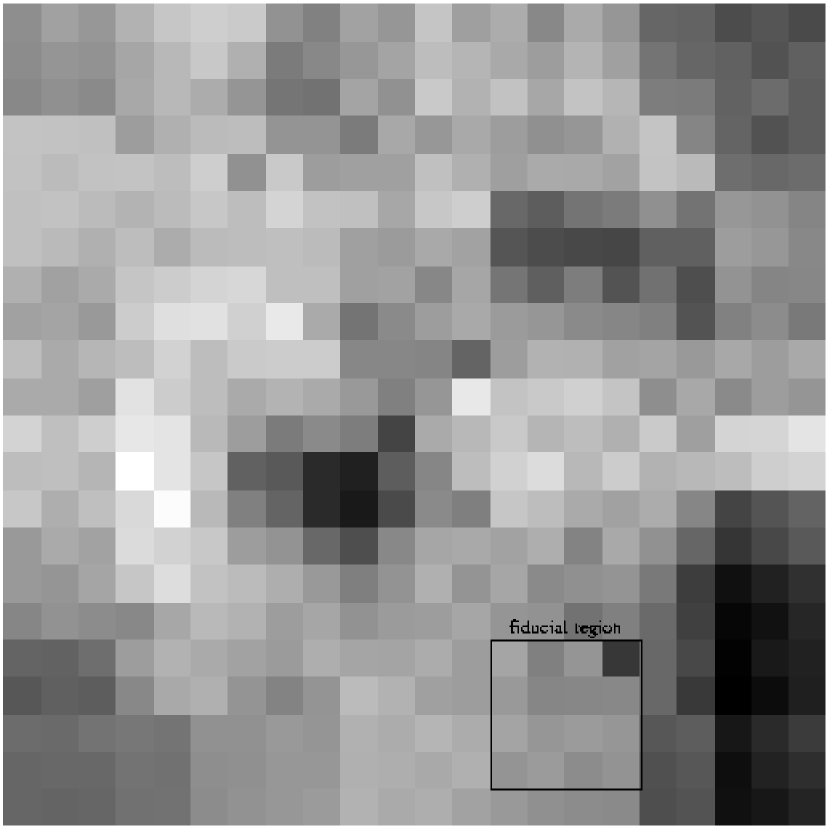
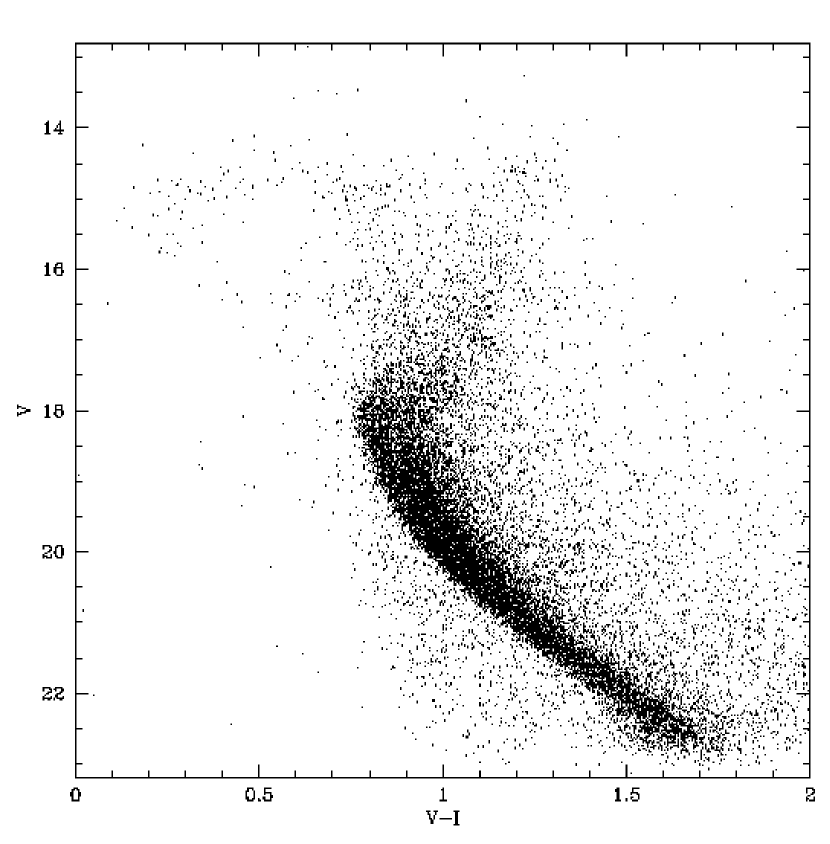
At this point in the data reduction we were in the possession of a fully calibrated CMD whose main sequence appeared exceptionally broad (see Fig. 8). After ruling out a number of possible instrumental causes for this effect, and after we noted a clear dependence of the appearance of the main sequence upon the positions of stars on the CCD (illustrated in Fig. 1), we concluded that the underlying cause for the broadness of our main sequence was differential extinction across the field of view. This seemed especially sensible given the low-latitude location of NGC 3201 and motivated us to create a reddening map since our binary star data were not useful without this correction. In order to create such a map for NGC 3201, we developed the steps described below (see also Fig. 2):
-
1.
A fiducial region was chosen in which
-
•
very little or no differential reddening occurred, i.e., where the main sequence appeared narrow;
-
•
the overall was very small with respect to the rest of the field of view;
-
•
there were enough stars in the field to obtain a statistically reliable fit to their positions on the CMD.
-
•
-
2.
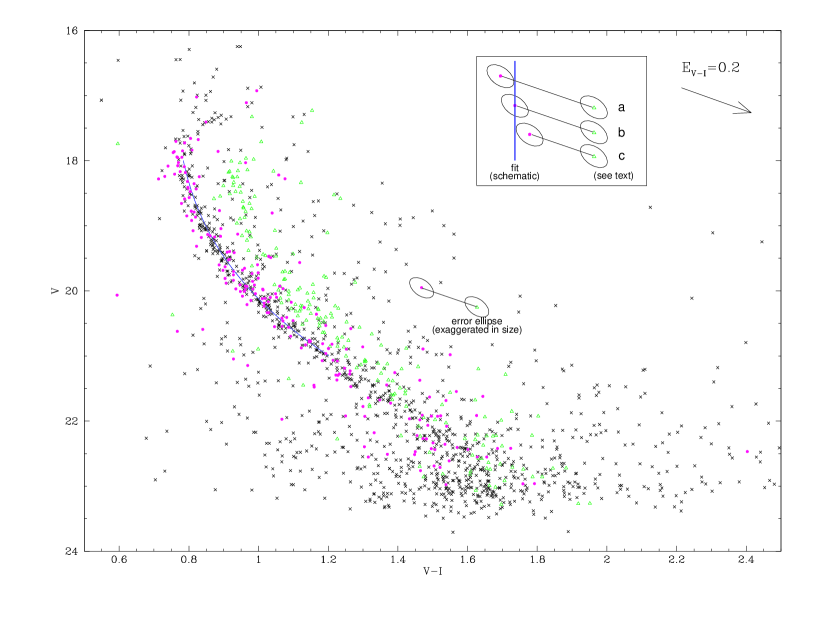
A high-order polynomial was fit to the main sequence stars with and in the fiducial region, using algorithms supplied by Robbie Dohm-Palmer (2000, private communication) which enabled us to separate the main sequence stars from background stars in the CMD, and by Press et al. (1992), which provided the least-squares fit to the data (see Fig. 2).
-
3.
We divided the field of view into subregions of different sizes in order to have a sufficient number of stars in each region. Towards the outer parts of the field, the stellar density decreases. As a result, the sizes of the subregions increase. The inner subregions are all of the same size (100100 pixel). See Fig. 3.
-
4.
For each of these regions, every star falling between and was incrementally moved along the reddening vector defined by the relations in Cardelli, Clayton, & Mathis (1989) until it intersected the fit (see Fig. 2).
-
5.
The statistical biweight (see Beers, Flynn, & Gebhardt 1990) of all these incremental shifts of the stars in a given subregion was then calculated, outliers (0.9 ) were removed, and it was recalculated. This provided the value of the total shift along the reddening vector for each star. Since the slope of the reddening vector for a standard extinction law is known (1.919; see Cardelli, Clayton, & Mathis (1989)), the differential for each star corresponds to the -component of the vector described above (Fig. 2).
-
6.
For six of the 100100 pixel subregions as well as one 200300 pixel subregion on the extinction map shown in Fig. 3, too few stars were present to calculate the average reddening. For these cases, we calculated by simply averaging the reddening values of all the neighboring subregions222In this process, every 100100 subregion was treated individually, even if it was a part of a larger one. That is, for the 200300 region just south of the north-east corner of the field of view in which the number of stars was too low to obtain a reddening value, the above procedure was applied six times..
-
7.
Our error analysis for the shifts described above involved the following:
-
•
We created an error ellipse for every star defined by the values of the associated errors (as returned by DoPHOT) in color and magnitude.
-
•
Since the color and magnitude errors are correlated, the error ellipse is tilted, with the tilt angle and the lengths of the semimajor and semiminor axes functions of and .
-
•
One average tilt angle was obtained for every subregion under investigation by averaging the results for the individual stars. For every subregion, this angle was approximately . The semimajor and semiminor axes for every subregion were obtained in the same way, so that every star in a given subregion has the same error ellipse associated with it in the center.
-
•
This error ellipse was shifted along with its respective star during the dereddening process described above in items 4 and 5. The “point of first contact” (pfc), i.e, the point at which the error ellipse first touches the fit through the data in the fiducial region, as well as the “point of last contact” (plc), represent the respective one-sigma-deviation points (see Fig. 2).
-
•
These two contact points are not necessarily symmetric about the reddening value of the star (center of error ellipse), but in order to increase the readability of this publication, we calculated the mean pfc and plc for a given subregion, and then their average distance from the center of the ellipse, so that .
-
•
The final error estimate for each subregion () given as the lower number in each of the pixels in Fig. 4 is then obtained by adding in quadrature and the error in the mean of the shifts of all the stars in the subregion under investigation.
-
•
3. Results
3.1. Extinction Map and Comparison with SFD Map
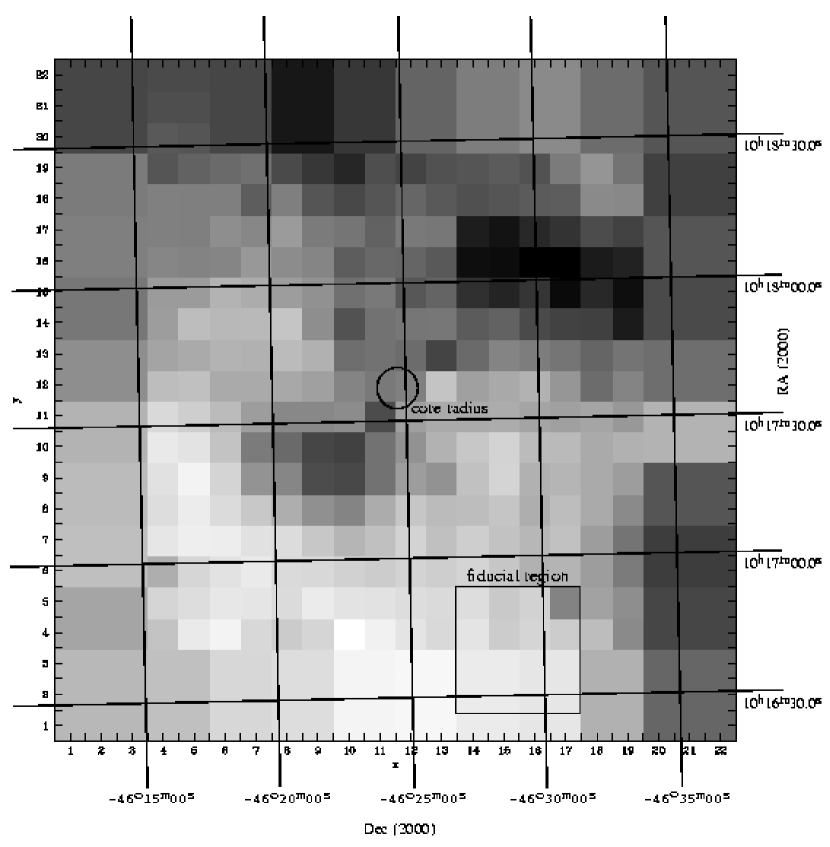
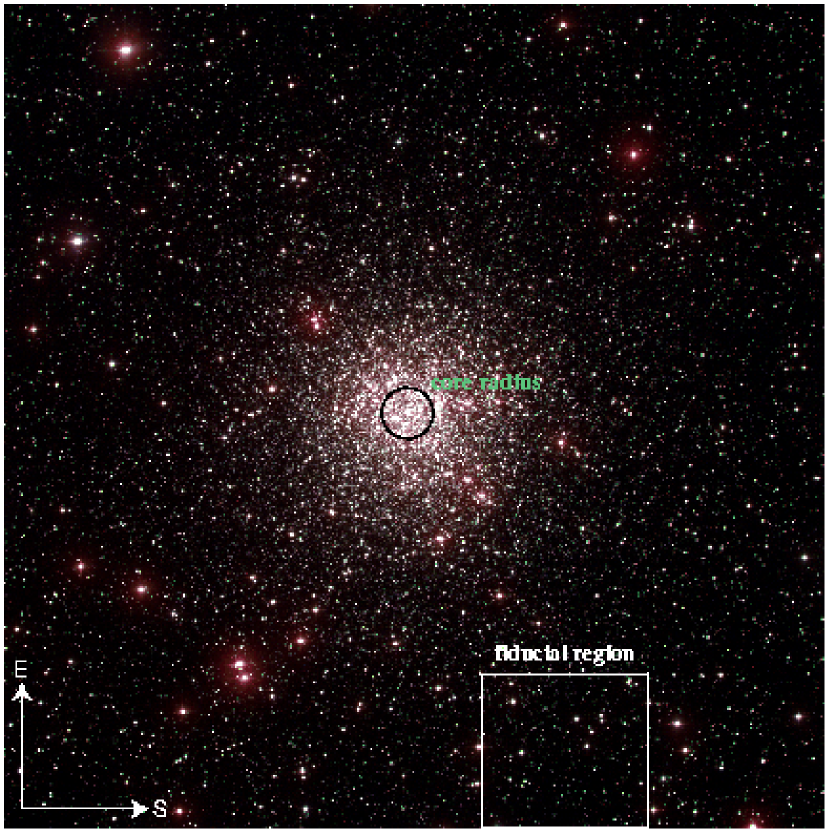
Fig. 3 summarizes the results of our internal dereddening procedure. Darker regions correspond to higher reddening with respect to the average reddening taking place in the fiducial region described in Section 2.2, item 1. For reference purposes, we included the approximate locations of this fiducial region and the core radius of NGC 3201, as well as a coordinate grid. The average relative to the fiducial region is 86 mmag with a standard deviation of 61 mmag. The individual subregions’ values in millimagnitudes (relative to the average reddening in the fiducial region) are shown as the top number in each of the pixels in the grid of Fig. 4. The bottom number in each pixel corresponds to the error in the mean for the corresponding value. In addition, we included an image of NGC 3201 (Fig. 5) in order to indicate the locations of the fiducial region and the core radius of the globular cluster.
At this point, these reddening values are all relative to our fiducial region which itself is suffering some mean interstellar extinction. The procedure described cannot determine the absolute reddening zeropoint. Thus, we had to introduce additional information, derived from previous studies, in order to calculate this zeropoint. The discussion of this process is given in Section 4.1.
As a first step, we subtracted our extinction map from the SFD map of the region of NGC 3201 which we observed. The SFD map of the cluster region is shown in Fig. 6 with the same orientation and size as Fig. 3. Once again, dark corresponds to higher extinction. We added the location of the fiducial region for reference. The average of the SFD map is 487 mmag with a standard deviation of 59 mmag.
A first comparison indicates that, while the larger-scale structure is the same for both extinction maps (in particular the obscuration ridge extending from the top left part of the image to the right center part of it), our map shows smaller-scale features which are not present in the SFD maps. These features are visible in the difference image in Fig. 7 whose orientation and size is once again identical to the other Figures. Darker regions correspond to places where our data indicate the presence of dust which does not show up in the SFD map; lighter regions show good agreement between the two maps. The average of this difference map is 401 mmag with a standard deviation of 46 mmag (significantly smaller than the standard deviation of both our extinction map and the SFD map). This lower standard deviation is an indication that both our map and the SFD map of the region of NGC 3201 are tracing many of the same features in the foreground extinction along the line of sight to the globular cluster.
The smaller-scale features present in only our map but absent in the SFD map are certainly worth further attention. At this point, we are not entirely confident that we can give a definite reason for the discrepancies, but some potential reasons could be the following:
-
•
The smaller-scale features which are not in the SFD maps might have been smoothed out by the lower resolution of the IR observations used to create the maps.
-
•
The temperature of the dust producing the smaller-scale features was outside the detection range of the instrument used to collect the data for the SFD maps. This way, they would still show up in our analysis.
-
•
The dust we are seeing is actually part of the globular cluster itself333The phenomenon of dust inside globular clusters was discussed by, e.g., Forte et al. (1992). and was therefore not picked up in the SFD maps.
3.2. Photometry and CMD
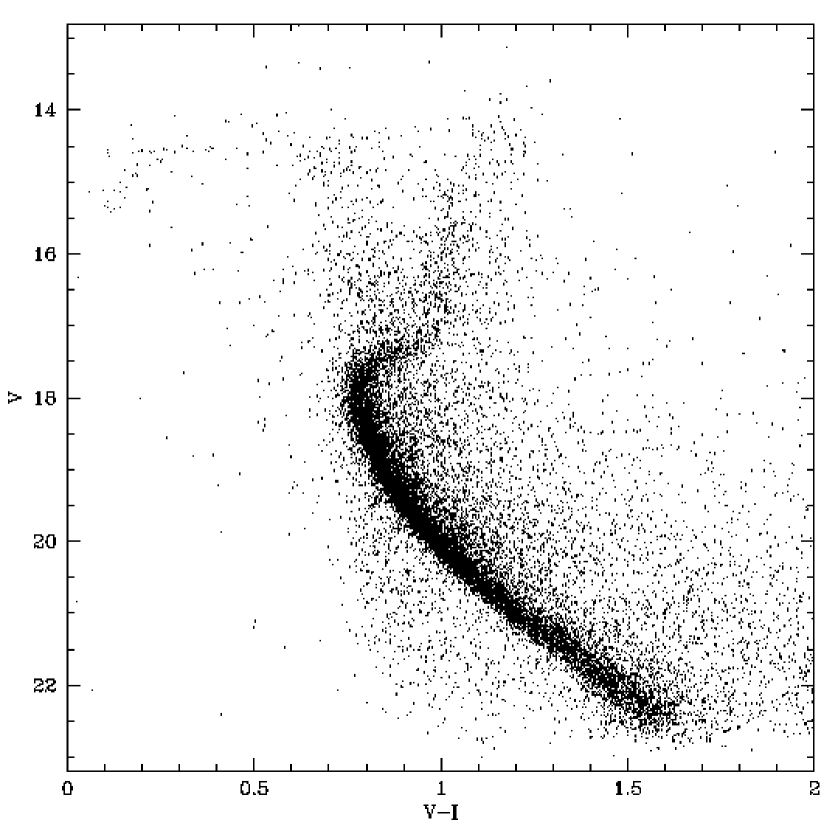
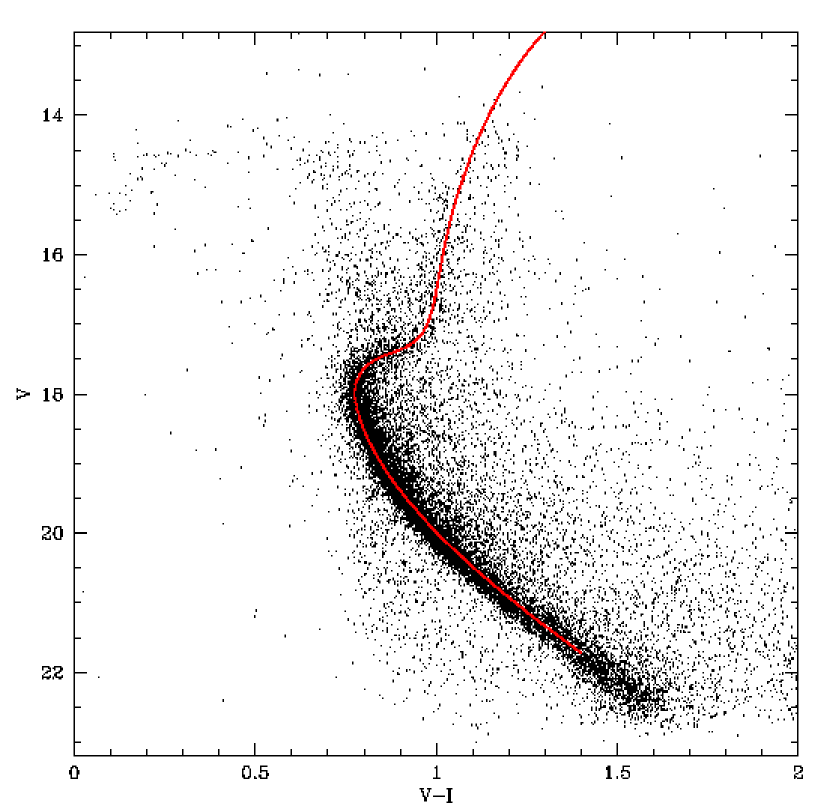
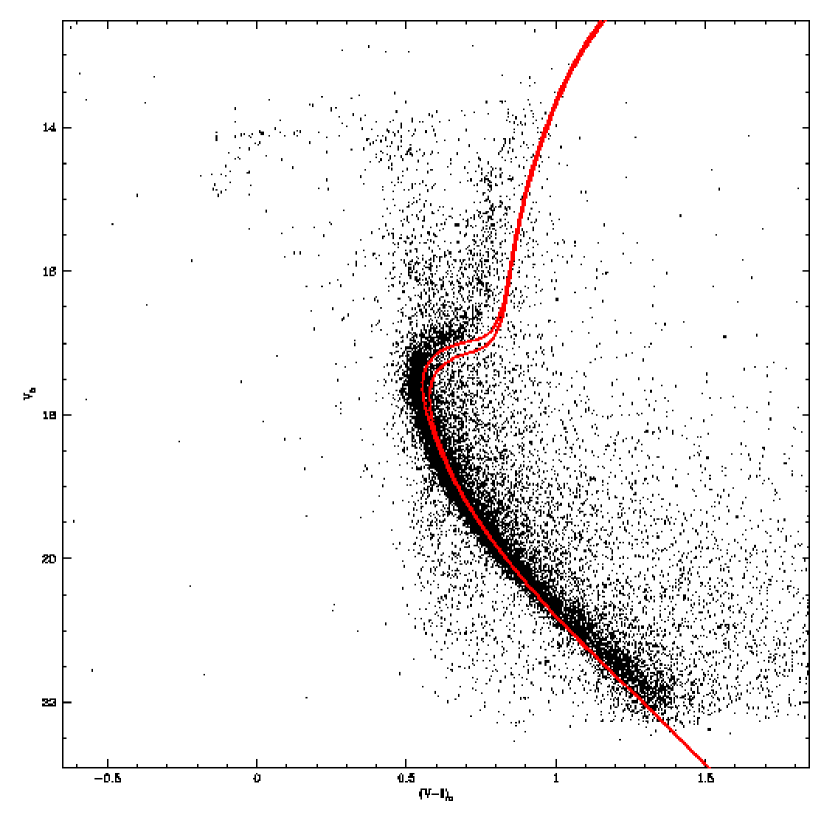
Fig. 8 contains the raw CMD (no dereddening applied) for NGC 3201. To illustrate the effects of our dereddening method, we show, in Fig. 9, the CMD after applying the extinction map (differential reddening correction) to the data. The datapoints are now all shifted to the CMD-location of the stars in the fiducial region, that is, no absolute reddening zeropoint has been applied. The improvement is quite stunning. The width of the main sequence of Fig. 9 has, by applying the differential reddening map, decreased to a fraction of its former value in Fig. 8. The subgiant branch which was hardly visible at all in the raw CMD is now well traced out by the datapoints. Even the horizontal branch, though sparsely populated in both CMDs due to saturation effects of the bright stars in the field, is narrower in the differentially dereddened CMD.
4. The Reddening Zeropoint of our Extinction Map for NGC 3201
4.1. Comparing the MSTO Color with Previous Studies
In order to make our reddening map (Fig. 4) a useful tool, we need to determine the reddening zeropoint to add to the values in the grid. As mentioned above, this could not be done using our data alone. In order to be able to use results from previous studies for the calculation of this zeropoint, an agreement between our photometry results and the corresponding literature values is necessary. When comparing MSTO color, however, one needs to consider that different parts of the field of view are reddened by different amounts, as we showed in our extinction map (Fig. 3).
We estimated our main-sequence turnoff magnitude to be 18.2 and the MSTO color to be around 0.88 mag; both were determined by eye from the raw photometry CMD (Fig. 8).
These values were compared to the results of Rosenberg et al. (2000) (hereafter RB) and C&O. RB find and ; both values are again determined by eye. C&O report and (tabulated). Using their reddening estimate of , the relations in Cardelli, Clayton, & Mathis (1989), and a set of isochrones provided by Don VandenBerg for (VandenBerg 2000, private communication, based on evolutionary models by VandenBerg et al. 2000; hereafter VDB), the C&O value for can be calculated to be approximately 0.93.
One discrepancy between our results and these literature values is therefore that our value for is approximately 0.05 mag bluer than what is quoted by the authors mentioned above. The existence of variable reddening may be a likely explanation for this discrepancy, especially when one considers which part of the cluster was observed.
RB concentrate on the southern and eastern parts of the cluster for their longer exposures and the center of NGC 3201 for their shorter exposures. All of these three regions are, according to our reddening map (Fig. 3), regions of higher extinction with respect to our fiducial region.
C&O observe regions just to the north and west of the cluster center and the cluster center itself. While the north and west regions suffer only low reddening (Fig. 3), the area within 7 arcmin to the north and west of the cluster center is obscured by a smaller feature not visible in the SFD map (see Fig. 6). At least 5 of 7 C&O fields are very likely affected by this dense obscuration feature.
While a quantitative (star-by-star) magnitude comparison between our data and the data obtained by RB and C&O is not possible, we conclude that their estimates for the MSTO color could very well be influenced by the fact that the regions they observed were subject to extinction somewhat higher than the average value over our field of view.
We note that these comparisons focus on the MSTO colors; the vertical nature of the MSTO makes it difficult to compare the mag of the MSTO at sufficiently high precision.
4.2. Basic Isochrone Fitting and Determination of Reddening Zeropoint
We examined three different possibilities of finding the zeropoint to add to our extinction map. All three methods are outlined below. For each case, it is worth pointing out that a direct comparison with literature values should be taken with caution since usually, only a single numerical value for the reddening is given, whereas our result is a reddening matrix of which every single element needs to be added to a zeropoint offset.
4.2.1 Using Isochrone Fits
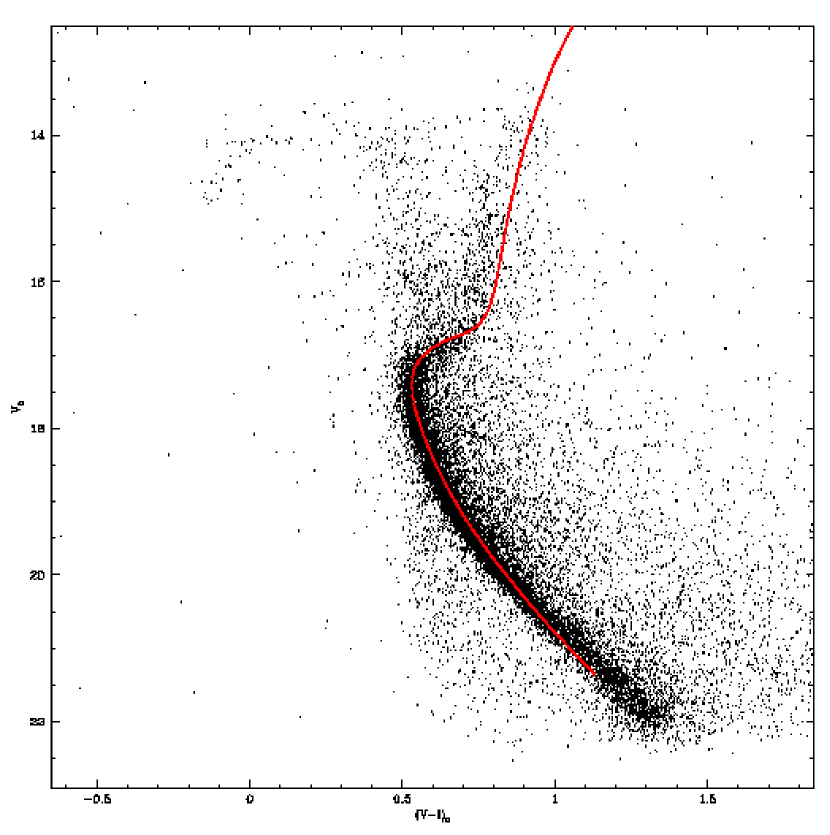
Simultaneously fitting age, distance, and reddening to the aforementioned set of VDB isochrones produced the fit shown in Fig. 10. It should be noted that since the point of this publication is outlining our dereddening method as well as creating an extinction map for NGC 3201, we only performed some basic isochrone fitting here. For an estimate of , we adopted the isochrone with metallicity closest to the GW value of -1.42.
For the fit of Fig. 10, , kpc, age = 18 Gyrs, and the zeropoint to be added to the values in Fig. 4 is 0.15 mag. The age is clearly on the high end of things, but the 18 Gyr isochrones produced by far the best fits, even when and the distance were slightly modified. The value for the distance is slightly below the one quoted by Harris (1996), but fairly close to the two values derived using slightly different methods by C&O.
When adding the mean of our reddening map (86 mmag) to the zeropoint, the average for the cluster is approximately 0.24, which is slightly below the estimates of, e.g., Cacciari (1984) whose , and of Harris (1996) and RB who quote the same value.
In order to justify our choice of isochrone parameters and to eliminate the possibility of multiple factors conspiring against us in the attempt to find a good isochrone fit to the data, we illustrate in Fig. 11 what the CMD would look like if we were to strictly adopt literature values from Harris (1996) (, , d = 5.2 kpc). Plotted are a pair of isochrones with respective ages 12 and 14 Gyrs on top of the data444In order to have a valid basis for comparison, we needed to apply an zeropoint of to the differentially dereddened data, where 0.325 is the Harris (1996) value and 0.086 is the mean value of our extinction map.. The agreement between data and fit is not as good as in Fig. 10.
4.2.2 Using SFD Maps
As stated in Section 3.1, the mean of the difference map between the SFD and our data is mmag. The average value for this difference map corresponds to the zeropoint to add to our data to obtain absolute reddening values.
Calculating the total reddening in this fashion gives which is significantly higher than the literature values. Furthermore, using the isochrones mentioned in the previous subsection, we were not able to produce a fit to the data due to the fact that was too high.
4.2.3 Using RRLyrae Stars
Another method of attempting to find a reddening zeropoint is to simply adopt one from the literature and model the thus dereddened data with a set of isochrones. Here, we took Cacciari’s (1984) value of which she calculated using RRLyrae stars. Since this corresponds to the average reddening for the whole cluster, we had to subtract the mean of her RRLyrae stars (in our field of view) with respect to our fiducial region. This value turned out to be 79 mmag.
We failed, however, to find a good isochrone fit to the thus dereddened data, as is shown in Fig. 12. In order to get the MSTO points of the data and the isochrone to agree, we had to lower to -2.01, a value quite a bit below literature values such as -1.41 (GW) or -1.58 (Harris 1996). The distance modulus here is 13.4, and the age 14 Gyrs. As one can easily see, the fit fails to hit the subgiant branch due to the “young” isochrone age of 14 Gyrs. Older age isochrones could not be shifted far enough toward the dereddened MSTO location to produce a fit, even when the metallicity was lowered to the lowest available value of -2.31.
4.2.4 Comments on the Adopted Reddening Zeropoint
Given that we were not able to produce a fit to the data using the VDB isochrones when we calculated the reddening zeropoint using either the SFD maps or the Cacciari (1984) RRLyrae stars, we conclude that our best estimate for the zeropoint is 0.15 mag, giving an average for the cluster as a whole. This value falls approximately below the estimate by Cacciari (1984) and the value tabulated by Harris (1996).
We could force our reddening zeropoint to agree with these past results by applying a systematic shift to our magnitudes of 0.08 to brighter values which would give a distance to NGC 3201 of 4.8 kpc. We have, however, no reason to adopt such a shift. The transformations to standard magnitudes as well as the application of the aperture corrections (see Section 2.1) underwent repeated thorough examinations and appear to be correct. Since no other indication throughout our data reduction and analysis suggests a systematic error in the band magnitudes, either, we simply cannot justify adjusting our magnitudes in order to compensate for the effect described above.
5. Summary and Concluding Remarks
In the process of finding eclipsing binary stars in NGC 3201, we noticed the existence of variable reddening of up to 0.2 mag in on a scale of arcminutes. Using our internal dereddening method outlined in Section 2.2, we created an extinction map which is shown in Figures 3 and 4. Applying the map to our raw data (Fig. 8) significantly improved the appearance of the CMD (Fig. 9).
Comparison between our extinction map and the SFD map of the same region (Fig. 6) showed that the same larger-scale features exist in both maps. Our map displays some additional, smaller-scale features which are absent in the SFD maps (see Fig. 7).
The zeropoint which needs to be added to the numbers in Fig. 4 in order to get absolute values is 0.15. This value is below literature results (Cacciari 1984, Harris 1996) by approximately , but produced by far the best VDB isochrone fit to the data. The zeropoint determined with the help of the SFD maps gives as the average value across NGC 3201 which is higher than literature values which supports the statement by Arce & Goodman (1999) that the SFD maps overestimate the reddening in regions of high extinction.
The results from this work will be essential in our binary star research where high-quality photometry of every binary system is necessary for distance determinations. A vital condition to obtaining these measurements is of course the knowledge of the exact extinction the star under investigation is suffering.
Furthermore, studies like this may be useful in determining properties of the ISM itself such as examining a possible dependence of upon position in the field of view or giving insight into the distribution and properties of the dust along the line of sight.
References
- (1)
- (2) Arce, H., and Goodman, A. 1999, ApJ, 512, L135
- (3) Beers, T. C., Flynn, K., and Gebhardt, K. 1990, AJ, 100, 32
- (4) Brewer, J. P., Fahlman, G. G., Richer, H. B., Searle, L., & Thompson, I. 1993, AJ, 105, 2158
- (5) Cacciari, C. 1984, AJ, 89, 231
- (6) Cardelli, J. A., Clayton, G. C., and Mathis, J. S. 1989, ApJ, 345, 245
- (7) Côté, P., Welch, D. L., Fischer, P., da Costa, G. S., Tamblyn, P., Seitzer, P., and Irwin, M. J. 1994, ApJS, 90, 83
- (8) Covino, S., and Ortolani, S. 1997, A&A, 318, 40
- (9) Forte, J. C., Cellone, S. A., Méndez, M., and Vega, E. I. 1992, ApJ, 388, 383
- (10) Gonzalez, G., and Wallerstein, G. 1998, AJ, 116, 765
- (11) Harris, W. E. 1996, AJ, 112, 1487
- (12) Houdashelt, M. L., Bell, R. A., and Sweigart, A. V. 2000, AJ, 119, 1448
- (13) Landolt, A. 1992, AJ, 104, 340
- (14) Monet, D., Bird, A., Canzian, B., Harris, H., Reid, N., Rhodes, A., Sell, S., Ables, H., Dahn, C., Guetter, H., Henden, A., Leggett, S., Levison, H., Luginbuhl, C., Martini, J., Monet, A., Pier, J., Riepe, B., Stone, R., Vrba, F., Walker, R. 1996, USNO-SA2.0, (U.S. Naval Observatory, Washington DC).
- (15) Piotto, G., Zoccali, M., King, I. R., Djorgosvki, S. G., Sosin, C., Rich, R. M., and Meylan, G. 1999, AJ118, 1727
- (16) Press, W., Teukolsky, S., Vetterling, W., Flannery, B. 1992, Numerical Recipes, 2nd Edition (Cambridge University Press)
- (17) Rosenberg, A., Piotto, G., Saviane, I., and Aparicio, A. 2000, A&AS, 144, 5
- (18) Schechter, P. L., Mateo, M., and Saha, A. 1993, PASP, 105, 1342
- (19) Schlegel, D. J., Finkbeiner, D. P., and Davis, M. 1998, ApJ, 500, 525
- (20) VandenBerg, D., Swenson, F., Rogers, F. J., Iglesias, C. A., and Alexander, D. R. 2000, ApJ, 532, 430
- (21)