Chandra imaging of the X-ray core of Abell 1795
Abstract
We report the discovery of a 40 arcsec long X-ray filament in the core of the cluster of galaxies A 1795. The feature coincides with an HNII filament found by Cowie et al in the early 1980s and resolved into at least 2 U-band filaments by McNamara et al in the mid 1990s. The (emission-weighted) temperature of the X-ray emitting gas along the filament is , as revealed by X-ray colour ratios. The deprojected temperature will be less. A detailed temperature map of the core of the cluster presented. The cD galaxy at the head of the filament is probably moving through or oscillating in the cluster core. The radiative cooling time of the X-ray emitting gas in the filament is about which is similar to the age of the filament obtained from its length and velocity. This suggests that the filament is produced by cooling of the gas from the intracluster medium. The filament, much of which is well separated from the body of the cD galaxy and its radio source, is potentially of great importance in helping to understand the energy and ionization source of the optical nebulosity common in cooling flows.
keywords:
galaxies: clusters: individual: A1795 – cooling flows – X-rays: galaxies1 Introduction
The rich cluster Abell 1795, at redshift , has been well-studied at optical, radio and X-ray wavelengths. It shows a relaxed X-ray structure (Buote & Tsai 1996) with a strong central peak of cooler gas (Fabian et al 1994; Briel & Henry 1996; Allen & Fabian 1997; Ikebe et al 1999; Allen et al 1999). This is good evidence for a cooling flow (Fabian 1994) which is supported by the presence of strong emission-line nebulosity around the central cD galaxy (Cowie et al 1983; van Breugel, Heckman & Miley 1984; Hu, Cowie & Wang 1985; Heckman et al 1989) accompanied by excess blue light (Johnstone, Fabian & Nulsen 1987; Smith et al 1997; Cardiel, Gorgas & Aragon-Salamanca 1998). The blue light is probably due to massive stars (McNamara et al 1996a), with some from young globular clusters (Holtzman et al 1996). Molecular gas in the cD has been detected through molecular hydrogen emission (Falcke et al 1998). The small central radio source 4C 26.42 shows high Faraday rotation measures (Ge & Owen 1993) which is also a characteristic of a cooling flow (Taylor et al 1991, 1999). The radio source may have triggered some of the star formation in the cD (McNamara et al 1996b).
Hill et al (1988) reported that the cD in A1795 is not at rest in the gravitational potential of the cluster but has a peculiar radial velocity of . This was supported by the outer emission-line nebulosity having a blueshift relative to the cD galaxy. Oegerle & Hill (1994) later revised the velocity, and the significance of the effect, down to about , and argue that a subcluster has merged with the cluster.
Here, we present for the first time Chandra X-ray images of the core of A 1795. The high spatial resolution of Chandra allows us to see an 80 kpc long filament of X-ray emission extending SSE from the central galaxy. This filament coincides with a an H emission feature discovered by Cowie et al (1983). We discuss possible causes for such a striking feature.
2 The Chandra observations
Chandra (Weisskopf et al 2000) observed A 1795 for 19,594 s on 1999 December 20 and for 19421 s on 2000 March 21. The central galaxy was centred 3 arcmin from the edge of the ACIS-S CCD chip, yielding good cosmetic quality and sensitivity from about 0.3 – 7 keV. Detailed spectral studies of the cluster will be reported elsewhere (Ettori et al 2000, in preparation). We report here on the X-ray structure of the cluster core and present simple X-ray colour maps.
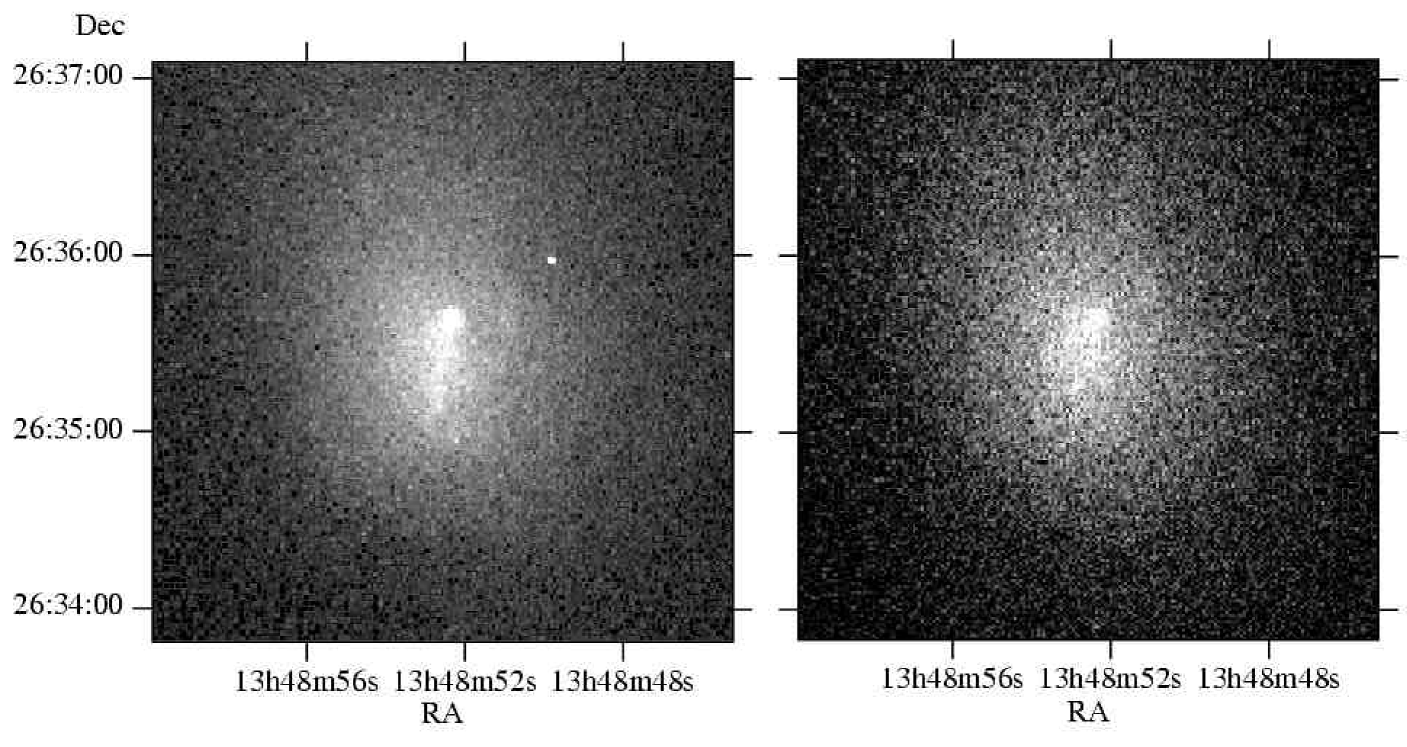
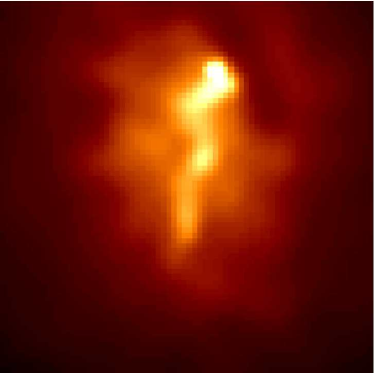
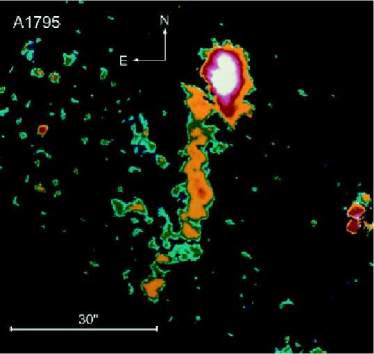
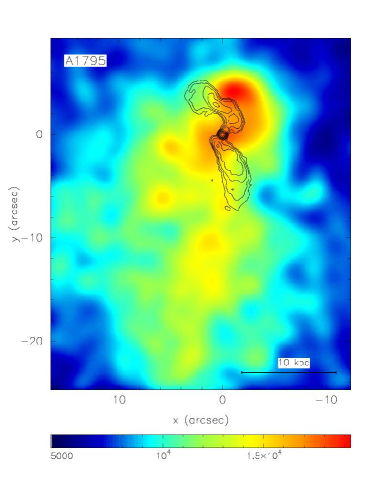
X-ray images of the cluster in the 0.3–1.5 and 1.5–7 keV bands are shown in Fig. 1. A linear structure running N-S is apparent in the soft image, but not in the hard one. An adaptively smoothed (Ebeling, White & Rangarajan 1999) X-ray image is shown in Fig. 2 together with a copy of the HNII image of Cowie et al (1983) at approximately the same scale. The cD galaxy lies at the top of the filament seen in both X-rays and HNII.
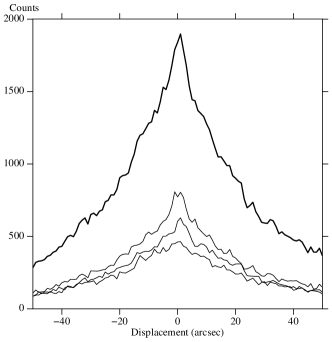
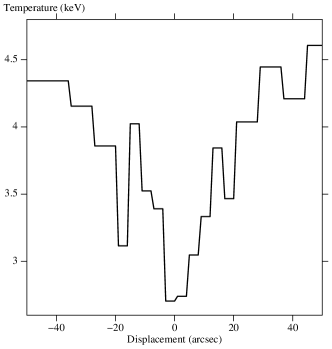
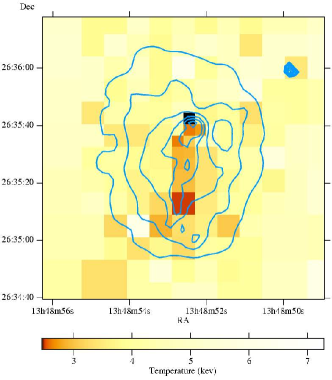
The X-ray profiles across the filament, in three energy bands (0.3–0.8, 0.8–1.5 and 1.5–7 keV), are shown in Fig. 3. The bins are arcsec, with the long axis parallel to the filament. These have then been adaptively binned and converted to colour ratios which have been compared with colours predicted by MEKAL thermal models (as discussed for the Perseus cluster by Fabian et al 2000). The bin size is varied across the image to preserve the same signal-to-noise ratio in all bins (Sanders & Fabian, in preparation). This procedure has yielded the temperature profile across the filament in Fig. 3 and the temperature map of Fig. 4. The temperature map shows the profile along the filament and indicates that the pixel at the Southern end of the filament is cooler () than the remainder of the filament to the North (which is at about ). The coolest spot on the map coincides with the cD galaxy position where the temperature is . Note that these are emission-weighted, line-of-sight, temperatures. As shown in Fig. 3, the filament itself may only give about one third of the counts at that position, the rest being projected into that position from the surrounding gas. The true emission-weighted temperature of the filament is likely to be lower than the values quoted above, probably by about 1 keV.
Approximate electron densities have also been determined by assuming that the pathlength through the emitting gas equals the radius. The radiative cooling time is less than 5 Gyr within the inner arcmin radius and about along the filament and on the cD galaxy. We also find evidence from the colour maps for excess X-ray absorption at the position of the filament and cD from the colour profile analysis.
3 Optical and radio comparison
The X-ray filament coincides with an H filament detected nearly two decades ago (Fig. 2). There are no obvious galaxies which can be responsible for this feature. McNamara et al (1996a) show -band images of this region in which the filament is well-detected and indeed resolved into at least two separate filaments. It is at a level which, they claim, probably requires continuum emission (e.g. stars) in addition to line emission.
The radio source extends about 5 arcsec to the north of the nucleus, and has a similar extension to the south. Its orientation is shown in Fig. 5. In Fig. 2 we can just see faint depressions in the X-ray emission to the N and W of the present radio source. These may perhaps be buoyant older radio lobes, as seen in the Perseus cluster (Fabian et al 2000) The X-ray emission from the cD galaxy is seen as a curved structure brightest at the North, about 5 arcsec from the nucleus (Fig. 5). This morphology closely resembles that of the HNII emission there (see Fig. 6 of van Breugel et al 1984). There is also a dust lane associated with the optically-bright regions (Pinkney et al 1996; McNamara et al 1996b).
The polarized intensity of the radio emission is anticorrelated with the optical line emission, presumably due to substantial Faraday rotation within the line emitting gas (Ge & Owen 1993). This requires the line-emitting gas to be in front of the radio source. The correlation between the optical line and X-ray emission in the cD indicates that the X-ray gas also lies in front.
4 Discussion
The Chandra images confirm the short cooling time of the gas in the centre of A1795 and also that the gas is cooler toward the centre. The shortest cooling time is about close to the cD galaxy and along the brightest part of the filament. These results are consistent with the presence of a strong cooling flow in the cluster core.
We have discovered a filament of X-ray emission coincident with the H filament of Cowie et al (1983). The X-ray luminosity of the filament, assuming a width of 5 arcsec and length of 40 arcsec (corresponding to a projected length of about 80 kpc, assuming ), is about . This is only about an order of magnitude greater than the HNII luminosity of the filament. This last luminosity probably converts to a bolometric line luminosity comparable to (or possibly greater than) the X-ray luminosity when all optical and UV emission lines are taken into account. If there is no heating balancing cooling then the mass cooling rate in the filament alone is about . The X-ray brightest region in the cD galaxy also coincides with the HNII brightest region there.
The age of the filament given its projected length and radial velocity of corresponds to yr, if it is at an angle of 45 deg to the line of sight. The timescale is of course less if the filament lies closer to the plane of the Sky. This raises the possibility that its length is constrained by cooling. We have found (Fig. 4) that the coolest part of the X-ray filament is near the end opposite to the cD galaxy. The straightness of the filament argues against the intracluster medium being very turbulent.
We note that the radial velocity of the cD relative to the velocity dispersion of the cluster (, Oegerle & Hill 1994) is small. This suggests that if the angle of its motion to the line of sight is low then the cD must be very close to the turnaround point in its orbit. An approximate estimate for the difference between the position of the cD, , from the turnaround radius of its (radial) orbit, , assuming that the core is of constant density out to radius is given by If the angle is large (close to the plane of the Sky) then the restriction is much less and the true velocity much higher.
Although the filament is clear in both the X-ray and HNII images the brightness variations along it do not compare well. The brightest part of the HNII filament about 25 arcsec S of the centre of the cD galaxy corresponds to a minimum in the X-ray surface brightness. The reverse is true of the X-ray bright part almost 20 arcsec from the cD. There is also little evidence in the X-ray image for the SE pointing tail to the filaments seen in HNII and the -band.
We note that the centroid of the outer X-ray emission (Fig. 4) lies not on the cD but partway (10–20 arcsec S of the cD) along the filament. This suggests that the cD is oscillating about the cluster core. There is no strong evidence from the X-ray surface brightness for a deep cusp at the cluster centre as determined from the outer emission. This argues against any static dark matter cusp at the cluster centre. The lack of any extensive ( arcsec) peak around the cD also argues against any deep dark matter well associated with the massive cD halo seen in the cluster (Johnstone, Naylor & Fabian 1991) from moving directly with the cD itself.
There are several possible explanations for the filament. Detailed modelling is beyond the scope of this Letter. It may a) be a cooling wake, produced by a cooling flow occurring around a moving galaxy (e.g. NGC5044; David et al 1994), b) a contrail produced by the ram pressure of the radio source passing through a multiphase medium, c) evaporation of cold gas ram-pressure stripped from the cD, or d) an accretion wake (Sakelliou, Merrifield & McHardy 1996).
This last possibility, d), requires that the gas be focussed by the gravitational effect of the cD and then cool into a wake. Since the likely space velocity and the velocity dispersion of the cD are both at least a factor of two smaller than the sound speed of the hot gas it is unlikely that gravitational focussing of the hot gas alone is responisble. The evaporation scenario c) requires that there was more than of gas (the hot gas mass of the filament) within the cD to be stripped out. It is not clear that it would be pulled out into such a straight, even filament (the ram-pressure-stripped wake behind the elliptical galaxy M86 in the Virgo cluster, Forman et al 1979, is very broad). Note that it is most unlikely that there is, or has been, any significant () hot interstellar medium intrinsic to the cD galaxy. The radiative cooling time of any 1 keV component in the galaxy would be only or less and it is replenished from stellar mass loss at only a few (Takeda, Nulsen & Fabian 1984). The cool gas at the position of the cD is then due to a combination of stellar mass loss and inflow from the intracluster medium.
We cannot rule out the contrail, b), but it is likely that the passage of the galaxy would heat gas rather than lead to it cooling. The simplest explanation is a cooling wake, a). The basic picture then is that the hot gas is in almost hydrostatic equilibrium in the cluster core potential, and cooling radiatively very slowly and steadily. The gas with a cooling time exceeding only senses the mean gravitational field of the cD, which then averages to a line along its direction of motion. Gas with shorter cooling time cools onto that line as the cD passes. Basically the mass of the cD serves to focus the inner part of the cooling flow, which is probably multiphase. Cooling will limit the length of the wake, in accord with the coolest X-ray gas being observed to be most distant from the cD. Of course, if the cD is also oscillating about the cluster dark matter centre then the filament length will not exceed the oscillation length.
The emission-line velocity map presented by Hu et al (1985) shows that most of the filament has the velocity of the cluster (i.e. blueshifted from the velocity of the cD; the cD is redshifted relative to the cluster by the same amount, Oegerle & Hill 1994). Only the line emission at the position of the cD shares its redshift. This velocity structure agrees with the above cooling model and argues strongly against the stripping hypothesis, where a strong velocity gradient is expected.
The extensive X-ray/H filament in A1795 offers the possibility to identify the source of energy and ionization of the optical nebulosity common in cooling flow clusters (Crawford et al 1999 and references therein; Donahue et al 2000). The filament extends at least 80 kpc from the cD and most of it is therefore well removed from the cD nucleus, the radio source, and the bulk of the stars in the cD. If part of the -band emission (McNamara et al 1996a) is due to massive young stars then the formation of intergalactic stars can be studied. It will clearly be interesting to observe the clumpiness of the emission. As reported above, the optical emission from the filament does not appear to correlate in detail with the X-ray emission, which could be due to clumpiness in the gas: the denser parts cool out fastest and so form stars more readily.
The Balmer decrement of 3–4 reported by Hu et al (1985) in the filament is consistent with a small amount of reddening. Further optical spectra can search for emission lines from calcium (Donahue & Voit 1993; Fabian, Johnstone & Daines 1994) which depletes onto dust. If dust is present, it need not rule out condensation from the intracluster medium since large grains may survive sputtering and supernovae from massive stars in the filament can inject dust. This could be helpful in studying prompt dust formation from young stellar populations which is not clearly understood at present (Feigelson, private communication).
The filament also enables studies of the survivability of cool gas in the intracluster medium against mixing and conduction. Mixing layers (Begelman & Fabian 1990) may provide some of the photoionizing radiation for the cold gas in the filament. Thermal conduction, if it proceeds at the Spitzer value, would destroy the filament in , so it must be suppressed by at least an order of magnitude, presumably by magnetic fields.
In summary, the optically-derived velocity structure of the filament associates it with the intracluster gas, not the galaxy. The X-ray-derived temperature structure of the filament, with the gas furthest from the galaxy (therefore oldest) being the coolest, indicates that the gas is cooling with time and not heating up (evaporating). Together with the approximate match in timescales, the evidence points to the filament originating from cooling of the intracluster gas, attracted into a wake along the path of the moving cD galaxy.
5 Acknowledgements
ACF is grateful to NASA for the opportunity to participate as an InterDisciplinary Scientist and the Chandra project for such a superb instrument. ACF, CSC and SWA thank the Royal Society for support.
References
- [] Allen S.W., Fabian A.C., 1997, MNRAS, 286, 583
- [] Allen S.W., Fabian A.C., Johnstone R.M., Nulsen P.E.J., Arnaud K.A., 1999, MNRAS, submitted, astro-ph/9910188
- [] Begelman M.C., Fabian A.C., 1990, MNRAS, 244, 26P
- [] Briel U.G., Henry J.P., 1996, ApJ, 472, 131
- [] Buote D., Tsai J., 1996, ApJ, 458, 27
- [] Cardiel N., Gorgas J., Aragon-Salamanca A., 1998, MNRAS, 298, 977
- [] Cowie L.L., Hi E.M., Jenkins E.B., York D.G., 1983 ApJ, 272, 29
- [] Crawford C.S., Allen S.W., Ebeling H., Edge A.C., Fabian A.C., 1999, MNRAS, 306, 875
- [] David L.P., Jones C., Forman W., Daines S.J., 1994, ApJ, 428, 544
- [] Donahue M., Voit G.M., 1993, ApJ, 414, L17
- [] Donahue M., Mack J., Voit G.M., Sparks W., Elston R., Maloney P.R., ApJ, 2000, in press (astro-ph/0007062)
- [] Ebeling H., White D.A., Rangarajan V., 1999, MNRAS, in press
- [] Fabian A.C., Hu E.M., Cowie L.L., Grindlay J., 1981, ApJ, 248, 47
- [] Fabian A.C., 1994, ARAA, 32, 277
- [] Fabian A.C., Arnaud K.A., Bautz M.W., Tawara Y., 1994, ApJ, 436, L63
- [] Fabian A.C., Johnstone R.M., Daines S.J., 1994b, MNRAS, 271, 737
- [] Fabian A.C., et al 2000, MNRAS, in press (astro-ph/0007456)
- [] Falcke H., Rieke M.J., Rieke G.H., Simpson C., Wilson A.S., 1998, ApJ, 494, L155
- [] Forman W., Schwarz J., Jones C., Liller W., Fabian A.C., 1979, ApJ, 234, L27
- [] Ge J.P., Owen F.N., 1993, AJ, 105, 778
- [] Heckman T.M., Baum S.A., van Breugel W.J.M., McCarthy P., 1989, ApJ, 338, 48
- [] Hill J.M., Hintzen P., Oegerle W.R., Romanishin W., Lesser M.P., Eisenhamer J.D., Batuski D.J., 1988, ApJ, 332, L23
- [] Holtzman J.A., et al 1996, AJ, 112, 416
- [] Hu E.M., Cowie L.L., Wang Z., 1985, ApJS, 59, 447
- [] Johnstone R.M., Fabian A.C., Nulsen P.E.J., 1987, MNRAS, 224, 75
- [] Johnstone R.M., Naylor T., Fabian A.C., 1991, MNRAS, 248, 18P
- [] McNamara B.R. et al 2000, ApJ submitted, astro-ph/0001402
- [] McNamara B.R. Januzzi B.T., Elston R., Sarazin C.L., Wise M., 1996, ApJ, 469, 66
- [] McNamara B.R., Wise M., Sarazin C.L., Januzzi B.T., Elston R., 1996, ApJ, L9
- [] Oegerle, W.R., Hill, J.M., 1994, AJ, 107, 857
- [] Pinkney J. et al 1996, ApJ, 468, L13
- [] Sakelliou I., Merrifield M.R., McHardy I.M., 1996, MNRAS, 283, 673
- [] Smith E.P. et al 1997, ApJ, 478, 516
- [] Takeda H., Nulsen P.E.J., Fabian A.C., 1984, MNRAS, 208, 261
- [] Taylor G., Barton E.L., Ge, J.-P., 1994, AJ, 107, 1942
- [] Taylor G.B., Fabian A.C., Allen S.W., 1999, in ’Diffuse thermal and relativistic plasma in galaxy clusters’, eds H.Bohringer, L. Feretti, P. Schuecker. MPIfE, Garching, Germany, p77
- [] van Breugel W., Heckman T., Miley G., 1984, ApJ, 276, 79
- [] Weisskopf M.C., Tananbaum H.D., Van Spebroeck L.P., O’Dell S.L., 2000, Proc SPIE, 4012, in press astro-ph/0004127
- [] Xu, H., Makishima K., Fukazawa Y., Ikebe Y., Kikuchi K., Ohashi T., Tamura T., 1998, ApJ, 5000, 738