The broad-band spectrum of 3C 120 observed by BeppoSAX
Abstract
We study a broad-band X-ray observation by BeppoSAX of the broad-line radio galaxy 3C 120. The primary X-ray continuum is well described by a power law with the photon index of and a high-energy break or a cutoff. The obtained e-folding energy of –300 keV corresponds to keV in thermal-Compton models. A soft X-ray excess is found at a statistical significance of . Our physical best-fit model of the excess is optically-thin emission from an extended plasma (with a luminosity of of the total X-ray luminosity), which interpretation is supported by an independent finding of an extended soft X-ray halo in 3C 120. We find a moderate Compton reflection component together with a moderately broad Fe K line with an equivalent width ( eV) fully consistent with the strength of reflection, indicating their origin in an optically-thick accretion disk extending relatively close to the central black hole. We observe strong spectral variability during our 2-day observation with varying from to and correlated with the soft X-ray flux. The variability is very well modeled by thermal Comptonization in a hot plasma irradiated by a variable UV flux. Both a hot patchy corona outflowing with a mildly relativistic velocity away from a cold disk and a hot inner accretion flow overlapping with the cold disk are viable geometries. The presence of an outflow in the first case and an overlap between the hot and cold phases in the second case are required by energy balance and the observed strength of Compton reflection.
1 INTRODUCTION
3C 120 is a broad-line radio galaxy (BLRG) at exhibiting characteristics intermediate between those of FR I galaxies and BL Lacs (Urry & Padovani 1995). It is also classified as a Seyfert 1 (Burbidge 1967), although its optical morphology is complex, see Grandi et al. (1997). It is variable in all energy bands, and shows superluminal motion in the VLBI core (e.g., Walker 1997).
In 1994, 3C 120 has been observed by ASCA, and since then the strength and the width of its Fe K has been a subject of a considerable controversy. Reynolds (1997) found the line to be extremely strong, with an equivalent width of keV, as well as extremely broad, with a Gaussian width of keV. The physical origin of such a line is unclear. A slightly weaker line, with keV and keV, was found in the same data by Grandi et al. (1997). Both results were obtained assuming the underlying continuum was a single power law in the entire energy range observed by ASCA, and Grandi et al. (1997) mentioned the possibility that the unusual line parameters were caused by that assumption not being valid. Indeed, Woźniak et al. (1998, hereafter W98) found that if the ASCA data (with an updated calibration of 1997) were fitted in the 4–10 keV range assuming the presence of Compton reflection with a reflector solid angle of between 0 and , the parameters of the line became much more physically plausible, with the best-fit values of –110 eV, the peak energy, keV, and keV and 0.20 keV assuming and , respectively. The line in the ASCA data was again claimed to be very strong and broad by Sambruna, Eracleous & Mushotzky (1999), who obtained eV and keV, virtually identical with the values of Grandi et al. (1997).
This issue has recently been resolved thanks to results of RXTE and BeppoSAX. Eracleous, Sambruna & Mushotzky (2000, hereafter E00) have found the line in the RXTE data ( keV) to be weak with the parameters consistent with those of W98, namely eV and keV. Similarly, Grandi (2000, hereafter G00) have found eV and keV in a preliminary analysis of the BeppoSAX data.
Since Ginga did not observe 3C 120, the actual strength of Compton reflection had been unknown until the results of E00 and G00, who found and , respectively. These values of the solid angle are compatible (George & Fabian 1991; Życki & Czerny 1994) with the presence of a modest Fe K line with the parameters of W98, E00 and G00.
Here, we present a comprehensive analysis of the observation of 3C 120 by BeppoSAX, which combines the broad-band hard X-ray coverage of RXTE with a high energy resolution and an energy range in soft X-rays comparable to that of ASCA. We address the issues of the parameters of the line and the continuum, their variability, radiative processes and geometry of the source, and the relationship of 3C 120 to other BLRGs as well as Seyferts.
2 DATA REDUCTION
The observation log is given in Table 1. Data from each instrument have been reduced following the standard procedures (Fiore, Guainazzi & Grandi 1999, hereafter F99). Spectra of LECS and MECS (2 units) detectors were extracted using a radius of and , respectively. The background spectra were taken from the blank sky fields in the position of the source with the same extraction regions.
| Start time | End time | Exposure [s] | Count rate [s-1]aaThe energy ranges are 0.3–4 keV, 1.3–10 keV, 13–110 keV for LECS, MECS, PDS, respectively, the count rates are background subtracted, and their uncertainties are 1-. | ||||
|---|---|---|---|---|---|---|---|
| LECS | MECS | PDS | LECS | MECS | PDS | ||
| 1997-09-20 08:14:15 | 1997-09-22 16:22:34 | 34029 | 77758 | 35755 | |||
We bin the LECS and MECS spectral files proportionally to the instrumental resolution (F99). After rebinning, there is always more than 20 counts per channel, as required for the validity of fitting. The LECS data are analyzed in the 0.3–4 keV energy range (channels 24–80). The lower limit is above the standard value of 0.15 keV (F99) because the source was strongly dominated by the background below 0.3 keV. The energy range of 1.3–10 keV (channels 34–114) is used for the MECS data. We allow a free normalization of the LECS spectrum with respect to the MECS one (F99).
We use the variable rise-time PDS spectrum. This choice is in agreement with F99, who recommend this method for weak sources with count rates –1 s-1 and the statistical uncertainty of the photon index, , of , and with spectra similar to that of the Crab. Indeed, in the PDS data, very similar to the Crab spectrum, and the 13–110 keV count rate is 0.72 s-1. After using the logarithmic rebinning in 18 channels (F99), photons are detected up to channel 15, and hereafter we use channels 2–15. When the variable and fixed rise-time spectra are fitted by the same model, the normalization of the former is about 0.95 of the latter. The same value is obtained by directly dividing the two spectra in the 15–100 keV energy range. If the lowest channels (13–15 keV) are also included, the ratio becomes slightly lower (0.93). From this and recommendations of F99, we derive the allowed relative normalization of the PDS spectrum with respect to the MECS one of 0.77–0.85.
3 SPECTRAL ANALYSIS
3.1 Spectral Models
We use xspec (Arnaud 1996) for spectral fitting. The parameter uncertainties below correspond to 90% confidence for a single parameter, i.e., , the plotted error bars are 1-, and the displayed spectral data are rebinned for clarity. The significance level of a hypothesis is obtained, unless stated otherwise, from the -test. For calculations of luminosity, we assume km s-1 Mpc-1, which gives the distance of 134 Mpc.
Intrinsic model spectra are absorbed by the interstellar medium in the Galaxy with a column density of cm-2 (Elvis, Lockman & Wilkes 1989). We also allow for intrinsic absorption at the redshift of the source with a column, . The absorption is in neutral matter with the abundances of Anders & Ebihara (1982) and the opacities of Morrison & McCammon (1983).
We allow for Compton reflection of the primary continuum from an optically-thick medium. We use Green’s functions for angle-dependent reflection of isotropic incident radiation of Magdziarz & Zdziarski (1995). The inclination of 3C 120 is most likely close to face-on (Zenzus 1989), and we thus use , which is the maximum value for which the Green’s functions are given. The relative amount of reflection is measured by the solid angle, , subtended by the reflector. The opacities of reflector are the same as for the absorber. We also test whether the reflecting medium can be ionized, in which case we use the one-zone ionization model of Done et al. (1992) modified as in Gondek et al. (1996). We assume then a reflector temperature of K (Krolik & Kallman 1984). The ionization parameter is defined as , where is the luminosity in an incident power-law continuum in the 5 eV–20 keV range, is the density, and the distance between the source of radiation and the reflector.
Reflection of the continuum is accompanied by emission of fluorescent lines, the most prominent of those is the Fe K line. In models with static reflection (as above), we model the line as a Gaussian, in which we constrain the line width to keV (so as to avoid this component to play a role of an additional continuum). The line equivalent width, , is proportional to at a given (George & Fabian 1991; Życki & Czerny 1994). In the case of an optically-thick accretion disk with a low ionization, cosmic abundances, an inclination of , and the photon index of –1.9 (which we find a posteriori to be the case for our data, see §3.2), calculations of George & Fabian (1991) give approximately
| (1) |
which condition we impose in our models. On the other hand, a remote molecular torus may be also present. It is likely that of the torus is substantially less than cm-2, as in most of Seyfert 2s (e.g. Risaliti, Maiolino & Salvati 1999) and both narrow and broad line radio galaxies (Sambruna et al. 1999), as well as it is the case on average for Seyfert 1s (Lubiński & Zdziarski 2001). In this case, reflection from the torus will be negligible (e.g., W98) but a a narrow Fe K line at 6.4 keV will still be produced (e.g., Makishima 1986). Thus, we allow the presence of a line with keV and keV and a free normalization in addition to that tied to the reflection.
When the reflection comes from a fast rotating disk in a strong gravitational potential, Doppler and gravitational shifts become important. We approximate these effects by convolving both the reflected component and the Fe K line (with keV and keV in the rest frame) with the Schwarzschild disk profile of Fabian et al. (1989). In calculating the relativistic distortion, we consider a range of radii from to , where is in units of the gravitational radius, . We assume the emissivity of the reflection and the line to vary along the disk radius in the same way as the accretion disk emissivity, as expected when X-ray emitting regions above the disk derive their power from accretion. To properly describe the line in this detailed model, we also include the component of the Fe K line singly-scattered in the disk at 6.2 keV containing 12% of the photons in the main component, as well as the Fe K and Ni K components, the sum of which we model as a single disk-line at 7.2 keV containing 18% of the photons in the main component (see W98). In those models, is defined for the Fe K component only (including the downscattered part), and it is tied to via equation (1).
3.2 Results
The spectrum is rather poorly fitted by a power-law continuum () absorbed by , at . We have found that the bad fit is clearly caused by the presence of soft-excess, Fe K, Compton-reflection, and high-energy cutoff spectral features.
We then fit an intrinsic continuum of an e-folded power law accompanied by static Compton reflection and a Gaussian line. This model provides a fair fit to the data, with , , keV, cm-2, at . However, there is a strong systematic residual feature at keV as well as the line width is at its allowed upper limit, keV, which is not physically consistent with the assumed static reflection. If we let the line flux to be independent of reflection, keV, but then is only of the value expected from the fitted reflection (see discussion below on the absence of resonant absorption), as well as there is no improvement of . Any possible contribution to the reprocessing features by the torus would only strengthen this discrepancy as a torus can produce a line without Compton reflection (see §3.1 above).
We find that allowing for an additional complexity of the spectrum in the soft X-ray range significantly improves the fit as well as makes the model more physically consistent. We first allow for a soft power-law component. This improves to 152.9/140 (corresponding to 95% significance). The additional power law is quite soft, , and a rather large cm-2 is required. Then, we consider an incident e-folded broken power law. We indeed find a break energy at keV. However, somewhat surprisingly, we find that the best-fit model has a power law index, , below harder than that, , above . The best-fit is 0 now, which explains the presence of the soft excess in the previous single power-law models with cm-2. The present model yields keV, , keV, null flux in the narrow line not associated with reflection, and (the reduction is significant at 98%). However, as we discuss below, such a broken power law does not appear to correspond to a physical model.
| aaIn cm-2. | [keV] | [keV] | [keV] | [eV] | [keV] | bbEmission measure in cm-3. | |||
|---|---|---|---|---|---|---|---|---|---|
| 150.5/141 |
On the other hand, the soft excess apparent in the single power-law model can also be accounted for by an extended (thus absorbed by only) emission of a thermal, optically-thin, plasma (e.g., Mewe, Gronenschild & van den Oord 1985) at keV. Using this model for the soft excess yields , i.e., an improvement of the fit at the 98% confidence level with respect to the model without a soft excess. The data and the model are shown in Figure 1. The absorbed 0.2–2 keV luminosity in the extended emission is erg s-1, while its total unabsorbed luminosity is erg s-1, which is only 1.8% of the bolometric (0.1– keV) luminosity of erg s-1. A weak (and probably constant) soft X-ray excess in 3C 120 has also been found in EXOSAT observations by Walter & Courvoisier (1992), and in Einstein data by Turner et al. (1991).
With the model above, we find that yields , which corresponds to the probability of the absence of reflection of . The best-fit flux of the narrow line in our best-fit model with reflection is null. Also, the best-fit parameters of the broad line remain virtually the same if we allow its flux to be independent of reflection. Thus we hereafter consider only the line associated with Compton reflection. The parameters of that model are given in Table 2. Note that and given there are not independent but instead related via eq. (1), which also yield the line flux of cm-2 s-1 in this specific model. (The corresponding - error contour is shown in §5 below.)

Using this model except for allowing reflector to be ionized, we find the reflecting surface is close to neutral, with erg s-1 cm, which implies that the dominant ion is Fe xiii (well below the region of resonant absorption). Also, allowing the Fe abundance to vary does not improve the fit and it has weak effect on its parameters (cf. E00). This confirms the validity of of equation (1). On the other hand, theoretical uncertainties on the Fe K line flux from disk reflection (Życki & Czerny 1994) allow it to be within –1 of the values of George & Fabian (1991). If we use the lowest prediction on the disk line flux, the allowed narrow line is still rather weak, with eV. Thus, given the limited statitics of our data, we cannot rule out some contribution from a remote torus, either Thomson-thin (yielding only a narrow line as in the case above) or Thomson-thick (yielding fractions of both the observed line and reflection).
The Gaussian Fe K line shows evidence for a broadening and redshift (see Table 2). Therefore, we also consider a model with the line emission and Compton reflection [tied via eq. (1)] both originating in a relativistic disk (§3.1). We have found that this model provides as good a fit, with , as the one with a Gaussian line and static reflection. Its parameters are , , keV, , and eV. With this physical model we re-examine the significance of the presence of the soft excess. Without it, the above model yields , which corresponds to the significance increased 99.5%. This shows that the physical requirement that both the line and the reflection continuum are broadened in the same way leads to an increase of the significance of the presence of a soft excess.
Then, we considered models with the continuum given by thermal Comptonization (including the soft plasma emission as in Table 2). We use a model of Poutanen & Svensson (1996), initially for spherical geometry with a homogeneous distribution of sources of seed photons, which we assumed to be a blackbody at a temperature of eV. We obtain a temperature of the scattering medium of keV, a Thomson optical depth of , , and at . The fitted parameters weakly depend on the assumed geometry; e.g., a geometry with hot plasma regions in the form of cylinders on the surface of a disk yields keV, , , and at .
The latter geometry yields an anisotropy break appearing around the peak of the 2nd scattering order (Poutanen & Svensson 1996), which could, possibly, account for the broken power-law spectral solution with the break at keV and no additional soft component described above. However, we have found that a coronal geometry without an additional soft component yields a relatively poor fit, with keV, . Comparing to the thermal-Compton above, the significance of the presence of a soft component is still 97%. If the temperature of seed photons is allowed to be free, eV, which constraint follows from the anisotropy break entering the fitted energy range.
We also consider a model with a broken power-law primary continuum with a break at high energies. However, this model requires the break to be above our data, at keV, with the index below the break of and an unconstrained index above the break. This model also provides a relatively poor fit, with . Thus, there is no evidence for a sharp spectral break at high energies in the data.
4 VARIABILITY
The spectrum analyzed in §3.2 has been integrated over the observation spanning more than 2 days (see Table 1), during which the source varied. The LECS and MECS light curves are shown in Figure 2a. In both instruments, the probability that the source were constant was independently of the temporal bin used. This is in agreement with the observed earlier on various time scales by EXOSAT, ROSAT and ASCA (Maraschi et al. 1991, hereafter M91; Grandi et al. 1997).


We see in Figure 2a that the soft spectrum is more variable than the hard one. Namely, the amplitude of the variations is in the 0.3–2 keV energy range and only in the 2–10 keV band. This variability pattern is driven by the spectrum becoming softer with increasing soft flux, as shown in Figure 2b. The linear correlation coefficient between the hardness ratio and the soft count rate is , and the probability that the 2 quantities are correlated is . A similar anticorrelation of the X-ray flux and spectral index was found on longer time scales in Einstein data by Halpern (1985) and in EXOSAT data by M91 and Grandi et al. (1992).

In order to find the range of the spectral index, , corresponding to the anticorrelation shown in Figure 2b, we have used the model of Table 2 in which we have varied (only) and then adjusted the normalization to match the 0.3–2 keV LECS rate of the extreme best-fit points in Figure 2b. We have found that the range of matching the observed spectral variability is quite large, 1.70–2.03 (significantly larger than the 90%-uncertainty range of the average in Table 2).
We have then investigated which physical process can be responsible for the observed behavior. A natural candidate here is thermal Comptonization in a hot plasma cloud irradiated by a variable flux of soft seed photons, as suggested by M91. If the power supplied to the cloud and its Thomson optical depth, , are constant, its electron temperature, , will adjust itself to the variable seed flux as to satisfy energy balance. Then, the higher the seed flux, the lower , and (since a decrease of at a constant corresponds to an increase of the X-ray spectral index, ) the softer the X-ray spectrum. Since the Comptonized spectrum joins at low energies to the peak of the spectrum of the seed photons, this will also correspond to an increase of the soft X-ray flux.
To test whether this process can indeed reproduce the observed spectral variability, we have used a Comptonization code by Coppi (1992, 1999), with its present xspec version described in Gierliński et al. (1999). This model is relatively similar to the one used in §3.2 except for being calculated self-consistently (rather than assumed) from the fluxes in Comptonized photons, , and in the seed photons irradiating the cloud, . Thus, its main parameters are , , and , with giving the normalization of the spectrum. We assume that the plasma is purely thermal, and the seed photons are blackbody at eV. We then fit the time-averaged spectrum, and obtain the amplification factor of and . Reflection is tied to the Fe K line and the relativistic smearing is taken into account as in §3.2, yielding and . We also take into account the soft-excess emission of an optically thin plasma (§3.2), and obtain .
We then vary only , increasing and decreasing it by a factor of 2. Unlike the power-law model above, we do not adjust the model normalization. The resulting predictions on the soft count rate and the spectral hardness are shown in Figure 2b. Given the simplicity of our assumption, the agreement with the observed spectral variability is extremely good, yielding strong support to the picture of the X-ray variability driven by a variable flux of irradiating UV photons.
The unabsorbed spectra corresponding to the inferred variability pattern are shown in Figure 3. Note that the shown UV and EUV part corresponds only the blackbody photons irradiating the hot plasma, with photons emitted directly to the observer dominating actual UV spectra of 3C 120 (see fig. 8 in M91). We see that the average and the extreme spectra pivot in the –12 keV range. This is consistent with a lack of correlation of and the 2–10 keV flux found by Walter & Courvoisier (1992).
A result of Walter & Courvoisier (1992) that is approximately proportional to the logarithm of the ratio of the UV flux to the X-ray flux is then consistent with the variability pattern in Figure 3, provided the UV flux incident on the hot plasma is proportional to that emitted towards the observer. This scenario is also supported by the finding of M91 that their highest UV state corresponds to the softest X-ray spectrum.
Note that Walter & Courvoisier (1992) have suggested that the spectral variability in X-rays (and the UV/X-ray correlation) can be explained by thermal Comptonization in a plasma with variable . For our obtained plasma parameters, we do not confirm this suggestion. Namely, varying by a factor of 2 changes the soft count rate, but without any noticeable changes in the hardness ratio, in contrast to our successful model with variable .
As we see in Figure 3, a prediction of the thermal-Compton model is that the lowest soft X-ray flux is associated with the highest flux in the –50 keV band as well as with the highest . Unfortunately, the limited statistics of our PDS data do not allow us to test this prediction. This can be tested in the future by the IBIS detector aboard INTEGRAL (Ubertini et al. 1999). Interestingly, the spectral variability of the black-hole binary Cyg X-1 in the hard state does show a pattern similar to that in Figure 3. Namely, a relatively hard spectrum with has a high-energy cutoff corresponding to keV (Gierliński et al. 1997) whereas a relatively soft spectrum with has keV (Frontera et al. 2001) and the 2 spectra intersect at keV (see Zdziarski, Wen & Paciesas 2001).
In principle, the variability shown in Figure 2 could also be a result of a variable . However, setting in our models of §3.2 does not reproduce the highest count rate shown in Figure 2. For that, we have found that the intrinsic power law index would have to be . As already found in §3.2, such a gives a relatively bad fit to the average spectrum as well as it has not been observed by ASCA and RXTE (see §5 below). Also, a model with variable has been considered by M91, who ruled it out based on the extensive EXOSAT monitoring. Finally, that model would not explain the UV/X-ray correlation discussed above.
5 COMPARISON WITH ASCA, XTE AND OSSE
Figure 4 shows a comparison of the spectrum from BeppoSAX (black symbols; the LECS and PDS spectra are renormalized to that of MECS) with those from ASCA (red symbols; the data from the 4 ASCA detectors are normalized to SIS0 and coadded, W98), RXTE (green symbols; the data are from E00) and CGRO/OSSE (blue, W98).
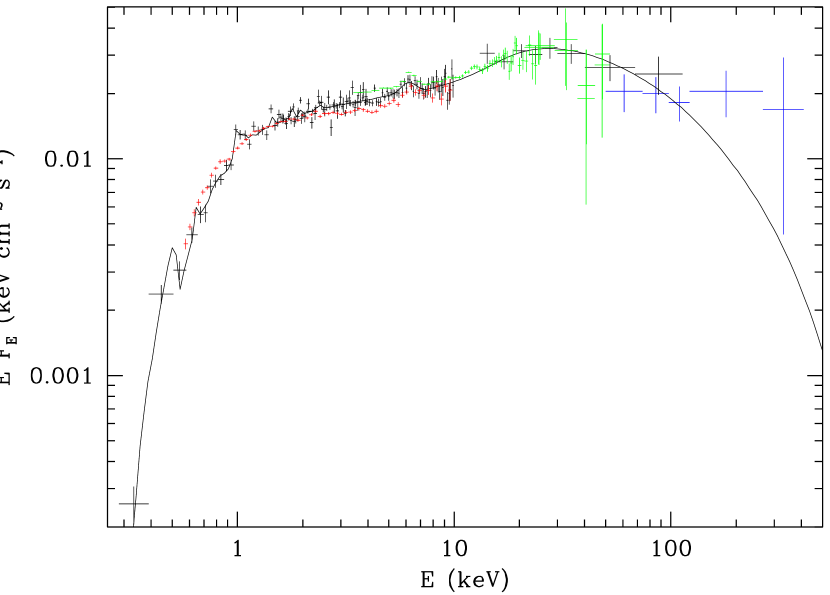
As seen in Figure 4, the ASCA spectrum shows both the continuum and the line profile remarkably similar to those of the BeppoSAX spectrum. However, the ASCA data show a spectral break at keV, with and 1.75 below and above the break, respectively (using the same data as W98). Then the model with a broken power-law and Compton reflection tied to the Fe K line yields both the reflection and line parameters very similar to those in the BeppoSAX data, namely , keV, keV, eV. When the presence of the break is not taken into account and the ASCA data are fitted with a single power-law continuum and a line with free parameters, an unphysical line with keV appears, as discussed by W98.
Since the break at 4 keV is not seen in the BeppoSAX data, we have considered possible causes of its presence in the ASCA data. We note first that a similar break appears in the RXTE data (see below), with the spectrum below 3.5 keV being significantly softer than that above it. However, this may result from calibration problems, as it is shown to be the case, e.g., for a simultaneous ASCA/RXTE observation of Cyg X-1 (Gierliński et al. 1999), and, accordingly, E00 have not taken into account the energy range below keV in their analysis. We have then looked at possible discrepancies between the ASCA SIS and GIS data. We have found that the SIS data at keV and keV are somewhat harder and softer, respectively, than the GIS data (in both versions of the ASCA data of W98 and of Sambruna et al. 1999). However, when we ignore the SIS data above 5 keV and either SIS or GIS data below 1 keV, we obtain virtually identical parameters of the broken power-law fit, with only a slight change of the hard power law of . Thus, we conclude that the (small) discrepancy between the SIS and GIS data is not the cause of the 4-keV break, or, equivalently, of the spuriously strong and broad line appearing in fits with a single power law continuum. We also note that in the ASCA sample analyzed by W98, a break at –4 keV appears also in the spectrum of 3C 382 and in one of 3 spectra of 3C 390.3 (all observed in 1993–94) whereas is not seen in the spectra of 3C 445, 3C 111 and the remaining two of 3C 390.3 (from 1995–96). A further analysis of this issue appears desirable.
We have also found a good agreement of the spectral shapes between the BeppoSAX and RXTE spectra. We have refitted the RXTE data of E00 in the 3.5–25 keV (PCA) and 20–50 keV (HEXTE) ranges with our baseline model (including a thermal soft-excess component and with parameters fixed at those obtained from the BeppoSAX data). We find that the RXTE data are compatible with the presence of an additional line component in addition to that coming from the reflector (see § 3.2). We obtain then continuum parameters similar to those of E00, namely , , yielding . The equivalent widths of the reflection-related line and the additional line are eV and eV, respectively. The data prefer the reflection-related line to be narrow, with keV. In spite of these differences, the line parameters in the RXTE and BeppoSAX data are still consistent with each other within 90% confidence. The - error contours for the RXTE data and those from BeppoSAX (using the model of Table 2) are shown in Figure 5.
We also note hard tails in the PCA and HEXTE data above the energy ranges used by us. The presence of these tails, most likely due to residual inaccuracies in background subtraction, appear responsible for the very high e-folding energy ( keV) and for the relatively large obtained by E00. When the data containing the tails are not used, is unconstrained by the RXTE data, and we thus kept it fixed at 150 keV (obtained from the BeppoSAX data).
Thus, there is an overall agreement about the parameters of both the line and the hard X-ray continuum between the BeppoSAX, ASCA and RXTE data: –0.3 keV, –100 eV, –1.9, –0.6.
A somewhat unclear issue is the form of the break or cutoff at soft -rays. The RXTE data do not allow us to determine it, as discussed above. The BeppoSAX data require a high-energy break or a cutoff. In the e-folded power-law model, shown in Figure 4, keV. Also, an OSSE observation simultaneous with that by ASCA required the presence of a cutoff with keV at a significance of 99.95% (W98). However, we see that the average OSSE data shown in Figure 4 above keV clearly lie above the predictions of this model for energies keV. This remains the case when the OSSE data (at a free normalization) are fitted together with the BeppoSAX data, in which case the best-fit values are keV () and keV in the e-folded power-law model and the spherical thermal-Compton model, respectively. Since the OSSE data show the source variability at energies keV (W98), it is possible that the cutoff energy is variable, and the spectrum at the time of the BeppoSAX observation did have an exponential cutoff. On the other hand, the spectrum of 3C 120 might have a substantial high-energy tail due to a non-thermal continuum. This hypothesis is supported by OSSE observations of other radio galaxies, as discussed in W98.
In particular, the OSSE data might contain a contribution from non-thermal, Doppler-enhanced, radiation of a jet. In order to test this hypothesis, we again fit the combined BeppoSAX/OSSE data (as above) with the model of Table 2 but with an addition of a power law representing the jet emission. This yields yields (which corresponds to the significance of adding the power-law component of only 75%) and the best-fit (which is almost unconstrained due to the low significance of adding that component; other best-fit parameters are , , keV). The 1-keV normalization of the jet component is cm-2 s-1 keV-1 when is fixed at 1.7. The 2 components intersect at keV. However, the integrated photon flux above 100 MeV of this model is cm-2 s-1, which best-fit value is times higher than the CGRO/EGRET detection threshold. Even though pointed several times, EGRET has not detected 3C 120 (Lin et al. 1993). Thus, if such a power-law jet component exists, it has to be either very weak or have a strong break/cutoff at energies below those observed by EGRET. On the other hand, there is no statistically significant evidence for its existence in the data.
6 DISCUSSION
6.1 Relationship to BLRGs and Seyferts
W98 have pointed out that BLRGs appear, on average, to have less Compton reflection, weaker F K lines and harder X-ray spectra than radio-quiet Seyfert 1s. Those conclusions have been confirmed by the studies of the BeppoSAX and RXTE data (G00, E00). In particular, the mean of the best-fit values of and the standard error of measuring that mean in models with Compton reflection in the above BLRG samples from Ginga (W98), BeppoSAX (G00), and RXTE (E00) are , and , respectively. For the sum of the 3 samples, we obtain . All these values are less than the corresponding mean for Seyfert 1s, which for the sample from Ginga (Nandra & Pounds 1994) and BeppoSAX (Matt 2000) is and , respectively. (In both cases, NGC 4151, a Seyfert 1 with very strong X-ray absorption, has not been included for computing the mean.)
These numbers clearly show that in BLRGs is significantly lower (by ) than that in Seyfert 1s. The probability that the mean of the above joint sample of BLRGs equals 1.95 (i.e., the mean of Seyfert 1s of Nandra & Pounds 1994) is (obtained from the Student distribution). Also, we note that all 15 best-fit values of in the above 3 samples of BLRGs are less than of Nandra & Pounds (1994). If s of BLRGs were sampled from the same distribution as that of Seyfert 1s, the probability of such an event would be only . Furthermore, we can test the hypothesis that the joint sample of BLRGs has the mean of 1.95 and the standard deviation of 0.15 (as in the sample of Nandra & Pounds 1994), for which we obtain the probability of (based on the normal distribution).
We note that E00 stated that their distribution of did not differ from that of Seyfert 1s from Ginga. However, the probability that their values of (1.78, 1.90, 1.72, 1.92) belong to the distribution with and is only 5%. Furthermore, we should note the difference of between RXTE and other X-ray instruments in fits to the Crab as well as other sources (e.g., Gierliński et al. 1999; Done, Madejski & Życki 2000), which, if taken into account, would make the difference in between BLRGs and Seyfert 1s even more pronounced, reducing the above probability to .
On the other hand, the distribution of in BLRGs is not disjoint from that in Seyfert 1s. This can be noted by considering the intrinsic dispersion, , of the values of in the samples (given by their standard deviations). For the BLRGs samples from Ginga, BeppoSAX and RXTE, , 0.08, and 0.10, respectively, while of their sum equals 0.14. The dispersion in the Seyfert-1 samples from Ginga and BeppoSAX (Nandra & Pounds 1994; Matt 2000) is and 0.20, respectively. Given the values of listed above, the distributions for BLRGs and Seyfert 1s significantly overlap (which, we stress again, does not imply that the 2 distributions are indistinguishable).
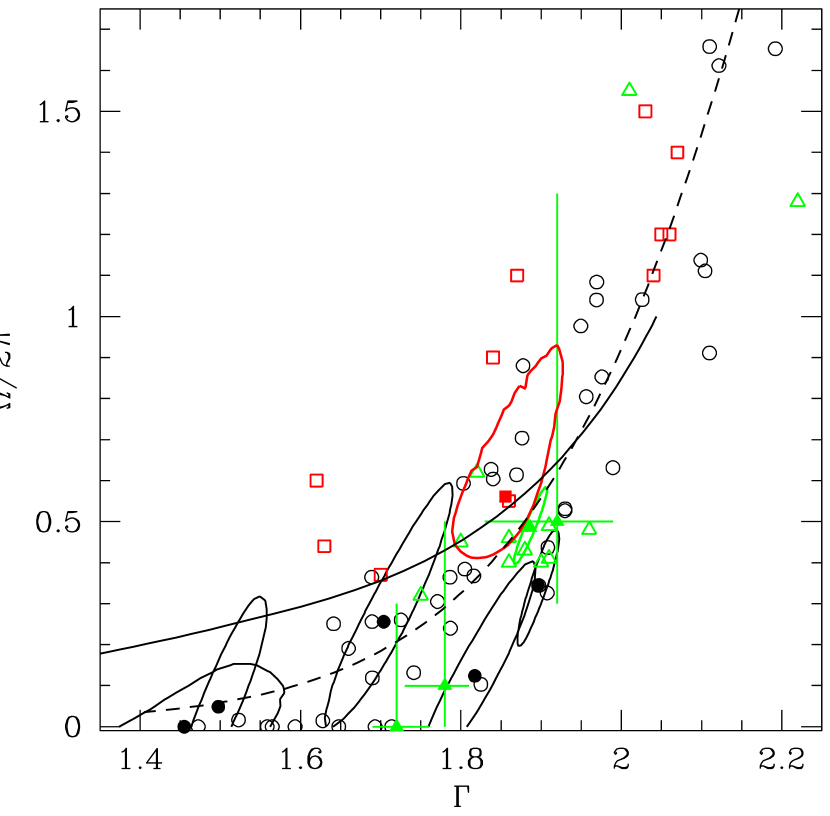
Furthermore, BLRGs obey an overall correlation between these and seen in Seyferts (Zdziarski, Lubiński & Smith 1999, hereafter Z99). This is illustrated in Figure 5 (where we can also note the offset between the RXTE results and those of Ginga and BeppoSAX). We see that BLRGs (including 3C 120) simply occupy a lower left part of the broader - parameter space occupied by radio-quiet Seyferts. Also, the average strength of the broad component of the Fe K line in radio-quiet Seyferts with close to that of 3C 120 observed by ASCA (Lubiński & Zdziarski 2001) corresponds to the strength of Compton reflection consistent within error bars with that observed in 3C 120.
This implies a general similarity between the physical conditions in the X-ray sources of Seyferts and BLRGs (including 3C 120), but with some unknown parameter determining (, ) in BLRGs offset with respect to that in radio-quiet Seyferts. We discuss this issue in the §6.3 below.
The overall similarity between the X-ray properties of BLRGs and radio-quiet Seyferts is further confirmed by the variability pattern of 3C 120 (Fig. 2b), where the X-ray spectrum becomes softer with the increasing X-ray flux. This pattern is the same as that often seen in radio-quiet Seyfert 1s, e.g., in NGC 5548 (Magdziarz et al. 1998) and NGC 4151 (Yaqoob & Warwick 1991). We also note that black-hole binaries in the hard state show a similar behavior (e.g., Zdziarski, Wen & Paciesas 2001).
6.2 Radiative and pair processes
Clearly, the dominant radiative process responsible for X-ray continua of many classes of compact objects is Compton upscattering of soft photons by energetic electrons. Less clear issues are the form of the electron distribution and the source of the seed soft photons. In the case of radio-quiet Seyfert 1s, the form of the soft -ray spectra from OSSE rules out distributions dominated by non-thermal electrons (Gondek et al. 1996). The strongest evidence for an electron distribution close to Maxwellian with –100 keV and in Seyferts comes from the average OSSE spectrum of NGC 4151 (Johnson et al. 1997) and the combined average OSSE spectra of other Seyferts (Zdziarski, Poutanen & Johnson 2000).
In the case of 3C 120 (as well as other BLRGs, W98), there is a break or a cutoff in soft -rays, but its form is not well determined. The thermal-Compton model gives –130 keV, but the OSSE data above 100 keV lie somewhat above the predictions of this model, indicating a possible high-energy, non-thermal, tail.
On the other hand, the fact that the X-ray spectra of BLRGs obey the - correlation supports their predominantly thermal origin. As discussed in Z99, the most likely origin of the correlation is a feedback between cold and hot media. The cold medium Compton reflects hard emission and provides blackbody seed photons for thermal-Compton cooling of the hot, X-ray emitting, plasma. (If the electrons in the hot plasma were predominantly non-thermal, no relation of the X-ray slope to the rate of cooling would be required.) Furthermore, the observed softening of the X-ray spectrum with increasing flux (Figs. 2-3) strongly supports the thermal-Compton model with a variable flux of irradiating soft photons, as shown in §4.
As stated above, the presence of the - correlation implies that the seed photons Comptonized in the hot plasma are emitted by a surrounding cold medium rather than intrinsically to the hot plasma. This is independently supported by results of Wardziński & Zdziarski (2000, see their fig. 8), who found that the expected strength of magnetic field in accreting sources in luminous AGNs (such as 3C 120) is far too weak to provide enough seed photons via thermal synchrotron emission for Comptonization to account for the observed X-ray spectra.
The best-fit thermal-Compton models (§3.2) have (–50 keV) too low for the plasma clouds with and sizes to be made predominantly of pairs, as follows from consideration of equilibrium between pair production and annihilation (Stern et al. 1995; Svensson 1996). Pair-dominated plasmas are only marginally possible for the highest /lowest compatible with the data at 90% confidence, keV, , provided the active regions are small enough (Svensson 1996). On the other hand, a modest non-thermal tail in the electron distribution could greatly enhance the pair-production rate, easing the above constraint. Thus, our data do not significantly constrain the pair content in the X-ray emitting plasma in 3C 120. We note that even if the plasma is pair-dominated, the presence of a distinct annihilation feature around 511 keV is unlikely (Maciołek-Niedźwiecki, Zdziarski & Coppi 1995). To conclusively resolve the issue of the presence of pairs, high signal-to-noise data up to MeV (e.g., from the IBIS/INTEGRAL detector) are required.
6.3 The geometry of the X-ray source
Two main disk geometries have been invoked for accreting X-ray sources: a patchy corona above a cold accretion disk, and a hot accretion disk with an overlapping cold medium (either an outer cold disk, cold blobs or both). As we show below, both of those possibilities appear viable for 3C 120, and BLRGs in general.
In the case of coronal geometry, the values of and fitted to the BeppoSAX spectrum of 3C 120 (§3.2) strongly rule out either a homogeneous corona or active regions located directly on the disk surface, from considerations of energy and pair balance (Stern et al. 1995). On the other hand, models with static active regions elevated above the disk to a height comparable to their size can fit 3C 120, see Svensson (1996). In this geometry, the fitted can be explained by a partial obscuration of the reflecting disk surface by the active regions.
However, in order to produce harder spectra, like those of other BLRGs, the emitting region should be even more separated from the cold accretion disk (e.g., Svensson 1996), but in that case the predicted and would increase with decreasing , opposite to the observed - correlation (Fig. 5). This problem can be solved by mildly relativistic motion of emitting plasma away from the disk, in which case both hard spectra and little reflection are obtained (Beloborodov 1999a, b). The dashed curve in Figure 5 shows a specific version of this model, as computed in Z99. We see that it can approximately reproduce the values of and of BLRGs.
This model has been claimed to be untenable for BLRGs by E00 on the grounds that radio jets in BLRGs are highly relativistic, with . However, radio jets (in particular the relativistic jet in 3C 120, Walker 1997) are observed on scales much larger than –100 inferred from the observed Fe K line broadening. The process of jet formation remains not well understood, but it is quite likely that the matter in the jet originates in an accretion disk. In that case, there has to be an inner region with a mildly relativistic wind velocity before is reached. That inner region may be then responsible for the observed X-ray emission.
The main alternative model involves a hot accretion disk (Shapiro, Lightman & Eardley 1976). Advection in the flow results in a branch with ineffective cooling as well as it limits the possible maximum luminosity and the optical depth of an inner flow (Narayan & Yi 1995; Abramowicz et al. 1995). The strength of reflection depends on the amount of overlap of the hot disk with an outer cold disk. The less overlap, the less effective cooling by blackbody photons emitted by the cold disk and the harder the X-ray spectrum. Results of a simple calculation of this effect by Z99 are shown by the solid curve in Figure 5. We see that this model is also roughly capable of explaining the data for 3C 120 and most other BLRGs. In the case of 3C 120, the overlap is required by the relatively large fitted value of since a sharp radial transition between the hot and cold phases yields (see Z99).
Both models explain the anticorrelation between the soft X-ray flux and the spectral hardness as being due to the increased cooling of the hot plasma by emission of the cold disk. In the hot accretion disk model, this can naturally be associated with the cold disk moving inward. In the outflow model, an increased soft flux can be directly due to an increase of the accretion rate.
The fact that BLRGs have harder spectra with less reflection than those average for Seyfert 1s indicates that some physical parameter (presumably the same that leads to the strong radio emission and jet formation in BLRGs) leads (on average) either to stronger coronal outflows (in the disk-corona model) or to larger inner radii of the cold disk (in the hot/cold disk model) than in the case of radio-quiet Seyferts.
6.4 The soft component
In §3.2, we have compared 3 pairs of models with and without an additional soft component. In the case of static reflection and a Gaussian line, the fit improvement due to adding emission of an optically-thin thermal plasma has 98% significance. However, the model without that component has a line with a large width incompatible with the assumed static reflection. When both the line and reflection are relativistically smeared, this significance increases to 99.5%. Finally, this significance for coronal Comptonization regions (which soft X-ray spectrum differs from a power law) is 97%. Using the last model, we have also demonstrated that the broken-power law fit in §3.2 cannot be physically justified as an approximation to the Comptonization anisotropy break. Thus, combining our spectral analysis with physical constraints we find the presence of a soft X-ray excess in the data to be confirmed at a high significance.
The optically-thin emission is likely to come from a larger, kpc-scale, region. Extended thermal components are commonly detected in soft X-rays from 3C radio galaxies, especially of the FR I type (Hardcastle & Worrall 1999). A recent analysis of ROSAT data has shown the presence of a hot gaseous environment in the BLRG 3C 382 (Prieto 2000), which X-ray spectrum is rather similar to that of 3C 120 (W98, G00). In fact, a re-analysis of the ROSAT/HRI image of 3C 120 (D. Harris, private communication) appears to show an extended halo, with the 0.2–2 keV luminosity emitted beyond the core radius of (6.5 kpc) comparable to that emitted by the optically-thin plasma in our spectral model (§3.2). This result strongly supports the actual presence of the soft excess in 3C 120 (also found in EXOSAT data by Walter & Courvoisier 1992).
Alternatively, the optically-thin emission can come from an intercloud medium within the broad-line region. The emission measure obtained by us is, in fact, consistent with the typical intercloud density ( cm-3) and the size of the broad-line region in 3C 120 of light-days, inferred from reverberation techniques (Wandel, Peterson & Malkan 1999).
A somewhat worse fit was obtained with an additional steep power law, which could represent emission from a soft X-ray jet. However, the only resolved feature away () from the nucleus in the ROSAT/HRI image of 3C 120 (Harris et al. 1999) emits a negligible soft X-ray luminosity, of the total X-ray/-ray luminosity, which makes this model relatively unlikely.
Also, the soft power law fitted by us could also represent a high-energy extension of the UV bump present in 3C120 (M91). This, however, requires rather high temperatures of the UV emitting medium, which could, in principle, be achieved in a transition layer between the disk and the corona (e.g., Czerny & Elvis 1987). This (together with the observed variability pattern, §4) would require the soft X-ray excess to vary together with the main X-ray component, which may be in conflict with results of Walter & Courvoisier (1992).
Finally, we note that the pattern of spectral variability shown in Figure 3 shows a variable power law index. The resulting average spectrum will be concave as the softest and hardest power law will dominate in the lowest and highest energies, respectively. This concave spectrum can, in principle, be responsible for the fitted soft excess.
Thus, we cannot conclusively determine the nature of the soft component due to the limited X-ray imaging and spectroscopic capabilities of BeppoSAX. To achieve this goal, observations with Chandra and XMM are highly desirable.
7 CONCLUSIONS
Our BeppoSAX data clearly show a continuum due to reflection of an X-ray power law with –1.9 from a cold material. The significance of the presence of reflection is and the solid angle of the reflector is ( for the e-folded power-law incident continuum). The reflection is accompanied by a fluorescent Fe K line with an equivalent width ( eV) fully consistent with originating entirely from the reflector. The line is moderately broad, and combining our spectral constraints with those from ASCA and RXTE (which data show an overall agreement with those of BeppoSAX) yields –0.3 keV. If this line comes from a Keplerian disk in a Schwarzschild metric, the inner radius of the emitting region is .
We find the presence of a high-energy break or cutoff in the BeppoSAX data. We can fit the data by either an e-folded power law or thermal Comptonization, obtaining keV, –130 keV, respectively. In the latter model, –3. We also detect a relatively weak (but significant at a confidence) soft excess. It is best-fitted by emission from an extended thermal plasma at keV, which model is supported by an independent finding of an extended soft X-ray halo from 3C 120.
We find strong spectral variability during the 2-day observation, corresponding to varying from to and correlated with the soft X-ray flux. The variability is very well modeled by thermal Comptonization in a hot plasma with a constant which temperature adjusts to a variable flux of irradiating UV photons.
The 3C 120 data obey the general correlation between the power-law slope and the strength of Compton reflection found in Seyferts and black-hole binaries. Interpretation of this correlation involves feedback between a thermal Comptonizing plasma and a cold medium, yielding support for our thermal-Compton spectral model. Our data are consistent with two geometries: an outflow above the surface of a disk, or a hot inner disk surrounded by an overlapping cold disk. Both homogeneous and static patchy corona models can be ruled out.
We confirm (at a very high confidence level) that BLRGs have harder X-ray spectra, less Compton reflection and weaker Fe K lines than those average in radio-quiet Seyferts. However, the distributions of those parameters in BLRGs and radio-quiet Seyferts are not disjoint; the former occupy a part of the parameter space occupied by the latter.
References
- (1)
- (2)
- (3) Abramowicz, M. A., Chen, X., Kato, S., Lasota, J.-P., & Regev, O. 1995, ApJ, 438, L37
- (4) Anders, E., & Ebihara, M. 1982, Geochim. Cosmochim. Acta, 46, 2363
- (5) Arnaud, K. A. 1996, in ASP Conf. Series 101, Astronomical Data Analysis Software and Systems V, ed. G. H. Jacoby & J. Barnes (San Francisco: ASP), 17
- (6) Beloborodov, A. M. 1999a, ApJ, 510, L123
- (7) Beloborodov, A. M. 1999b, in ASP Conf. Series 161, High Energy Processes in Accreting Black Holes, ed. J. Poutanen & R. Svensson (San Francisco: ASP), 295
- (8) Burbidge, E. M. 1967, ApJ, 149, L51
- (9) Coppi, P. S. 1992, MNRAS, 258, 657
- (10) Coppi, P. S., 1999, in ASP Conf. Series 161, High Energy Processes in Accreting Black Holes, ed. J. Poutanen & R. Svensson (San Francisco: ASP), 375
- (11) Czerny, B., & Elvis, M. 1987, ApJ, 321, 305
- (12) Done, C., Mulchaey, J. S., Mushotzky, R. F., & Arnaud K. 1992, ApJ, 395, 275
- (13) Done, C., Madejski, G. M., & Życki, P. T. 2000, ApJ, 536, 213
- (14) Elvis, M., Lockman, F. J., & Wilkes B. J., 1989, AJ, 97, 777
- (15) Eracleous, M., Sambruna, R., & Mushotzky, R. F. 2000, ApJ, 537, 654 (E00)
- (16) Fabian, A. C., Rees, M. J., Stella, L., & White, N. E. 1989, MNRAS, 238, 729
- (17) Fiore, F., Guainazzi, M., & Grandi, P. 1999, Cookbook for BeppoSAX NFI Spectral Analysis
- (18) (www.sdc.asi.it/software/cookbook) (F99)
- (19) Frontera, F., et al. 2001, ApJ, in press (astro-ph/0009160)
- (20) George, I. M., & Fabian, A. C. 1991, MNRAS, 249, 352
- (21) Gierliński, M., Zdziarski, A. A., Done, C., Johnson, W. N., Ebisawa, K., Ueda, Y., Haardt, F., & Phlips, B. F. 1997, MNRAS, 288, 958
- (22) Gierliński, M., Zdziarski, A. A., Poutanen, J., Coppi, P., Ebisawa, K., & Johnson W. N. 1999, MNRAS, 309, 496
- (23) Gondek, D., Zdziarski, A. A., Johnson, W. N., George, I. M., McNaron-Brown, K., Magdziarz, P., Smith, D., & Gruber, D. E. 1996, MNRAS, 282, 646
- (24) Grandi, P. 2000, Astroph. Lett. & Comm., in press (astro-ph/0005577) (G00)
- (25) Grandi P., Tagliaferri, G., Giommi P., Barr, P., & Palumbo, G. G. C., 1992, ApJS, 82, 116
- (26) Grandi, P., Sambruna, R. M., Maraschi, L., Matt, G., Urry, C. M., & Mushotzky, R. F. 1997, ApJ, 487, 636
- (27) Halpern, J. P. 1985, ApJ, 290, 130
- (28) Hardcastle, M. J. & Worrall, D. M. 1999, MNRAS, 309, 969
- (29) Harris, D. E., Hjorth, J., Sadun, A. C., Silverman, J. D., & Vestergaard M. 1999, ApJ, 518, 213
- (30) Johnson, W. N., McNaron-Brown, K., Kurfess, J. D., Zdziarski, A. A., Magdziarz, P., & Gehrels, N. 1997, ApJ, 482, 173
- (31) Krolik, J. H., & Kallman, T. R. 1984, ApJ, 286, 366
- (32) Lin, Y. C., et al. 1993, ApJ, 416, L53
- (33) Lubiński, P., & Zdziarski, A. A. 2001, MNRAS, submitted (astro-ph/0009017)
- (34) Maciołek-Niedźwiecki, A., Zdziarski, A. A., & Coppi, P. S. 1995, MNRAS, 276, 273
- (35) Magdziarz, P., & Zdziarski, A. A. 1995, MNRAS, 273, 837
- (36) Magdziarz, P., Blaes, O. M., Zdziarski, A. A., Johnson, W. N., & Smith, D. A. 1998, MNRAS, 301, 179
- (37) Makishima, K. 1986, in The Physics of Accretion onto Compact Objects, ed. K. O. Mason, M. G. Watson, & N. E. White (Berlin: Springer), 249
- (38) Maraschi, L., Chiapetti, L., Falomo, R., Garilli, B., Malkan, M., Tagliaferri, G., Tanzi, E. G., & Treves, A. 1991, ApJ, 368, 138 (M91)
- (39) Matt, G. 2000, Astroph. Lett. & Comm., in press
- (40) Mewe, R., Gronenschild, E. H. B. M., & van den Oord, G. H. J., A&AS, 62, 197
- (41) Morrison, R., & McCammon, D. 1983, ApJ, 270, 119
- (42) Narayan, R., & Yi, I. 1995, ApJ, 452, 710
- (43) Poutanen, J., & Svensson, R. 1996, ApJ, 470, 249
- (44) Prieto, M. A. 2000, MNRAS, 316, 442
- (45) Reynolds, C. S. 1997, MNRAS, 286, 513
- (46) Risaliti, G., Maiolino, R., & Salvati, M. 1999, ApJ, 522, 157
- (47) Sambruna, R. M., Eracleous, M., & Mushotzky, R. F. 1999, ApJ, 526, 60
- (48) Shapiro, S. L., Lightman, A. P., & Eardley, D. M. 1976, ApJ, 204, 187
- (49) Stern, B. E., Poutanen, J., Svensson, R., Sikora, M., & Begelman, M. C. 1995, ApJ, 449, L13
- (50) Svensson, R. 1996, A&AS, 120C, 475
- (51) Turner, T. J., Weaver, K. A., Mushotzky, R. F., Holt, S. S., Madejski, G. M. 1991, ApJ, 381, 85
- (52) Ubertini, P., et al. 1999, Astr. Lett. Comm., 38, 799
- (53) Urry, C. M., & Padovani, P. 1993, PASP, 107, 803
- (54) Walker, R. C., 1997, ApJ, 488, 675
- (55) Walter, R., & Courvoisier, T. J.-L. 1992, A&A, 258, 255
- (56) Wandel, A., Peterson, B. M., & Malkan, M. A. 1999, ApJ, 526, 579
- (57) Wardziński, G., & Zdziarski, A. A. 2000, MNRAS, 314, 183
- (58) Woźniak, P. R., Zdziarski, A. A., Smith, D., Madejski, G. M., & Johnson, W. N. 1998, MNRAS, 299, 449 (W98)
- (59) Yaqoob, T., & Warwick, R. S. 1991, MNRAS, 248, 773
- (60) Zdziarski, A. A. 1999, in ASP Conf. Series 161, High Energy Processes in Accreting Black Holes, ed. J. Poutanen & R. Svensson (San Francisco: ASP), 16 (astro-ph/9812449)
- (61) Zdziarski, A. A. 2000, in IAU Symp. 195, Highly Energetic Physical Processes and Mechanisms for Emission from Astrophysical Plasmas, ed. P. C. H. Martens, S. Tsuruta & M. A. Weber (San Francisco: ASP), 153 (astro-ph/0001078)
- (62) Zdziarski, A. A., Lubiński, P., & Smith, D. A. 1999, MNRAS, 303, L11 (Z99)
- (63) Zdziarski, A. A., Poutanen, J., & Johnson, W. N. 2000, ApJ, 542, 703
- (64) Zdziarski, A. A., Wen, L., & Paciesas, W. S. 2001, in preparation
- (65) Zensus, J. A. 1989, in Lecture Notes in Physics, Vol. 334, BL Lac Objects, ed. L. Maraschi, T. Maccacaro, & M.-H. Ulrich (Berlin: Springer), 3
- (66) Życki, P. T., & Czerny, B., 1994, MNRAS, 266, 653
- (67)