Metallicity Evolution of Damped Lyman- Systems
Abstract
According to Pei, Fall & Hauser (1999), the global metallicity evolution of the Universe can be represented by the ratio of the total metal content to the total gas content measured in Damped Lyman– (DLA) systems (the “column density weighted metallicity” à la Pettini). To minimize dust obscuration effects, a DLA sample with negligible dust content is considered, namely, 50 DLAs with . The global metallicity found shows clear evidence of redshift evolution that goes from solar at to solar at . More generally, DLAs with measured heavy elements probe the ISM of high redshift galaxies. The whole sample collected from the literature contains 75 DLAs. The metallicity is calculated adopting for the dust correction the most general method used so far, based on models of the ISM dust depletions in the Galaxy. The intrinsic metallicity evolution of DLA galaxies is .
Space Telescope Science Institute, 3700 San Martin Drive, Baltimore MD 21218, USA
1. Introduction
A Damped Lyman– (DLA) is often referred to as a QSO absorption line system with HI column density larger than atoms cm-2 associated with clouds in protogalactic disks (Wolfe et al. 1986). In a more modern fashion, DLAs are mostly neutral gas clouds (HI column density larger than atoms cm-2) associated with the interstellar medium (ISM) of a not defined class of galaxies detected from redshift up to . Among others, examples of the variety of morphologies of the emitting counterpart found nearby DLAs are given by Le Brun et al. (1997) and Rao & Turnshek (1998).
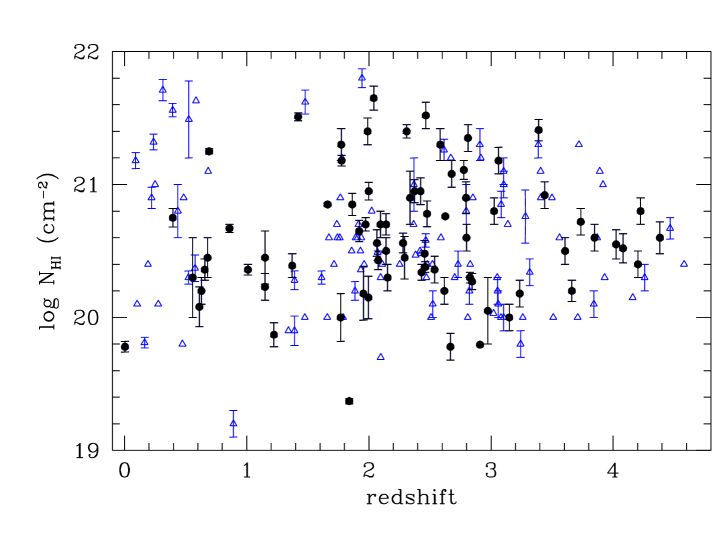
The large investment of telescope time dedicated to QSO surveys (Fan et al. 1999) and specifically to DLA surveys (Rao & Turnshek 1999) has brought the discovery of numerous DLAs. We know 180 objects (Fig. 1) and 55 candidates for a total of 235 DLAs in the redshift range . Among these, 75 are DLAs for which the column density of HI and one or more of the following ions have been measured: FeII, SiII, NiII, MnII, CrII, ZnII. These ions are the dominant contributors to the abundances of the corresponding elements in HI clouds with high column densities, because they all have ionization potentials below 13.6 eV. For this reason it is easy and straightforward to determine the relative heavy element abundance, just using the standard relation [X/Y] = . An important contribution to the richness of this sample has been provided by Prochaska & Wolfe (1999), Pettini et al. (1997), and Lu et al. (1996). The heavy element enrichment of DLAs has been studied recently in detail by Pettini et al. (1999) and Vladilo et al. (2000) who considered the ZnII absorption as a tracer of metallicity, and by Prochaska & Wolfe (2000), who preferred FeII measurements instead. Here we try to show that by combining this information together to build a larger database (75 DLAs at ) and making some assumptions about biases due to dust obscuration, we can have good evidence that the metallicity of the Universe as given by DLAs evolves with cosmic time.
2. Zinc vs. Iron
Very often when discussing metallicity in DLAs one is actually talking about the abundance of zinc relative to hydrogen. The zinc abundance is considered the right quantity because it suffers very little depletion onto dust grains and because the ZnII doublet is never saturated, and therefore easier to measure with accuracy (Pettini et al. 1994). Other elements like iron are often discarded because they are heavily locked in dust grains.
However important pieces of information are also carried by dust depleted elements. In Fig. 2 we plot an example of typical equivalent widths in the linear part of the curve of growth (Spitzer 1978) of the ZnII doublet and the multiple lines of FeII as a function of the transition wavelengths. These are typical of a DLA with and metallicity 1/10 solar. The presence of dust that makes the iron in the gas phase less abundant relative to zinc, is taken into account assuming a relative dust depletion of [Fe/Zn] . This value is the mean of iron relative to zinc abundance measured in a sample of 27 DLAs.
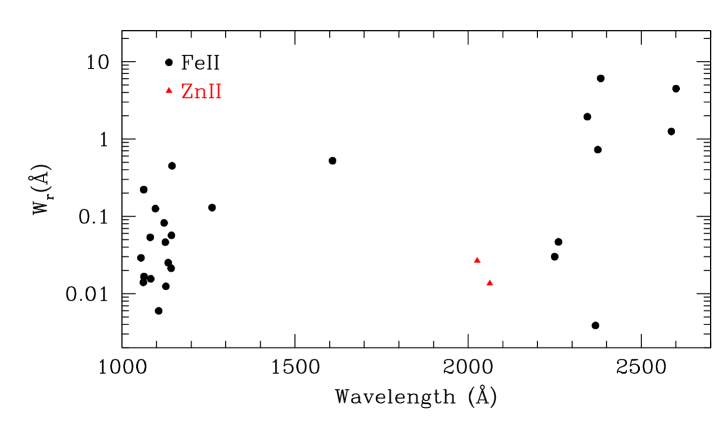
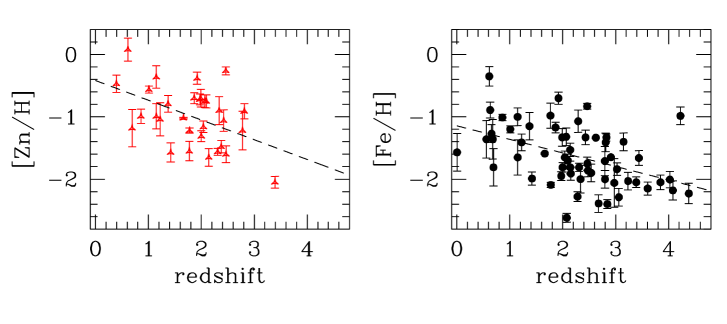
The FeII ion is characterized by numerous multiplets of lines which absorb in a large wavelength range, while ZnII is just present through a doublet around the 2000 Å rest frame. This means that iron can be detected in the optical at the lowest and highest redshifts up to , whereas ZnII already approaches the infrared, where spectroscopy is much less sensitive at . Another advantage of iron are the oscillator strengths that vary by three orders of magnitude in different absorption lines, making the detection of the ion very sensitive in very low metallicity DLAs or overcoming the problem of saturation when metallicity is high. Even if the ZnII doublet oscillator strengths are large, the much lower cosmic abundances of zinc with respect to iron (almost three orders of magnitudes) make the detection harder when the metallicity is low. FeII in general is much easier to detect because it is less affected by biases. This is shown in Fig. 3, where samples of DLAs with measured FeII and ZnII are reported. In the sample of 75 DLAs there are 59 objects with FeII in the redshift range , and 31 objects (almost a factor of two less!) with ZnII in a smaller redshift range . As a consequence if only ZnII is considered, the statistics are more limited in redshift range and biased toward low metallicity/dust free DLAs. The selection effects are discussed in more detail in section 5.
3. Dust Depletion Correction and Metallicity Determination
To derive a complete picture of the DLA chemical state, one must consider all detected heavy elements and correct for dust depletion effects. This is not particularly easy since every element is affected differently by dust depletion. In the Milky Way, a number of depletion patterns have been identified, showing highest depletions in dense disk clouds and lowest depletions in low density, warm halo clouds (Savage & Sembach 1996). Although each of the various patterns shows a range of possible depletions (typically within factors of 3), the trends are quite clear and the differences between the various patterns are unambiguously determined. The situation for DLAs may not be clear a priori because one does not know how similar the physical conditions are in the absorbing clouds of different objects nor whether the nature of dust in different objects is comparable. On the other hand, the similarities of the mean abundance ratios in DLAs with the ones of warm halo clouds and SMC absorbers (Welty et al. 1997; Savaglio, Panagia & Stiavelli 2000) suggest that the prevailing conditions cannot be very dissimilar. Therefore, we can make a simplification assuming that the depletion patterns in DLAs may be reproduced by one of the four depletion patterns identified for the Milky Way: Warm Halo (WH), Warm Halo + Disk (WHD), Warm Disk (WD) and Cool Disk (CD) clouds (Savage & Sembach 1996), thus modifying the dust–to–metals ratio to obtain the best match to observations.
In practice, let us call the depletion pattern for which we are comparing the abundance ratios observed in a given DLA. For every element Xi of that DLA, we consider the two quantities:
| (1) |
where for S, Zn, Si…, and for WH, WDH, WD, CD, is the observed depletion of element Xi in –type clouds. The two unknowns are the DLA metallicity compared with solar, , and its dust–to–metals ratio as compared with that of the –type clouds: . The values of and that minimize the reduced :
| (2) |
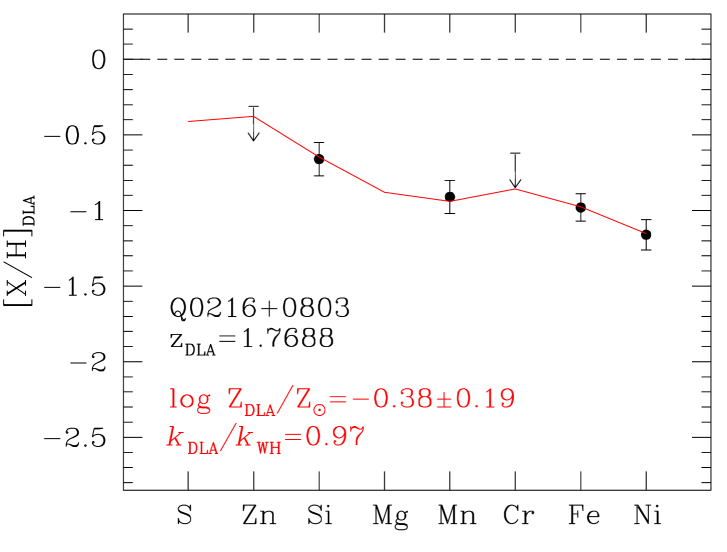
give the best solution to the problem. Here is the number of degrees of freedom and is the error on the measured column density ). We have applied this method using the WH, WHD, WD and CD depletion patterns, and for each DLA we obtained four sets of and values, from which we select the maximum likelihood solution. As an example we report in Fig. 4 the depletion pattern of the absorber along the QSO 0216+0803 sight line (Lu et al. 1996) together with the best solution.
4. Metallicity Evolution
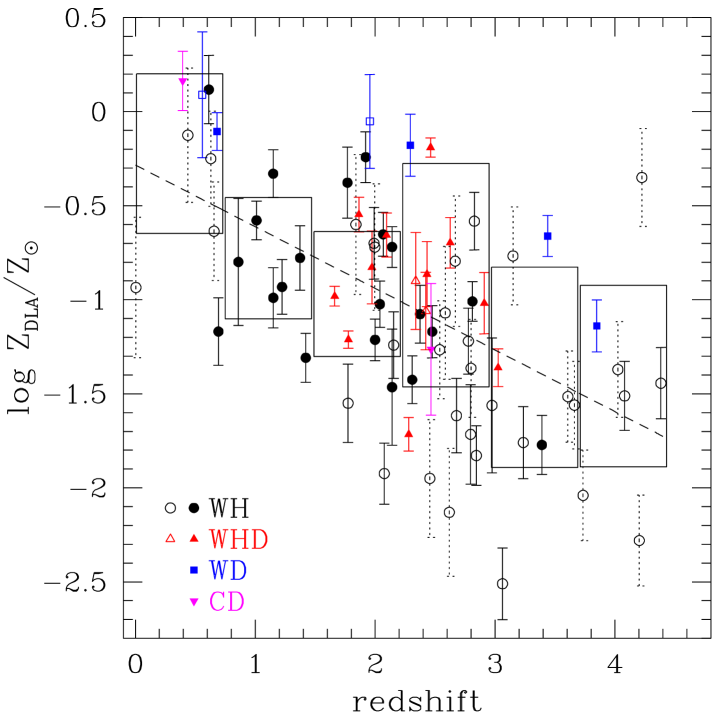
Fig. 5 shows the metallicity as a function of redshift found using this method for the 75 DLAs. Filled symbols represent DLAs with more than two measured element abundances for which it has been possible to obtain a proper best fit solution (38 DLAs). For these, the error bars have been calculated including both the uncertainties in the measured column densities, and the dust model fitting errors. For the cases with only two elements observed, a reduced cannot be calculated; thus, the best fit is considered less significant (18 DLAs, empty symbols and solid error bars). In these cases the error bars include uncertainty in the column densities plus, summed in quadrature, an average error of 0.15 dex, selected for being the mean fitting uncertainty for the DLAs with more than two measured elements. Finally, for the cases where only one element is measured, we only tentatively give an estimate of the metallicity assuming a WH depletion pattern (this is the most likely case, given the global properties) with (19 DLAs, empty symbols and dotted error bars). In these cases the error bars include an additional dex that takes into account the fitting uncertainty, and this is larger than derived for 92% of the DLA sample with more than two measured elements.
The mean metallicity calculated for the whole sample is and the mean redshift . In Fig. 5 we also show six boxes, centered on the weighted averages over intervals. Their vertical widths mark the corresponding weighted dispersion. We note that the vertical dispersion of points of 0.49 dex greatly exceeds the mean error of 0.20 dex, indicating that, although DLAs follow an average trend, there are real differences among individual objects in either initial conditions, or time of formation, or metal enrichment efficiency, or all of the above. To see whether there is a redshift gradient of metallicity, we applied the Spearman test to the whole sample and find a correlation coefficient of (99.99% significance level). The combination of the largest sample available (75 DLAs), a large redshift baseline () and a more accurate dust correction applied have led to the unambiguous detection of the redshift evolution of metallicity in DLA galaxies, with mean values around 1/25 of solar at to 3/5 of solar at . If a linear correlation is assumed between metallicity and redshift, we find a slope of . To test if this result is robust, we have calculated the linear correlation for the sample of 38 DLAs with more than two measured elements and found consistent results (, 99.65% significance level).
5. Dust Extinction in DLA QSOs
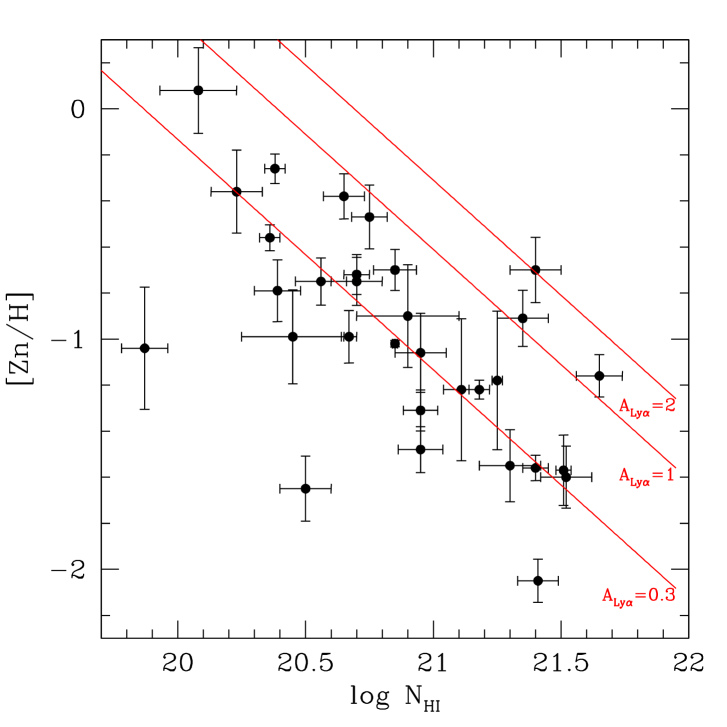
In Fig. 6 we show a plot of [Zn/H] vs. – originally presented by Boissé et al. (1998) – for a sample of 31 DLAs. DLAs with high [Zn/H] abundances and high HI column densities are not detected. These are the DLAs with larger dust content and therefore harder to observe due to dust extinction. In fact, obscuration at Lyman–, calculated assuming an SMC–like extinction law directly proportional to the column density of metals, is mag for a ZnII column density . In other words, dust obscuration can play an important role, in particular when considering ZnII selected DLAs because ZnII absorption is harder to detect than that of FeII (see Fig. 2).
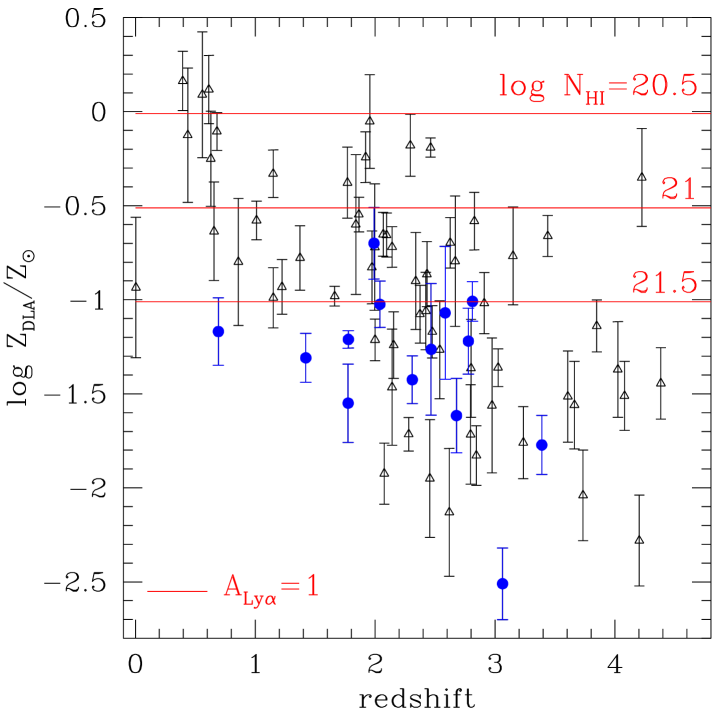
The effect of dust obscuration is also shown in Fig. 7 where the metallicity of high DLAs is displayed more clearly as a function of redshift . High DLAs are detected only when the metallicity is low. The horizontal lines indicate three metallicities and HI column densities necessary to have an extinction mag. There are no DLAs with at low redshifts. This means that if there is a metallicity evolution of DLAs, it is difficult to detect in a sample of high DLAs because dust content, proportional to metallicity, and thus dust obscuration is larger.
To better understand a possible dependence on the DLA gas content, we applied the metallicity analysis to the two subsamples of DLAs with low (, 20 DLAs) and high (, 20 DLAs) HI column densities (Fig. 8). What can clearly be noticed is a completely different redshift distribution in the two samples due to observational effects. The low DLAs are more homogeneously distributed in the redshift range than the high ones. The analysis for the redshift evolution gives a linear correlation coefficient much more significant for the low sample (, 99.8% significance level) than for the high sample (, 65.0% significance level), while the linear correlation gives a slope of and for the two samples, respectively. The fact that the metallicity for high DLAs is consistent with no evolution appears to be due to the high concentration of points in the central redshift range (70% are in the bin ). Indeed, the metallicity may evolve just as rapidly as in the low clouds, as the two slopes differ only at the (95%) level. This has important consequences when considering the redshift evolution of the ratio of the total metal content to the total gas content, as we discuss in the next section.

6. Global Metallicity Evolution

The metallicity provided by DLAs is considered to be a good indicator of the global chemical evolution of the Universe. In particular this can be reproduced by the ratio of the total column density of metals to the total column density of gas of DLAs, i.e., (Pei & Fall 1995; Pei, Fall & Hauser 1999). The ratio of the total metal content to the total gas content of DLAs in redshift bins has been calculated recently by Pettini et al. (1999) using 40 ZnII measurements, but these are actually 22 data points at , if we exclude upper and lower limits. The so called “column density–weighted” metallicity obtained by these authors does not show any redshift evolution. Basically the same result has been obtained by Vladilo et al. (2000) using a larger ZnII database (27 ZnII measurements at ) and by Prochaska & Wolfe (2000) who have explored this quantity at higher redshifts using FeII instead (39 FeII measurements at ). If this analysis is done using our larger sample (75 DLAs at ) the results are not different (left panel of Fig. 9).
Considering the discussion of the previous section, this is not surprising. DLAs with low and high HI column densities are not distributed in the same way, in particular the latter subsample is less homogeneous in the redshift range than the former. This means that when we consider the total metals to total gas ratio, where the high DLAs have a much larger weight compared to low DLAs, at low redshifts () the metallicity is underestimated because high DLAs are preferentially detected when dust content, and therefore metallicity, is low (see Fig. 7). The detection of high DLAs is particularly hard in the redshift bin because the observational capabilities are at the limits for both HST and ground based telescopes. This is evident from Fig. 1, where the distribution of DLAs as a function of redshift has a hole in the interval , also confirmed by the DLA selection function (the combined redshift survey path lengths for DLAs) reported by Mathlin et al. (2000). At high redshifts (7 DLAs at ), the weighted metallicity is basically dominated by a single DLA at (Prochaska & Wolfe, 2000) with large HI column density () and large metallicity ([Fe/H] , dust corrected). Indeed the column density weighted metallicity goes down to if we exclude this DLA from the analysis.
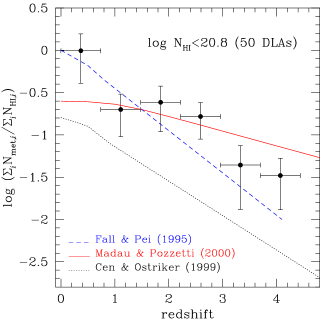
The results change if we make a selection of DLAs using those which are likely to be less affected by dust obscuration. The total metals to total gas ratio in DLAs show evolution in the subsample of 50 DLAs with HI column density lower than 20.8 (right panel of Fig. 9). This goes from solar at to 1/30 solar at . For comparison we also plot the metal production in the Universe as given by the most recent results on the global star formation history of the Universe (solid line: Madau & Pozzetti, 2000), and that obtained using cosmological hydrodynamical simulations (dotted line: Cen & Ostriker 1999). The difference between these two behaviors is remarkable, both in the normalization and in the slope. The observed evolution has been reproduced by Pei & Fall (1995), who have used closed–box, inflow and outflow models with results similar to those used for the chemical evolution of the MW. These models were constrained by the very limited observational results known at that time on the DLA metallicity.
7. Discussion
It is not clear yet how well the mean HI weighted metallicity obtained from current observations can represent the global metal enrichment of the Universe because different observational biases might affect the results. As shown in Fig. 8, low and high DLAs are distributed in a different way (the latter are concentrated at the center of the redshift interval while the former is much more scattered). Moreover, the two correlations are consistent with each other at the level. The lack of high with high metallicity, theoretically first considered by Pei and Fall (1995) and then found by Boissé et al. (1998), might correspond to the lack of high DLAs at . If there were a metallicity evolution also for high DLAs, dust obscuration could be too large at to make DLAs detectable (a DLA with and metallicity would result in an extinction of about 1 magnitude at Ly). Moreover, this is where UV observations, required to detect Ly absorption, are very sensitive to any appreciable dust opacity.
In general, before using DLAs to explore the metallicity evolution in the Universe, one should understand if and how DLA galaxies represent the total galaxy population at different epochs. Obviously, this is not a trivial task because many factors have to be taken into account some of which are very poorly known. When trying to match Lyman break galaxies to DLA galaxies, one should consider that the former are star forming galaxies for which the metallicity is usually inferred (and not measured) from the stellar and gaseous emissivity, while the latter are interstellar clouds with large HI column densities in galaxies of undefined nature for which the metallicity is measured from the absorption lines. On the other hand, when comparing DLAs with the intergalactic medium, one has to consider that high density regions like DLAs have very likely a different metallicity history than the mean value in the Universe and/or in the diffuse intergalactic medium. Cen & Ostriker (1999) have pointed out that higher density regions have higher star formation rates and after a fast heavy–element enrichment, the metallicity evolves very slowly compared to lower density regions, due to a suppression of the star formation.
We like to stress that it is the combination of a large sample of DLAs (75 objects), a wide redshift baseline () and an accurate dust correction applied to all heavy elements measured, that has allowed us to demonstrate that the metallicity of DLAs evolves with redshift. Had we limited ourselves to using Zn only (detected in 31 DLAs) with no dust correction, we would have not detected the same effect, even if ZnII lines are known not to suffer from strong saturation and dust depletion. This is because even small corrections are important when trying to detect elusive effects. In addition, Zn is much less abundant than other elements such as Fe and Si and, therefore, measuring its absorption lines is not always an easy task. The combined use of as many elements as possible allows one to much more efficiently track the metallicity evolution down to gas clouds that are very metal poor.
Acknowledgments.
I wish to thank the organizers of the IAU Symposium in Manchester, in particular Martin Harwit and Mike Hauser. I am grateful to Nino Panagia and Massimo Stiavelli for their important contribution at an early stage of the project.
References
Boissé P., Le Brun V., Bergeron J., Deharveng J.–M., 1998, A&A, 333, 841
Cen R., Ostriker J. P., 1999, ApJ, 519, L109
Fan X. et al., 1999, AJ, 118, 1
Le Brun V., Bergeron J., Boissé P., Deharveng J.–M., 1997, A&A, 321, 733
Lu L., Sargent W. L. W., Barlow T. A., Chruchill C. W., Vogt S. S., 1996, ApJS, 107, 475
Madau P., Pozzetti L, 2000, MNRAS, 312, L9
Mathlin G. P., Baker A. C., Churches D. K., Edmunds M. G., 2000, MNRAS, in press, astro–ph/0009226
Pei Y. C., Fall S. M., 1995, ApJ, 454, 69
Pei Y. C., Fall S. M., Hauser M. G., 1999, ApJ, 522, 604
Pettini M., Smith L. J., Hunstead R. W., King D. L, 1994, ApJ, 426, 79
Pettini M., Smith L. J., King D. L., Hunstead R. W., 1997, ApJ, 486, 665
Pettini M., Ellison S. L., Steidel C. C., Bowen D. V., 1999, ApJ, 510, 576
Prochaska J. X., Wolfe A. M., 1999, ApJS, 121, 369
Prochaska J. X., Wolfe A. M., 2000, ApJ, 533, L5
Rao S., Turnshek D. A., 1998, ApJ, 500, L115
Rao S., Turnshek D. A., 1999, ApJS, in press, astro–ph/9909164
Savage B. D., Sembach K. R., 1996, ARA&A, 34, 279
Savaglio S., Panagia N., Stiavelli M., 2000, proceedings of the conference ”Cosmic Evolution and Galaxy Formation”, ASP Conf. Series, astro–ph/9912112
Spitzer L., 1978, Physical processes in the interstellar medium, publ. J. Wiley
Vladilo G., Bonifacio P., Centurion M., Molaro P., 2000, ApJ, in press, astro–ph/0005555
Welty D. E., Lauroesch J. T., Blades J. C., Hobbs L. M., York D. G., 1997, ApJ, 489, 672
Wolfe A. M., Turnshek D. A., Smith H. E., Cohen R. D., 1986, ApJS, 61, 249
Discussion
Charley Lineweaver: I am trying to understand what your results mean for the star formation rate. Does the Fall & Pei model you showed for (which fits your results) have a star formation rate which increases more steeply betwen redshifts 0 and 1 than most of the other rates we have seen over the last two days?
Sandra Savaglio: According to Michael Fall it is not. In fact, the cosmic star formation rate history in the Pei & Fall (1995) models is very similar to that inferred subsequently from the UV luminosity density history. In particular, the SFR in the Pe-Fall models also rises by about a factor of 10 between and .
Richard Mushotzky: Most of the impact parameters are large, and so systematically sample outer, low-abundance regions of galaxies.
Michael Fall: A random distribution of impact parameters, with more impacts at large galactocentric distances, is just what one needs to get the mass-weighted mean metallicity, which is the same as the column-density-weighted mean metallicity. This is an unbiased measure of metallicity.
Savaglio: I agree.
Eli Dwek: What reference abundances did you use to correct for the depletions – Solar or B-star abundances?
Savaglio: I don’t expect to find different results, globally speaking.