FOREGROUNDS IN THE BOOMERANG-LDB DATA:
A PRELIMINARY rms ANALYSIS
We present a preliminary analysis of the BOOMERanG LDB maps, focused on foregrounds. BOOMERanG detects dust emission at moderately low galactic latitudes () in bands centered at 90, 150, 240, 410 GHz. At higher Galactic latitudes, we use the BOOMERanG data to set conservative upper limits on the level of contamination at 90 and 150 GHz. We find that the mean square signal correlated with the IRAS/DIRBE dust template is less than 3 of the mean square signal due to CMB anisotropy.
1 Introduction
Millimeter-wave emission of interstellar dust can be an important contaminant of sensitive CMB anisotropy surveys (see e.g. ). However, experimental information on this subject is still coming from serendipitous detections of dust in sensitive anisotropy experiments , from the low-resolution surveys of COBE-DMR and COBE-FIRAS , and from extrapolation of the full sky surveys of IRAS and DIRBE .
BOOMERanG is a sensitive millimeter wave telescope operating on a long duration balloon platform. The instrument is designed to take full advantage of long duration stratospheric flights, and features a 1.3 m off/axis, low background, low sidelobes telescope, and ultra sensitive bolometers covering 4 frequency bands (90, 150, 240, 410 GHz) with resolution ranging from 10 to 18 arcmin FWHM.
In the 1998/99 long duration flight, BOOMERanG observed about 2000 square degrees of the sky. About 1300 square degrees are at high galactic latitudes (), in a region of sky with the lowest amount of dust emission (constellations of Caelum, Doradus, Pictor, Columba, Puppis). The fluctuation of the 100 m brightness mapped by IRAS is well below 1 MJy/sr in over 500 square degrees, as estimated from the DIRBE-recalibrated IRAS maps .
In this paper we show that, in this region mapped by BOOMERanG, dust contamination in the CMB bands (90 and 150 GHz) is negligible with respect to the CMB signal. The 240 GHz band is partially contaminated by dust emission only in the lowest Galactic latitudes. The 410 GHz map is well correlated with the DIRBE-recalibrated IRAS maps.
2 RMS Data Analysis
The BOOMERanG maps used here have been obtained from the raw data using an iterative method which greatly reduces the large scale artifacts due to low-frequency noise in the detector system, and correctly estimates the noise in the datastream. Low spatial frequencies (structures larger than ) have been removed from the maps. Healpix 7’ pixelization has been used.
In order to estimate the level of contamination in the 90, 150, 240 GHz channels, we proceed as follows:
1) We estimate the mean square value of sky signal fluctuations at low and high galactic latitudes. Uncorrelated detector noise is removed by correlating signals from different detectors ( and ) in the same frequency band. This procedure is similar to the initial COBE-DMR analysis:
where is the slope of the best fit .
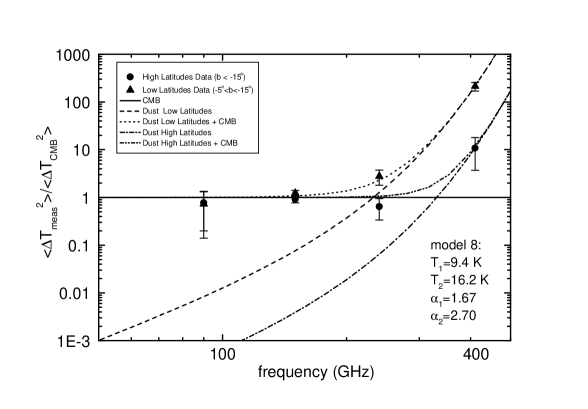
2) We plot these fluctuations versus frequency, at high and low Galactic latitudes (see fig.1). Assuming a combination of cold and warm dust is appropriate for high Galactic latitudes . We normalize the best fit model in (model 8) to our 410 GHz mean square signal. In fact, a visual comparison of the two maps shows that the two are very well correlated, and that our 410 GHz channel is dominated by dust emission in cirrus clouds. From the figure is evident that the model 8 dust spectrum fits quite well the 240 GHz point, and that dust is irrelevant at 90 and 150 GHz, producing less that 1 of the mean square fluctuation at 150 GHz. Even using a single-temperature dust, normalized at 410 GHz and with emissivity index we get very similar conclusions.
3 Correlations with IRAS
The previous results are based on a spectral model for the extrapolation of dust emission at long wavelengths. In the following we want to find model-independent constraints on the level of dust fluctuations present in our bands.
The best dust monitor we have is the IRAS/DIRBE map, so we pixel-pixel correlate our maps to a properly re-pixelized IRAS/DIRBE map, in order to get an estimate of the dust signal in our maps. Using the IRAS map as a dust template (rather than our own 410 GHz channel), we also remove any possible spurious instrumental correlation.
We divide the maps into five regions at different galactic latitudes, each 10o wide, and we make pixel-pixel correlations. The 410 GHz channel is very well correlated to IRAS at low latitudes, and has statistically significant correlations for latitudes as high as 50o (we get linear correlation coefficients of 0.62, 0.22, 0.20, 0.17, 0.06 for latitude strips centered at -15o, -25o, -35o, -45o, -55o respectively, with about 20000 pixels per strip). The 410 GHz map is morphologically very similar to the IRAS/DIRBE map extrapolated at 400 GHz using model 8 in. For the linear correlation coefficient between the two datasets is 0.62 (22000 pixels) and the best fit slope of the scatter plot is . The error is dominated by dust properties fluctuations, rather than by detector noise.
The other channels have statistically significant correlations only for low latitudes (). For example, for the 90 GHz channel we have a correlation coefficient of 0.19 for the strip centered at -15o, and values , fluctuating around 0, for higher latitude strips.
We compute the ratio between the dust signal in our channels and the dust monitored by IRAS at high latitudes () from the slopes of the best regression line in the pixel-pixel scatter plots. Only the 410 GHz slope given above is significantly different from 0. Using the other slopes we can set upper limits to the contamination of dust in our CMB channels, using the mean square fluctuation in the IRAS map as a reference. At the 95 confidence level, the contamination at 150 GHz is always less than 3 of the mean square CMB anisotropy, while the contamination of the 90 GHz is always less than 0.5. Needless to say, this analysis does not detect foregrounds which are not correlated to the 100 emission mapped by IRAS.
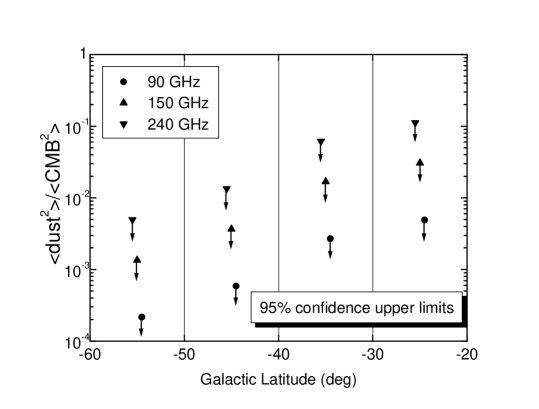
These are conservative limits, since we are just computing the mean square fluctuations, while we know that dust is less and less anisotropic when we reduce the angular scale of interest . So the level of contamination at can be significantly lower than what we have computed here.
4 Conclusions
These preliminary results confirm that dust is not expected to be a serious contaminant of sensitive CMB searches, if the region of interest is a low IRAS brightness one, and at frequencies lower than 170 GHz. The quality of the data allows us to extract much more. We are currently working on the determination of dust parameters and on the estimate of the angular power spectrum of fluctuations for this foreground.
5 Acknowledgments
BOOMERanG is supported by PNRA, ”La Sapienza”, ASI, NSF, NASA, PPARC. We would like to thank the staff of NSBF (and especially S. E. Peterzen) and USAP in Mc Murdo, for the excellent preflight support and the marvelous LDB flight.
References
References
- [1] A. De Oliveira-Costa, M. Tegmark, eds, Microwave Foregrounds, ASP Conf.Ser., 181, 1999.
- [2] P. Meinhold, et al., Ap.J. 409, L1 (1993).
- [3] S. Masi, et al., Ap.J. 452, 253 (1995).
- [4] S. Masi, et al., Ap.J. 463, L47 (1996).
- [5] E. Leitch, et al, Ap.J. 486, L23 (1997).
- [6] P. Mukherjee, et al., MNRAS, submitted, astro-ph/0002305.
- [7] A. Kogut, et al., Ap.J. 460, 1 (1996), Ap.J. 464, L5 (1996).
- [8] D.J. Fixsen, et al., Ap.J. 473, 576 (1996).
- [9] D.J. Schlegel, et al. Ap.J. 500, 525 (1998).
- [10] D.P. Finkbeiner, M. Davis, D.J. Schlegel, astro-ph/9905128.
- [11] A. Lange et al., Space Sci. Rev. 74, 145 (1995).
- [12] S. Masi et al., in 3K Cosmology, AIP conf. series 476 (1999) astro/ph 9911520.
- [13] P. de Bernardis et al., New Astron.Reviews 43, 289 (1999).
- [14] S. Prunet et al., these proceedings
- [15] T.N. Gautier et al., Astron.J. 103, 1313 (1992).
- [16] A. Kogut et al., Astrophys.J. 460, 1 (1996).
- [17] E.L. Wright, Astrophys.J. 496, 1 (1998).