A high-resolution multi-wavelength study of the jet in 3C 273
Abstract
We present HST images at 622 nm and 300 nm of the jet in 3C 273 and determine the run of the optical spectral index at 02 along the jet. We find no evidence for localized acceleration or loss sites, and support for a little-changing spectral shape throughout the jet. We consider this further evidence in favour of a distributed acceleration process.
Max-Planck-Institut für Astronomie, Königstuhl 17, 69117 Heidelberg, Germany
NRAO, Socorro, NM 87801, USA
Jodrell Bank Observatory, Macclesfield, Cheshire SK11 9DL, UK
Of the plethora of known extragalactic radio jets, optical emission has to date been observed from only about 15 extragalactic jets. The radio and optical emission observed from terminal hot spots of radio jets can be explained by first-order Fermi acceleration at a strong shock in the jet (the bow shock) (Meisenheimer & Heavens 1986; Heavens & Meisenheimer 1987; Meisenheimer et al. 1989; Meisenheimer, Yates, &Röser 1997). But it is not clear that the optical synchrotron emission from the jet body, extending over tens of kiloparsecs in some cases, can equally be explained by acceleration at strong shocks inside the jet. Electrons with the highly relativistic energies required for the emission of optical and UV synchrotron radiation have a very short lifetime which is much less than the light-travel time down the jet body in 3C 273, for example. We have embarked on a detailed study of the jet in 3C 273 using broad-band observations at various wavelengths obtained with today’s best observatories in terms of resolution: the VLA (with a planned combination with MERLIN data) and the HST. Here, we present optical and near-UV images obtained with HST, and the run of the optical spectral index along the jet of 3C 273.
The jet was observed with WFPC2 in March and June 1995, using the Planetary Camera (PC) with a pixel size of 00455 (proposal ID 5980). The total exposure time was 35 500 s through filter F300W (ultra-violet, centered at 300 nm) and 10 000 s through F622W (red light, 620 nm). Figure 1 shows the reduced, background-subtracted sum images.
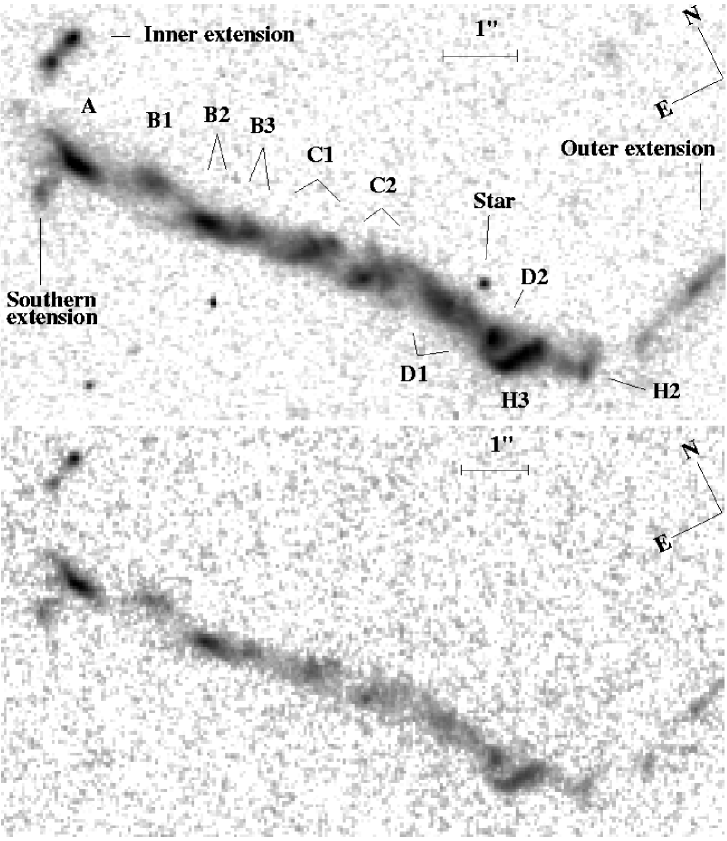
Independently of whether a spectrum actually does follow a power law over any range of frequencies, a two-point spectral index can be defined between any two surface brightness measurements as We calculated a map of the optical spectral index between red and ultraviolet at 02 beam size from Fig. 1. (Details of the data reduction and the alignment process used to avoid systematic errors in the spectral index will be given in our forthcoming paper (Jester et al. 2000, in prep.).) From the jet image (Fig. 1), we extracted a trace of the brightness profile by locating the brightness maximum in slices perpendicular to the jet’s mean position angle of 2222. Figure 2 shows this profile and the run of the optical spectral index at the brightness maximum.
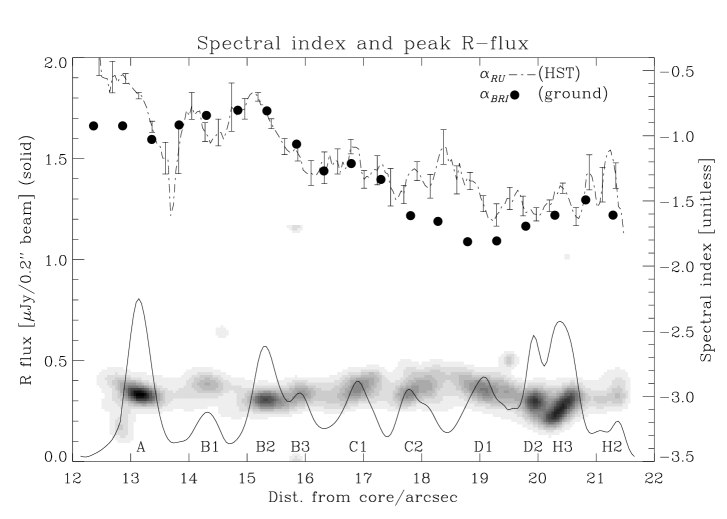
The spectral index variations are very smooth over the entire jet at our resolution of 02 ( pc). There is no abrupt change of inside the bright regions. Our determination of the spectral index between 622 nm and 300 nm shows a good overall agreement with the spectral index obtained from measurements at 450 nm, 650 nm and 860 nm (from Röser & Meisenheimer 1991). The overall trend is a steepening of the spectral index, from at the inner end of the jet (A) down to at D2/H3 just before the radio hot spot. This corresponds qualitatively to the outward decrease of the cutoff frequency as determined from synchrotron spectra fitted to the brightest jet knots at 13 resolution (Meisenheimer, Neumann, & Röser 1996). The only discrepancy between and occurs in A and C2/D1. Clearly, flux from neighbouring knots contributes to each point at 13 resolution. There may be further reasons, e. g., the fact that the jet widens at longer wavelengths: there is extended emission around the jet in the infrared (Neumann, Meisenheimer, & Röser 1997), and a larger beam will pick up some flux from this steeper component also at 622 nm.
The smooth spatial changes and the similarity of the optical spectral index at vastly different scales imply a little-changing spectral shape over the entire jet. We are unable to find localized acceleration centres and conclude that there is a smooth distribution of accelerated particles.
A full, quantitative discussion of the optical spectral index will be given in future publications. There, we will examine in detail the shape of the synchrotron spectrum from radio to UV frequencies by fitting spatially resolved spectra according to Meisenheimer et al. (1989). This will enable the detection of deviations of the spectral shape from a simple power law with cutoff. For example, a UV flux point above a synchrotron cutoff fitted to the radio-to-optical data will be a hint for a second high-energy electron population producing the X-ray emission (Röser et al. 2000). The mapping of the maximum particle energy determined from the spectra will further constrain the locality of the acceleration process.
Acknowledgments.
These results are based on observations made with the NASA/ESA Hubble Space Telescope, obtained at the Space Telescope Science Institute, which is operated by the Association of Universities for Research in Astronomy, Inc. under NASA contract No. NAS5-26555.
References
Flatters, C., & Conway, R. G. 1985, ‘The radio jet of the quasar 3C 273’, Nature, 314, 425–426
Heavens, A. F., & Meisenheimer, K. 1987, ‘Particle acceleration in extragalactic sources — The role of synchrotron losses in determining the spectrum’ MNRAS, 225, 335–353
Lelièvre, G., Nieto, J.-L., Horville, D., Renard, L., & Servan, B. 1984, ‘Optical structures of the M87 and 3C 273 jets’, A&A, 138, 49–56
Meisenheimer, K., & Heavens, A. F. 1986, ‘Particle acceleration in the hotspot of the jet of quasar 3C 273’, Nature, 323, 419–422
Meisenheimer, K., Neumann, M., & Röser, H.-J. 1996, ‘Spectral evolution along the jets of M87 and 3C 273’, in Lecture Notes in Physics vol. 471, Jets from Stars and Galactic Nuclei, ed. W. Kundt (Heidelberg: Springer), 230–237
Meisenheimer, K., Röser, H.-J., Hiltner, P. R., Yates, M. G., Longair, M. S., Chini, R., & Perley, R. A. 1989, ‘The synchrotron spectra of radio hot spots’, A&A, 219, 63–86
Meisenheimer, K., Yates, M. G., & Röser, H.-J. 1997, ‘The synchrotron spectra of radio hot spots. II. Infrared imaging’, A&A, 325, 57–73
Neumann, M., Meisenheimer, K., & Röser, H.-J. 1997, ‘Near-infrared photometry of the jet of 3C 273’, A&A, 326, 69–76
Röser, H.-J., & Meisenheimer, K. 1991, ‘The synchrotron light from the jet of 3C 273’, A&A, 252, 458–474
Röser, H.-J., Meisenheimer, K., Neumann, M., Conway, R. G., & Perley, R. A. 2000, ‘The jet of 3C 273 observed with ROSAT HRI’, A&A, 360, 99–106