A Giant Bipolar Shell around the WO star in the Galaxy IC 1613: Structure and Kinematics ††thanks: Astronomy Letters, Vol.26,No 3, 2000, pp.153-161. Translated from Pis’ma v Astronomicheskii Zhurnal, Vol.26, No. 3, pp. 190-199. Translated by V. Astakhov.
Abstract
Observations of the nebula associated with the WO star in the galaxy IC 1613 are presented. The observations were carried out with a scanning Interferometer Fabry-Perot in Hα at the 6m Special Astrophysical Observatory telescope; narrow-band Hα and [OIII] images were obtained with the 4-m KPNO telescope. The monochromatic Hα image clearly reveals a giant bipolar shell structure outside the bright nebula S3. The sizes of the southeastern and northwestern shells are pc and pc, respectively. We have studied the object’s kinematics for the first time and found evidence for expansion of both shells. The expansion velocities of the southeastern and northwestern shells exceed and , respectively. We revealed a filamentary structure of the shells and several compact features in the S3 core. A scenario is proposed for the formation of the giant bipolar structure by the stellar wind from the central WO star located at the boundary of a dense “supercavity” in the galaxy’s H I distribution.
1 Introduction
Among more than five hundred WR stars in the Local-Group galaxies, only six objects belong to a rare group of the “oxygen” stars Wolf-Rayet (WO). According to Barlow & Hummer (1982), they can be considered as a separate sequence in the WN-WC-WO chain, which represents a very short final evolutionary stage of massive stars close to a bare CO core. The WO stars are characterizes by a “superwind” (with a velocity up to (see Barlow & Hummer, 1982; Torres et al.,1986; Dopita et al.,1990;Polcaro et al., 1992) preceded by the wind at the MS and WR stages. The WO effective temperature reaches K (Maeder & Meynet, 1989;Dopita et al.,1990; Melnik &Malayeri ;Polcaro et al.,1991).
Of the six WO stars in the Local-Group galaxies, three were identified in our Galaxy, one in the LMC, one in the SMC, and one in the irregular dwarf galaxy IC 1613; only two of them are associated with bright nebulae, including WO in IC 1613.
Our interest in the latter object also stems from the fact that WO is the only WR star identified in IC 1613, although the number of WO stars cannot exceed of the WR population because of their short lifetime.
D’Odorico & Rosa (1982) and Davidson & Kinman (1982) identified the WO star in IC 1613 by broad lines typical of this class of stars in the spectrum of the core of the bright emission nebula S3 (Sandage, 1971). The star’s coordinates , , are known with a accuracy (Armandroff & Massey , 1985).
The central part of S3 is characterized by bright HeII 4686 emission (Smith, 1975; D’Odorico & Rosa, 1982; Garnett et.al, 1991). A detailed spectral analysis and a discussion of the chemical composition of the bright nebula are presented in (Garnet et al., 1991, Kinsburgh & Barlow, 1995). Narrow-band Hα images revealed regions of weaker emission predominantly southeast of the previously known bright, elongated nebula S3 (Hodge et al., 1990; Hunter et al., 1993).
Thermal radio emission was detected from S3; the sizes of the radio source at half maximum intensity are , and the radio image faithfully reproduces the shape of the bright optical nebula (Goss & Lozinskaya, 1995).
In this paper, we present our Hα observations of the nebula with a Fabry-Perot interferometer on the 6m Special Astrophysical Observatory (SAO) telescope, as well as narrow-band Hα and [OIII] images of the region obtained with the 4-m KPNO telescope.
For the first time, we have clearly revealed a weak outer bipolar shell structure far outside the bright nebula S3 and studied the kinematics of the object.
In Sect. 2, we provide basic parameters of the instruments and describe the observing and reduction techniques; results of the interferometric observations with the 6m telescope and the observations with the 4-m KPNO telescope are presented in Sect. 3. The origin of the unique bipolar shell structure of the nebula around the WO star is discussed in Sect. 4.
2 Observations and data reduction
2.1 Interferometric Observations
The interferometric Hα observations were carried out with a scanning Fabry-Perot interferometer with focal reducer at the prime focus of the 6m SAO telescope SAO (the equivalent focus is F/2.4). The interferometer is described in Dodonov et al. (1995). The pre-monochromatization was performed by using an interference filter with the centered on Hα and tilted at an angle of .
We used a Fabry-Perot etalon operating in the 235th order at the Hα wavelength; the separation between adjacent orders corresponded to the range free from order overlapping. The detector was a TK1024 -pixel CCD array. The observations were carried out with a -pixel instrumental binning to reduce the readout time. We obtained -pixel images in each spectral channel, with the pixel size corresponding to 068.
The size of the spectral channel was or in Hα . The actual instrumental profile of the interferometer was determined from night-sky lines , and Hα ); the profile width was about or .
We performed the observations on August 31, 1998, with a seeing at the zenith distance . A total of 24 interferograms were obtained for various interferometer plate spacings. The time of a single exposure was 240 s.
The He I () line of a calibration lamp was used for the phase shift measurement. After the observations, we made several accumulations of the images
of the caps of the 6m primary mirror uniformly illuminated by a lamp of continuous light. This allowed us to make a correction for nonuniform detector sensitivity (flat-fielding) and simultaneously to adjust the filter passband.
The observational data were represented as -pixel “data cubes”; i.e., a 24-channel spectrum corresponded to each image element.
The data reduction (correction for the phase shift, subtraction of the night-sky spectrum, construction of the velocity field and the emission line and continuum images) was carried out by using the ADHOC software package developed by Boulesteix (1993).
Using star images from the Digital Palomar Sky Survey Atlas (DSS), we rotated the original images to coincide with the correct orientation and then averaged a element, so that the resulting pixel size was 134.
To increase the signal-to-noise ratio, we performed an optimal filtration of the cube of observational data: smoothing by Gaussian with 1.5 channels FWHM in spectral direction and smoothing in spatial direction with FWHM about of the seeing value. After the smoothing, the resulting spatial resolution was .
Although the actual spectral resolution for the etalon in the 235th order of interference was in Hα , the accuracy of measuring the velocity from the line centroid (or from the Gaussian fit) in the case of a symmetrical profile is considerably higher and is determined by the accuracy of phase calibration. The actual accuracy of a single measurement was checked by using a comparison spectrum and was .
The tie-in to the absolute velocity was checked by using night-sky lines. The possible systematic shift did not exceed .
2.2 Narrow-Band Images
The narrow-band Hα and [OIII] images of the nebula were obtained with the 4-m Kitt Peak National Observatory (KPNO) telescope. Interference filters centered on the Hα (, ) and [OIII] (, ) lines were used. The detector was a -pixel CCD array with the pixel size corresponding to 047.
The observations were carried out on December 29 and 30, 1995; the angular resolution determined from star images was 12 in Hα and 14 in [OIII].
3 Results of the observations
3.1 Monochromatic Hα Image
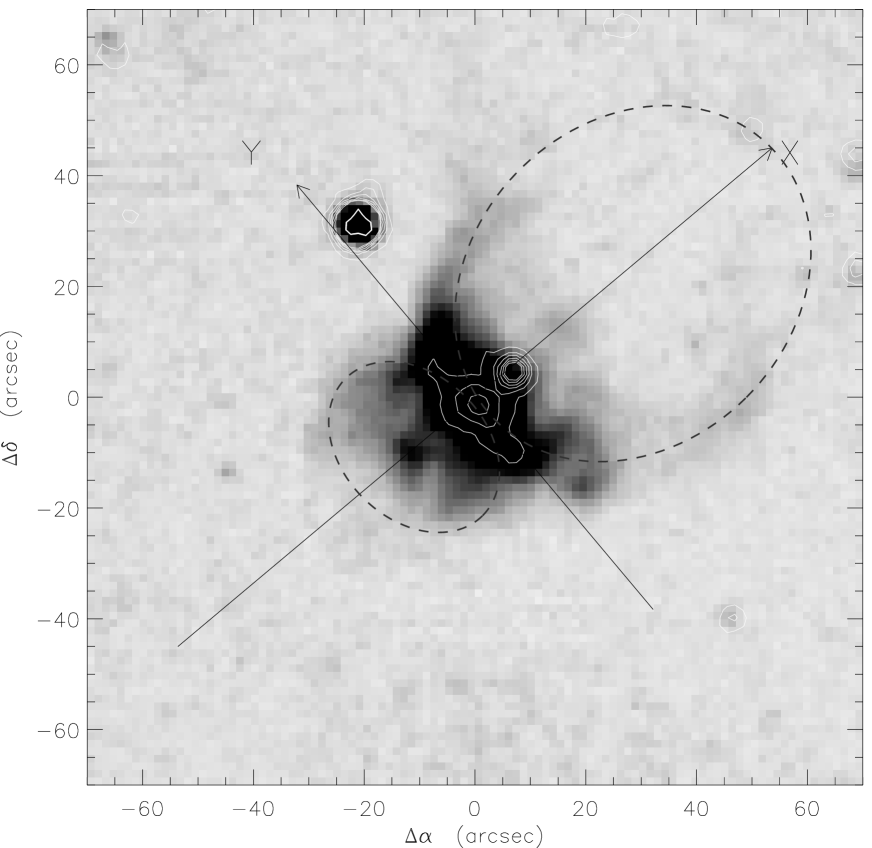
Figure 1 shows the monochromatic Hα image of the region obtained by integrating the emission over all spectral channels of the line. For comparison, the image of the same region in continuum in the immediate vicinity of Hα line is indicated by isophotes; here, foreground stars in the field of view are clearly seen.
The absolute brightness were determined from comparison with the brightness from Hodge et al. (1990) for several nebular regions. Sources 37b, c, e, and g in the list of these authors were used for the flux calibration; i.e., the brightest and faintest regions were excluded.
Constructing the monochromatic image allowed us to clearly distinguish regions of weak Hα emission from the background far outside the bright nebular core. As a result, we have been able for the first time to clearly show that
these outer weak regions form a giant bipolar shell structure around the WO star and the bright S3 core. The two shells forming this bipolar structure are indicated by the dashed line in Fig. 1.
According to our measurements, the sizes of the three components (the bright core and the two outer shells) are the following: angular sizes of or linear sizes of pc for the bright nebula S3; or pc for the outer southeastern shell; and or pc for the outer northwestern shell.
We give the sizes along the major and minor axes of each structure for a distance of 660 kpc, as inferred by Saha et al. (1992)
3.2 Narrow-Band Hα and [OIII] Images
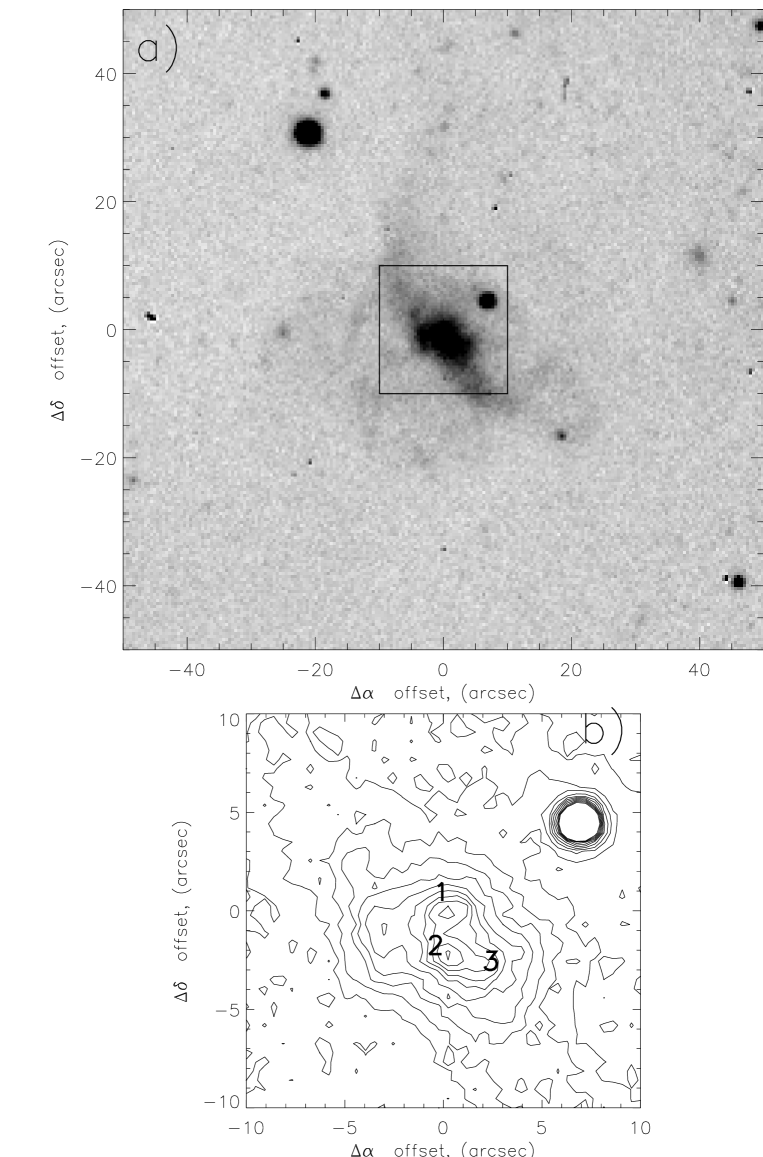
Figure 2 shows the Hα (Figs. 2a, 2b) and [OIII] (Figs 2c, 2d) images of the nebula obtained with the 4-m KPNO telescope. The southeastern outer shell and part of the northwestern shell at the very “base” near the bright nebular are seen in these figures. Both shells exhibit a distinct filamentary structure; in general, the filaments in the two lines are morphologically identical.
Three compact features unresolvable in the 6m telescope monochromatic image because of the poor seeing on the observing night are clearly seen in the region of the bright S3 core. In all probability, the brightest of them (N1 in Fig. 2) is the WO
![[Uncaptioned image]](/html/astro-ph/0011385/assets/x3.png)
Figure 2. continued
star. The remaining features are most likely compact knots of gas, because, as follows from a comparison of Figs. 2b and 2d, their relative brightnesses in the two lines are different (N2 is brighter than N3 in Hα and weaker than the latter in [OIII]). To elucidate the nature of these compact sources requires spectroscopic observations at a sufficiently good seeing.
3.3 Kinematics
Figure 3 shows the measured velocities at the line peak and the line FWHMs as obtained from our Fabry-Perot interferometric observations. In the data reduction, the line was fitted by a Gaussian; the line width was corrected for the instrumental profile width by assuming that the latter was also Gaussian. In order to find evidence for expansion of the outer bipolar shell, we constructed the distributions of line velocity and FWHM along two cuts designated,


respectively, “X” and “Y” in Fig. 1. The band along the “X” axis is wide, so the entire bipolar structure falls within it; the ( wide) band along the “Y” axis covers predominantly the bright central S3 core and, in part, the weaker emission at the bases of the two outer shells.
A comparison of the line velocities and FWHMs along the two cuts leads us to the following conclusions:
-
1.
The scatter of velocities of the line peak is systematically larger in both outer shells than that in the central bright S3 core. Indeed, the velocities in the central region along the “X” axis in Fig. 1 vary in the range from to ; the velocities in the southeastern shell vary in the range from to ; and the range of velocities in the extended northwestern shell is largest: from to .
As we see from the cut along the “Y” axis in Fig. 3b, the scatter of velocities in the bright S3 core is even smaller: velocities from to are observed in a band within of the center (in accordance with the core size; see Fig. 1). At large distances from the center, the scatter increases because of the contribution of emission from the bases of both outer shells.
-
2.
The line width in both shells also exceeds appreciably the line width in the central core. As we see from Fig. 3c, the line width in the same central region is no larger than ; in the southeastern shell, it reaches ; and the broadest line up to is observed in the northwestern shell.
The two observed patterns of behavior suggest the presence of systematic high-velocity motions in the outer bipolar shell structure. Based on these data, we may take an expansion velocity for the southeastern shell and for the northwestern shell as a rough estimate. The two values are a lower limit; the underestimate can be more significant for the northwestern shell, because here we observe mainly the emission from the periphery, where the effect of geometrical projection reduces the observed radial velocities.
Evidently, observations with a higher spectral and angular resolution are desirable to accurately estimate the expansion velocity. It should be borne in mind, however, that such an “erratic” velocity distribution – from slow bright knots to the most rapid weak features – is observed in most expanding supernova remnants and nebulae around the sources of strong stellar wind, which were studied with a high angular and spectral resolution (Lozinskaya,1986 and 1992). Indeed, the nebulae are irregular in shape and clumpy in structure; accordingly, the effect of geometrical projection changes erratically the observed radial velocity. During the passage of a shock wave, the gas of dense bright knots accelerates weakly, while the gas of lower density accelerates more strongly. For these reasons, the entire set of radial velocities, ranging from the gas at rest to the shock velocity, is commonly observed in real expanding shells. Higher resolution observations of the nebula around the WO star in IC 1613 could therefore reveal the same erratic distribution of line velocities and FWHMs.
According to our measurements, the mean velocity of the bright part of the nebula, where the expansion effect is marginal, is . Given a possible systematic tie-in error of the absolute velocity measurements within (see Sect. 2), this value is in agreement with the measurements by Tomita et al.(1993): , as inferred from one spectrogram of S3, and with the measurements by Lake & Skillman (1989) in the 21-cm radio line: the mean velocity in the near galactic region.
4 Discussion
The existence of an outer bipolar structure outside the bright core of the nebula S3 in IC 1613 was first suspected by one of us (T.A.L.) back in 1988 on the basis of trial narrow-band [OIII] images obtained at her request by M.A. Dopita with the 2.6m MSSS ANU telescope, which have not been published. This suspicion was completely confirmed in this study.
Lozinskaya (1997) suggested the break out (burst) of a strong stellar wind in two directions out of the dense gas layer forming the “main body” of the nebula as a possible explanation for the bipolar structure of the outer shells. Not only the morphology of the nebula but also its orientation relative to the
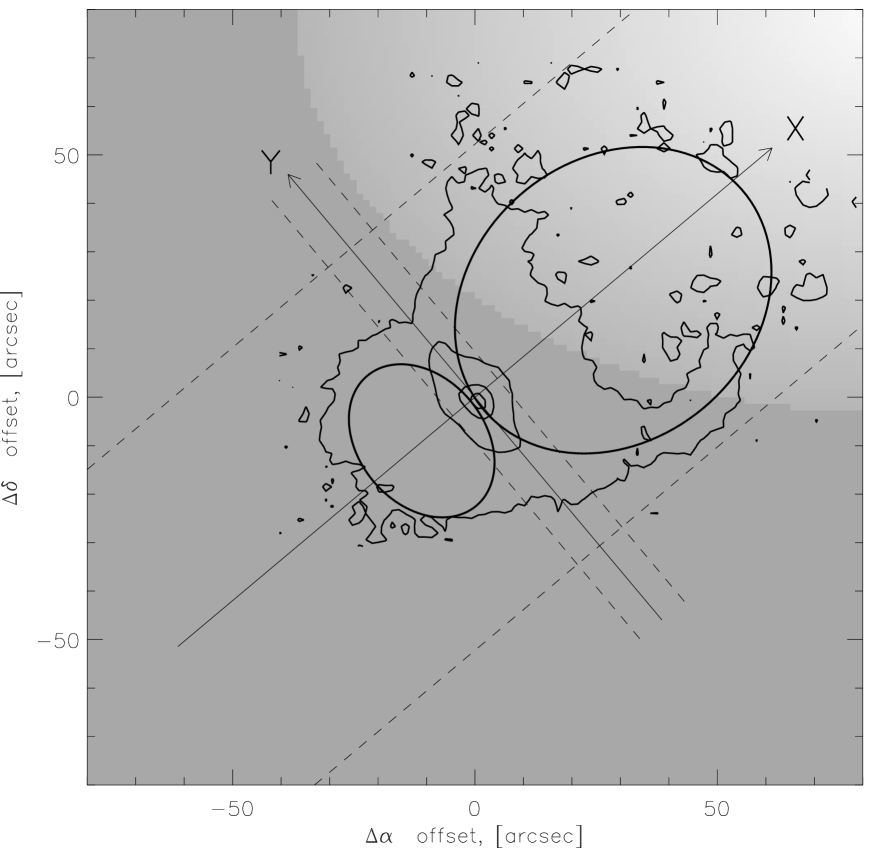
extended region of H I deficiency, which is clearly seen in the HI distribution from the 21-cm line emission obtained by Lake & Skillman (1989), argue for this model. The center of this “supercavity” in the H I distribution has the following coordinates: and ; its size is ( pc). The formation of such a supercavity may be associated with the preceding activity of stars in the region. If the H I deficiency is assumed to be caused by the sweeping up of gas, then the orientation of the nebula’s main body along the boundary of the hypothetical swept-up H I “supershell”, the southeastern shell in the region of a denser medium, and the extended weak northwestern shell in the medium of lower density inside the supercavity can be explained naturally.
The bipolar shell structure associated with the WO star in IC 1613 and its location relative to the H I supercavity are schematically shown in Fig. 4.
The analogy with an extensively studied galactic object also argues for the break out of a strong stellar wind into the region of reduced gas density: the bright shell swept up by the wind in a dense cloud and the “blister” produced by the wind burst through the cloud into a tenuous medium are also observed in the nebula G2.4+1.4 associated with the star of the same type, WR 102 (Dopita & Lozinskaya, 1990; Dopita et al.,1990).
An analysis of the parameters of the two shells associated with the WO star in IC 1613 yields the rough estimates that are in best agreement with the standard model of wind effect on the interstellar medium. The size of both shells ( pc and pc) is actually the only parameter that was reliably determined from observations. However, the fact that the ages of the two shells must be the same in the proposed model constraints significantly the range of possible values for the parameters.
The wind mechanical luminosity for the WO star in IC 1613 is (Kinsburgh & Barlow, 1995). This estimate is rather crude, because only the wind velocity was determined from observations, while the mass-loss rate ( M was estimated indirectly from the relation between the HeII-line luminosity and the outflow rate for two WO stars.
The typical density of the interstellar medium in the vicinity of the star can be estimated with the same uncertainty.
First, based on the emission from the brightest central part of S3 in size, Davidson & Kinman (1982) found the core density to be . Second, using the total Hα emission from the entire bright nebula, Kennicutt (1984) obtained a mean . Third, Goss & Lozinskaya (1995) estimated the mean density in the bright nebula S3 from the flux density of thermal radio emission to be .
Given the dense knots that we detected in the central core, all the three estimates give a lower limit on the density in the bright nebula. These estimates refer to the densest region of the central nebula, where, judging by the radial-velocity field presented above, the gas was not accelerated by the stellar wind because of the high density.
The mean ambient gas density in a large region around the WO star can be obtained from the 21-cm observations by Lake & Skillman (1989). Their map of the H I column-density distribution gives for the region of interest. For a thickness of the galactic gas disk of pc, this value corresponds to a mean density of . We estimated the gas-disk thickness from the following considerations. According to the optical B surface-brightness profile given in the above paper, the stellar surface density at a distance from the center is , while the total surface density of stars and gas is . The thickness of the gas disk can be roughly assumed to be (see, e.g. Zasov,1993 ). Since at a gas-disk thickness of pc in the solar neighborhood, we obtain pc in the WO region for IC 1613.
All these estimates are rather crude, but they show that the initial density in the vicinity of the WO star is unlikely to fall outside the range from to .
The expected ages (in units of years) and expansion velocities for the two outer shells in the standard model of a wind-blown bubble (Castor et al.,1975; Weaver et al.,1977) are given in the table for various initial densities at and pc and pc derived above.
| 5 | 1 | 0.1 | 0.01 | 0.001 | |
|---|---|---|---|---|---|
| 1.2 | 0.7 | 0.3 | 0.15 | 0.07 | |
| 28 | 46 | 100 | 218 | 460 | |
| 3.6 | 2.1 | 1.0 | 0.45 | 0.2 | |
| 18 | 30 | 63 | 140 | 300 |
As we see from the table, similar age estimates for the two shells, depending on the radius, provided that the expected expansion velocity is close to the observed values and , are obtained at an initial gas density for the brighter southeastern shell and for the weaker extended northwestern shell. These ranges of ambient gas densities seem quite reasonable. The ratio of ambient gas densities in the two shells swept up by the wind is determined from the ratio of their sizes more accurately than the density itself: .
The inferred age of the bipolar shell structure, years, is close to the lifetime of a massive WR star and exceeds appreciably the duration of the final WO stage. Note that the age was estimated for the WO wind intensity. The wind intensity at the preceding WR stage was most likely lower, which increases still further the age estimate for the shell. Thus, we conclude that the unique bipolar structure was most likely produced by the wind from the central star at the stage preceding WO. The WO superwind, which switches on inside the previously formed structure, is an additional source of energy. Since the shock wave triggered by the strong WO wind propagates in a medium of very low density inside the existing bipolar shells, the “secondary” shells swept up by them rapidly reach the denser regions at the boundary. The additional compression of gas by the shock wave triggered by the superwind gives rise to a filamentary structure, which is clearly seen in Figs. 3a and 3b in the southeastern shell and at the base of the northwestern shell.
5 Conclusion
Our Hα observations of the nebula associated with the WO star in the galaxy IC 1613 using a scanning Fabry-Perot interferometer on the 6m SAO telescope clearly revealed a giant bipolar shell structure outside the bright nebula S3. The sizes of the shell southeast of the bright nebula are pc; the northwestern shell is twice as large: pc. The object’s kinematics has been studied for the first time. We found evidence for expansion of both shells; the possible expansion velocities of the southeastern and northwestern shells are no less than and , respectively. Using the 4-m KPNO telescope (narrow-band Hα and [OIII] images), we detected a filamentary structure of both shells and several compact features in the S3 core.
We propose a self-consistent model for the formation of the giant bipolar structure by the wind from the central WO star located at the boundary of a dense supercavity in the galactic H I distribution.
-
Acknowledgements.
This study was supported by the Russian Foundation for Basic Research (project no. 98-02-16032) and the Program “Astronomy” (project no. 1.3.1.2). We wish to thank M. Dopita, who provided unpublished [OIII] images of the region, J. Boulesteix for the opportunity to use interference filters, and the 6m telescope committee for allocating observing time.
References
- [1] Armandroff, T. E. & Massey, P., 1985, ApJ, 291, 685
- [2] Barlow. M.J., Hummer V., 1982, IAU Symp.99,“Wolf-Rayet Stars: Observations, Physics, & Evolution” ( de Loore C. W. H. & Willis A. J. eds), 387
- [3] Boulesteix, J., 1993, “ADHOC Reference Manual” (Observatoire de Marseille, Marseille)
- [4] Castor, J., McCray, R., & Weaver, R., 1975, ApJ, 200, L107
- [5] D’Odorico, S., & Rosa, M., A & A,1982, 105, 410
- [6] Davidson, K., & Kinman, T. D., 1982, PASP, 94, 634
- [7] Dodonov, S. N., Vlasyuk, V. V., & Drabek, S. V., 1995, “Fabry-Perot Interferometer. User’s Guide”, (SAO, Nizhnii Arkhyz)
- [8] Dopita, M.A., McGregor, P. J., Lozinskaya, T. A., & Rawlings, S.J., 1990, ApJ,351, 563
- [9] Dopita, M.A., & Lozinskaya, T.A., 1990, ApJ, 359, 419
- [10] Garnett, D. R., Kennicutt, R. C., Chu, Y.-H., & Skillman, E. D., 1991, ApJ, 373, 458
- [11] Goss W. M., & Lozinskaya, T. A., 1995, ApJ, 439, 637
- [12] Hodge, P.,Lee, M. G., & Gurwell, M., 1990, PASP, 102, 1245
- [13] Hunter, D. A., Hawley, W. N., & Gallagher, J. S., 1993, AJ, 106, 1797
- [14] Kennicutt, R. C., 1984, ApJ, 287, 116
- [15] Kinsburgh, R. L., & Barlow, M. J., 1995, A & A, 295, 171
- [16] Lake, G., & Skillman, E.D., 1989, AJ, 98, 1274
- [17] Lozinskaya, T. A., 1986, “Supernovae and Stellar Wind: Interaction with Galactic Gas”, (Nauka, Moscow)
- [18] Lozinskaya, T. A., 1992, “Supernovae and Stellar Wind in the Interstellar Medium”, (AIP, New York)
- [19] Lozinskaya, T.A.,1997, Astrophys. Space Sci., 252, 199
- [20] Maeder, A., & Meynet, G., A & A, 1989, 210, 155
- [21] Melnik J., & Heydari-Malayeri, M., 1991, IAU Symp. 143, “WR Stars and Interrelations with Other Massive Stars in Galaxies, (Van der Hucht K. A. & Hidayat B. ets), 409
- [22] Polcaro, V. F., Viotti R., Rossi, C., & Norci, L.,1992, A & A, 265,563
- [23] Polcaro, V. F., Giovanelli, F.,Manchanda, R. K., et al., A & A, 1991, 252, 590
- [24] Saha, A., Freedman, W. L., Hoessel, J. G., & Mossman, A. E., 1992, AJ, 104, 1072
- [25] Sandage, A. R., 1971, ApJ, 166, 13
- [26] Smith, H. E., 1975, ApJ,199, 591
- [27] Tomita, A., Ohta, K., & Saito, M., 1993, PASJ, 45, 693
- [28] Torres, A. V., Conti, P. S., & P. Massey,1986, ApJ, 300, 379
- [29] Weaver, R., McCray, R., Castor, J., et al., 1997, ApJ, 218, 377
- [30] Zasov, A. V., 1993, “Physics of Galaxies” (MSU, Moscow, 1993, in russuain).