H Imaging with Hubble Space Telescope-NICMOS of an Elusive Damped Ly Cloud at = 0.6 111 Based on observations with the NASA/ESA Hubble Space Telescope obtained at the Space Telescope Science Institute, which is operated by Association of Universities for Research in Astronomy, Inc. under NASA contract NAS5-26555
Abstract
Despite previous intensive ground–based imaging and spectroscopic campaigns and wide-band HST imaging of the QSO 3C336 field, the galaxy that hosts the damped Ly system along this line–of–sight has eluded detection. We present a deep narrow-band H image of the field of this damped Ly absorber, obtained through the F108N filter of NICMOS 1 onboard the Hubble Space Telescope. The goal of this project was to detect any H emission 10 times closer than previous studies to unveil the damped absorber. We do not detect H emission between 0.05″ and 6″ (0.24 and 30 kpc) from the QSO, with a 3 flux limit of erg s-1 cm-2 for an unresolved source, corresponding to a star formation rate (SFR) of M⊙ yr-1. This leads to a 3 upper limit of 0.15 M⊙ yr-1 kpc-2 on the SFR density, or a maximum SFR of 1.87 M⊙ yr-1 assuming a disk of kpc in diameter. This result adds to the number of low redshift damped Ly absorbers that are not associated with the central regions of Milky-Way-like disks. Damped Ly absorption can arise from high density concentrations in a variety of galactic environments including some that, despite their high local Hi densities, are not conducive to widespread star formation.
1 Introduction
QSO absorption lines provide a powerful approach to studying the history of galaxies. The nature of damped Ly absorbers (DLAs) towards background QSOs has been an ongoing debate for more than a decade. Wolfe et al. (1986, 1995) proposed that DLAs are large progenitors of today’s massive spiral disks. Evidence in support of this interpretation includes the measurement of absorption line velocity profiles that are consistent with those expected from lines of sight intercepting rotating, thick gaseous disks (Prochaska & Wolfe, 1997). However, recent theoretical simulations of galaxy formation showed that a large range in structures (e.g. halo gas clouds) and morphologies, rather than a single uniform type of galaxy, can give rise to DLAs (e.g. (Katz et al., 1996; Haehnelt et al., 1998; McDonald & Miralda-Escudé, 1999)). In this case, they could be low surface brightness (LSB), gas rich, dwarf galaxies as proposed by Tyson (1988) and more recently by Jimenez et al. (1999).
DLAs make up the largest reservoir of neutral hydrogen (Hi) at high redshift (Wolfe et al., 1986; Lanzetta et al., 1991; Rao & Turnshek, 2000). There are hundreds of DLAs, defined as absorbers with atomic hydrogen column densities greater than cm-2, known up to redshifts . From the redshift distribution of the measured column densities of the damped systems, the evolution of neutral gas density () can be measured (Lanzetta et al., 1991, 1995; Wolfe et al., 1995; Storrie-Lombardi et al., 1996; Rao & Turnshek, 2000). The analysis of the variation of with redshift can provide another measurement of the evolution of the star formation rate in the Universe (Pei & Fall, 1995). Rao & Turnshek (2000) find little evolution in from to . Over this interval we might have expected a decrease in as the gas is converted into stars in order to maintain the observed constant star formation rate (Steidel et al., 1999). This led Rao & Turnshek (2000) to conclude that DLAs and the galaxies that dominate the star formation density are different populations.
Furthermore, it is difficult to reconcile the low metallicities of high-redshift DLAs (typically 1/10 of solar at , Pettini et al. (1997)) with the higher metallicities of stars in galaxies today: no chemical evolution is seen in DLAs from to (Pettini et al., 1999), which indicates that DLAs do not necessarily trace the population responsible for the bulk of star formation. Finally, high resolution Keck spectra of three QSOs by Pettini et al. (2000) indicate that DLAs () have heterogeneous chemical properties.
Another approach to understanding DLAs is to compare them with current local Hi surveys (Rao & Briggs, 1993; Zwaan et al., 1999; Rosenberg et al., 2000), which sample neutral gas clouds and galaxies perhaps analogous to distant DLAs (of course, high redshift and low redshift DLAs may be produced by very different galaxy populations). Current results (Zwaan et al., 1999; Rao & Turnshek, 2000) indicate that local Hi samples contain a much smaller fraction of high column densities ( cm -2) than both low and high redshift DLAs. These results imply strong evolution at the highest column densities. However, estimates of the local column density distribution rely on many caveats, such as the true nature of the debated local Hi mass function. Beam-smearing in these Hi surveys may also lead to underestimates of the local number of high column density systems, particularly if such regions are physically small.
Prior to 1993, most observations of DLAs were restricted to high redshift systems () since the Ly line is in the rest–frame UV. Previous attempts to detect emission from DLAs have concentrated on Ly (e.g., Lowenthal et al. (1995); see Roche, Lowenthal & Woodgate (2000) for a summary), which is expected to be a signature of a star-forming region, although its emission may be suppressed by dust extinction. Of at least ten DLAs at searched for Ly emission, only a very few show confirmed detections (Djorgovski et al., 1996; Fynbo, Burud & Møller, 2000). Ground based surveys (photometric and spectroscopic) for H emission around DLAs have also been mostly unsuccessful (Bunker et al., 1999; Teplitz, Malkan & McLean, 1998), except in some cases (Bechtold et al., 1998; Mannucci et al., 1998).
Only recently, with the advent of rest-UV spectroscopy from Hubble Space Telescope (HST), have data on intermediate redshift DLA systems become available (Le Brun et al., 1997; Boissé et al., 1998). These DLAs display a wide range of morphologies and surface brightnesses. Using NICMOS-NIC2, Kulkarni et al. (2000) reported a possible H detection of a DLA towards LBQS 1210+1731 and Pettini et al. (2000) detected an edge-on low luminosity galaxy 10 kpc away from the QSO 0058+019 () using WFPC2. In addition, ground based observations such as WIYN images of three low redshift DLAs () show dwarf and/or low surface brightness hosts, with confirmed redshifts (Rao & Turnshek, 1998; Lane et al., 1998).
In contrast, the larger class of Mgii absorbers with cm-2 (Lyman limit systems) are almost always associated with fairly luminous () galaxies, i.e. within kpc (Steidel et al., 1995). It was once thought that these different classes of absorbers sample different cross sectional regions of broadly the same galaxies (Steidel et al., 1993), with the DLAs associated with the inner, denser regions. This is only partially true. Dwarf and LSB galaxies apparently can produce DLA absorption at low impact parameters; however, they do not contribute a significant cross–section for Lyman limit absorption.
These issues motivate the current attempts to image DLAs at low impact parameter and, at the same time, might explain why most previous attempts have failed to reveal gas-rich spirals.
In this paper, we present an HST study of an intermediate redshift DLA () along the line-of-sight towards QSO 3C336 (=0.927) that has, so far, eluded detection entirely despite extensive ground-based searches (Steidel et al., 1997). This QSO line-of-sight is one of the richest known for absorption line studies, with metal line systems in the interval . For that reason this quasar field was the target of both a very deep s HST–WFPC2 image and a s Keck/NIRC image (Steidel et al., 1997). Five galaxies associated with the metal line systems were identified in the WFPC2 image and their redshifts confirmed spectroscopically using the Keck/LRIS (Steidel et al., 1997). The only unidentified absorber is a DLA at with cm-2 and . There is no galaxy detected with near the QSO line-of-sight and as close as 0.5″( kpc). Two unlikely candidate galaxies exist at large impact parameters from the QSO. The first is a relatively faint, (), late type spiral located 14.3″ ( kpc) NE of the QSO. Taking into account the estimated disk inclination and the position angle, Steidel et al. (1997) estimated it would require a disk extent of at least kpc to intercept the QSO line–of–sight. The second candidate is a galaxy without a confirmed redshift. If one assumes this galaxy is at the redshift of the DLA, it would have an impact parameter of kpc and (similar to that of the SMC).
This raises the question of whether DLA absorption can arise in dense Hi regions far from the centers of galaxies, perhaps in regions that have little or no current star formation, as seen locally in mergers (Hibbard & Yun, 1999) and as pointed out by Rao & Turnshek (2000). Alternatively, a separate absorbing galaxy could be situated beneath the QSO on the plane of the sky.
The goal of this project was to detect any H emission as close as ″( kpc) of the QSO to test further the alternate hypothesis. H at the redshift of this DLA matches one narrow–band filter of the HST-NICMOS camera 1 and, therefore, enables us to put strong constraints on the SFR of the absorber. We can already say there is no spiral galaxy close to the line-of-sight, for Steidel et al. (1997) did not find anything brighter than . On the other hand, one might expect a dwarf or LSB galaxy with significant star formation such as found by Le Brun et al. (1997) and Rao & Turnshek (2000) for other DLAs.
In the next section, we describe the observations and the reduction of the data. The results are given in section 3, and we compare them with previous studies in section 4. Our conclusions are presented in section 5. Throughout this paper, we adopt , , and km s-1 Mpc-1; thus 1″ at corresponds to kpc.
2 Observations and Data Reduction
2.1 Observations
The observations were carried out with the Near Infrared Camera and Multi-Object Spectrometer (NICMOS) using Camera 1 (NIC1) with Camera 2 (NIC2) in Attached Parallel mode on 1997 October 3. NIC1 (0.043″ pix-1) was chosen to enable us to over-sample the point spread function (PSF) (FWHM pix or 0.09″) and hence to resolve emission as close as possible to the QSO. The exposure times were 2.8hr (5 orbits) and 0.7hr for the filters F108N and F110M respectively (details are listed in Table 1). The pixel size is 0.043″ which at the redshift of the DLA corresponds to a physical size of kpc pixel-1.
For NIC1, we used the narrow–band (NB) F108N filter (m; m) and the broad–band (BB) F110M filter (m; FWHMm). F108N was chosen to match the wavelength of H at the redshift of the DLA () and the BB filter was chosen to subtract continuum emission. For NIC2, the filter F160W (m; FWHMm) was chosen but unfortunately, the field turned out to be in an especially empty region of the WFPC2 field (Steidel et al., 1997). The NIC2 images will not be discussed further here.
A reference star (GSC2044.810 from the STScI Guide Star Catalog) to measure the PSF was chosen within 100″ of QSO 3C336. GSC2044.810 has colors and , which are similar to that of a typical QSO at , i.e. =1.05 and =1.68 (Hyland & Allen, 1982). The star (=12.59) is mag brighter than the QSO, which allowed us to shorten exposure times.
Five dithered images of both the QSO and the reference star were taken in both NB and BB filters in order to improve the sampling of the PSF and to avoid any systematic noise from the detector. Each exposure was taken in the MULTIACCUM mode, which allows 25 non-destructive readouts over the entire dynamic range for each pixel. This allows improved cosmic ray rejection. Exposures were chosen to be short enough to avoid detector saturation.
2.2 Data reduction
The images of the QSO and the reference star were reduced, shifted and coadded with the Nicred222see http://cfa-www.harvard.edu/castles/Nicred for more information. package (McLeod, 1997). The zeroth read was subtracted from each raw image to remove any pedestal level, and dark subtraction was performed using the pipeline dark files provided by STScI. The photon arrival rate in each pixel was computed by fitting a straight line to the MULTIACCUM readouts. Cosmic rays were rejected by searching for a jump between successive readouts so that full information for each pixel is recovered. The images were then flat-fielded with the pipeline flat files provided by STScI. A sky frame was constructed from the dithered observations and subtracted from the images. Each image was magnified by a factor of 2 after masking the residual cosmic rays and bad pixels. Finally, the dithered images were registered and coadded – with a weight proportional to the inverse noise in a reference region close to the QSO image– to produce the final image (hereafter ”high SNR” images). The final result improved the SNR by a factor of compared to images reduced by the STScI pipeline calnica process. The FWHM of the PSF is 4.17 pixels (in the magnified images), which corresponds to 0.090″.
In order to perform absolute photometry on the QSO flux, i.e. to use the multiplying factors (PHOTFLAM) provided by STScI and to convert counts to flux units, we reduced the data using the dark and flat files listed as the Reference Files (used in the calibration of the P330E and G191-B2B 7691 data) prescribed by the NICMOS handbook v.3.0 (hereafter ”calibrated” images). To check for any correlation noise produced by the magnification process, we reduced the data without magnifying the pixels (hereafter ”small calibrated” images) with the same dark and flat files and we confirmed our noise figures (measured around the QSO) in the calibrated images. In the NB QSO field, the SNR was and , respectively for the high SNR, and calnica images. In the small calibrated and calibrated images, the SNR was . We used the high SNR images for PSF subtraction, while the noise properties were measured in the calibrated images. The calibrated image is shown in Figure 1.
2.3 Photometry and noise properties.
The total fluxes were obtained by measuring the curve of growth for each of the calibrated QSO images. We converted the fluxes measured within 0.5″ radius aperture to nominal infinite aperture fluxes by multiplying them by 1.15 as prescribed by STScI 333see http://www.stsci.edu/cgi-bin/nicmos/ under documents and handbook. See also Figures 4.6 to 4.10 from the NICMOS Instrument Handbook v3.0 Chapter 4..
In the NB calibrated image, the noise beyond the PSF is constant within a 2″–radius circle (from 10 to 50 pixels) around the QSO. Beyond a radius of 2″, the noise increases due to the poorer first quadrant of the NICMOS detector.
Our 3- detection limit for a point source is given by the 3- rms per resel (a resel or resolution element is a 0.09″ diameter aperture, corresponding to the FWHM of the PSF) measured in the quadrant of the image that includes the QSO. For the NB image, our 3- detection limit is: erg s-1 cm-2 Å-1(, where ), or a flux of erg s-1 cm-2. For the BB image, our 3- detection limit is: erg s-1 cm-2 Å-1(), or a flux of erg s-1 cm-2.
Our 3- detection limits for an extended source are given by the 3- rms per pixel scaled by the square root of the number of pixels in a 1″ by 1″ square. The resulting limits are erg s-1 cm-2 Å-1() in the NB image and erg s-1 cm-2 Å-1() in the BB image. These correspond to surface brightnesses of erg s-1 cm-2 arcsec-2 for the NB image and erg s-1 cm-2 arcsec-2 for the BB image.
The total flux densities of the QSO in the NB and the BB are erg s-1 cm-2 Å-1() and erg s-1 cm-2 Å-1(), respectively. These results are summarized in Table 2.
2.4 Profile subtraction
In order to reveal any faint object with small impact parameter, we subtracted the QSO PSF in the following ways:
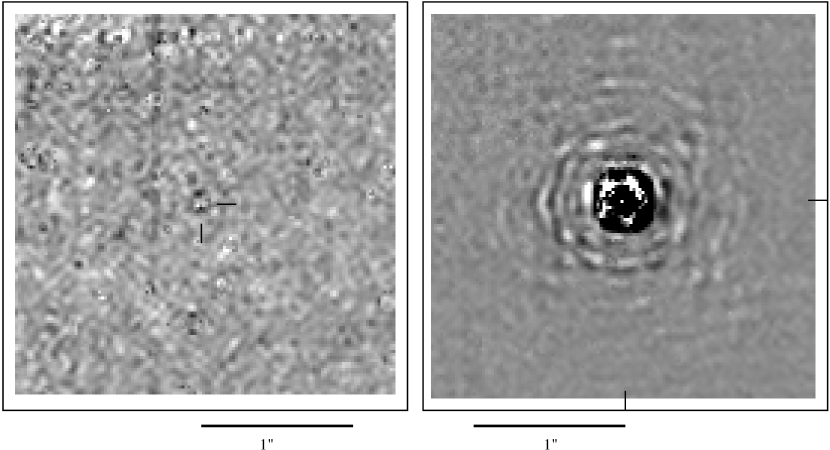
To search for faint emission both close to the QSO line of sight and throughout the 11″ field, we first subtracted the BB QSO image (scaled to the peak value) from the NB QSO image. The central part, shown on Figure 2 (a), has faint residuals (negative and positive peaks well below ) near the QSO position. The total residual flux measured in a resel centered on the QSO is about above the mean or 0.7% of the (unsubtracted) NB QSO flux in the same aperture.
To assess how much of those residuals might be due to differences in PSF between the F108N and F110M filters and how much to real H flux from a dwarf galaxy exactly superposed on the QSO position, we used the same procedure (i.e. shifting & centering) to subtract the BB PSF from the NB PSF of the reference star (GSC2044.810). We find residuals with a similar pattern (see Figure 2 (b)). There is clearly a peak near the center with a depression above and below (in the -direction). The stellar PSF residual pattern on larger scales is not seen in the QSO PSF subtracted image, since the SNR is more than ten times lower. The central peak pixel in the residuals is about 1.5% the flux of the stellar PSF peak, while the magnitude of the deepest depression is about -5% of the stellar PSF peak. The total residual flux measured in a resel centered on the position of the star is 0.7% of the NB stellar PSF flux in the same aperture, consistent with the QSO residuals. Therefore, we conclude the residuals are likely due to PSF differences between the two filters.
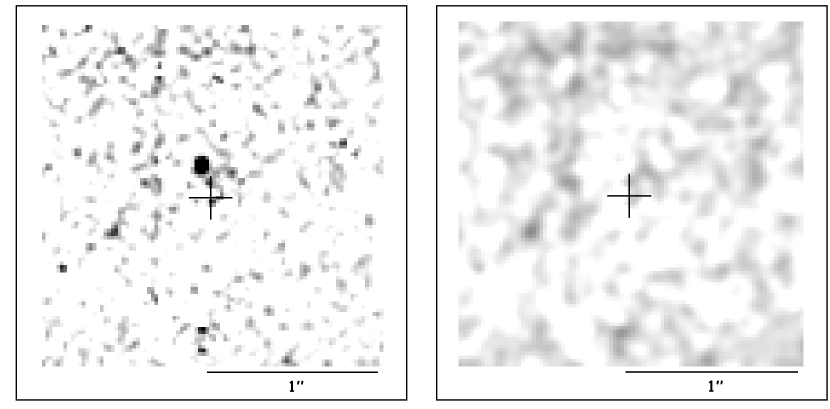
Because the stellar NB - BB method described above produced such significant residuals, we then tried subtracting a stellar PSF (scaled to the peak) directly from the QSO high SNR image. This was performed for both the NB and BB filters. We used both a theoretical PSF generated by the software Tiny Tim (Krist et al. (1997)444 The program and informations are available online at http://www.stsci.edu/software/tinytim ; adapted by Richard Hook for NICMOS) and the reference star (GSC2044.810) PSF. Unfortunately, the reference star turns out to be double, i.e. after the subtraction, a PSF-like hole was seen in both NB and BB images offset by 0.17″ from the central PSF (see Figure 3 (a)). We corrected for this by subtracting the primary component of the star PSF from the secondary component, and then subtracted the result from the QSO PSF. The final result shows very little residual (see Figure 3 (b)). However, when using the theoretical PSF instead, the result tends to leave a ring-like structure. For this reason, we adopted the stellar PSF as the best approximation of the true PSF. The final PSF subtracted NB image is shown in Figure 3 (b) after a gaussian smoothing of 1.5 pixels.
Finally, in the NB PSF subtracted image, we looked for faint emission throughout the 11″ field both by eye and using the algorithm SExtractor (Bertin & Arnouts, 1996) with a 3- threshold (with a minimum of 16 pixels above threshold, i.e. the keyword MINAREA in SExtractor). Three candidates were found. Every candidate was followed up by examining individual images and it turned out that all candidates were artifacts left over from the reduction process, e.g. cosmic ray residuals smeared out over several pixels by the magnification process.
3 Results and Discussion
To summarize, we looked for emission objects near the QSO and throughout the field in the following way: (i) We subtracted the BB image from the NB image. Apart from residuals due to PSF differences between the two filters, no emission was detected; (ii) We subtracted the star PSF from the QSO PSF in both NB and BB images. No emission was detected; (iii) We searched by eye for any faint emission throughout the 11″ field in both the NB PSF subtracted and the ’NB minus BB’ images; (iv) In the NB PSF subtracted image, we also used the algorithm SExtractor (Bertin & Arnouts, 1996) to look for faint emission. All three candidates were cosmic rays residuals smeared out over several pixels. Therefore, we conclude that no emission objects were detected in either the NB PSF subtracted, or in the ’NB minus NB’ image.
We can use the lack of detection in the BB image to constrain the presence of luminous galaxies. The BB 3- detection limit for a point source is , which corresponds to a continuum luminosity of erg s-1 in the rest frame –band or L⊙.
In addition, our lack of detection in the NB constrains directly the SFR. For the NB filter, our 3- detection limit for a point source (i.e. unresolved) corresponds to an H luminosity of erg s-1 at the redshift of the DLA. The 3- detection limit for an extended source corresponds to an H luminosity of erg s-1arcsec-2 at the redshift of the DLA (see Table 2). Using the Kennicutt (1983) conversion factor for a constant SFR and a modified Salpeter–like IMF with variable slope, i.e. erg s-1, we derive a SFR of M⊙ yr-1 for an unresolved source or M⊙ yr-1 kpc-2 for an extended source. Assuming the absorber is a disk of radius 2 kpc (i.e. times the resolution element; see discussion below), this gives a SFR of M⊙ yr-1.
More recently, the calibration of Kennicutt (1998) yields a similar conversion factor erg s-1. Our upper limit is a conservative one given that the actual SNR in the magnified images used in the subtraction process is higher than the calibrated images and that the conversion factor is the smallest of current estimates. The SFR estimate is also dependent on the IMF. Using a Salpeter IMF with a higher mass cutoff (125 M⊙), Alonso-Herrero et al. (1996) found erg s-1, which is about 3 times larger than the Kennicutt (1983) result. This would decrease our upper limit by a factor of three, i.e. a M⊙ yr-1 for a 2 kpc-radius disk.
This estimate depends strongly on the assumed size of the object. However, from Steidel et al. (1997), there can not be any galaxy (typically 10 kpc in size) as close as 0.5″( kpc). In other words, anything larger than 4 kpc (in diameter) would have been seen in both Steidel et al. (1997) and in our images. A 2 kpc-radius object is consistent with the size of the DLA candidate () of Kulkarni et al. (2000). Similarly, Le Brun et al. (1997; see section 4) detect compact objects with sizes of – kpc along DLA lines-of-sight. On the other hand, if the absorbing object is smaller, it could have a higher SFR. This would require that it be smaller than 1 resel or kpc, and that it be exactly aligned with the line of sight of the QSO.
4 Comparison with previous studies
We first discuss our result in the context of previous surveys of DLAs, and then compare our SFR limits to four types of galaxy seen in the local universe.
From HST imaging of the fields of seven quasars with DLAs at , Le Brun et al. (1997) were able to resolve galaxy–like objects at small impact parameters for six of their QSO lines-of-sight with . However, the hosts of these DLAs displayed a broad range of morphologies and surface brightnesses: three of the six detections are spirals, two are compact, LSB galaxies, and two others have compact morphologies. Recently, Pettini et al. (2000) reported the detection of an edge-on low luminosity or galaxy 10 kpc away from the QSO 0058+019 using HST–WFPC2. Using NICMOS-NIC2 Kulkarni et al. (2000) reported a possible detection of an H emission feature, – kpc in size, ″ from a DLA. They suggest that a faint, compact, somewhat clumpy object, rather than a thick, spiral disk, is responsible for this DLA. The implied 3- upper limit on the SFR is 4M⊙ yr-1, which applies unless dust obscuration is important. Note that we used the same conversion factor () as Kulkarni et al. (2000).
The ground-based spectroscopic survey of Bunker et al. (1999), which searched for redshifted H emission in 11″x2.5″ regions around 6 quasars with DLAs, reached a 3- detection limit of 6–18 M⊙ yr-1 and failed to detect any redshifted H emission. Some ground-based narrow-band photometric surveys (e.g., Teplitz, Malkan & McLean 1998) for H emission from DLAs have also failed to detect any emission line objects in the DLA fields, although Teplitz, Malkan & McLean (1998) found H emitters in the fields of some weaker non-DLA metal line systems. However, other narrow-band searches for H emission have revealed multiple objects in the DLA fields separated by more than several to tens of arcseconds from the QSO (Bechtold et al. (1998); Mannucci et al. (1998)). These surveys, which had 3- detection limits of – M⊙ yr-1, found these H emitting objects to have a wide range of SFRs, – M⊙ yr-1. Kulkarni et al. (2000) suggested the relatively large separations of these emission line objects from the quasar indicate that they are not the DLA absorbers themselves, but star-forming regions in a group or cluster also containing the DLA. None of these ground-based surveys has been able to probe the regions very close ( or kpc at ) to the quasar line-of-sight to rule out large spiral disks at high redshift with confidence.
The nature of the DLA towards 3C336 can be addressed by comparing directly our SFR upper limit to various types of galaxy in the local universe. (i) LSB galaxies have Hi surface densities of M⊙ pc-2 or cm-2 (van der Hulst et al., 1993), well above the DLA cutoff of cm-2 but below the value of cm-2 usually quoted as the threshold for star formation. The mean star formation rates, derived from the H luminosities, in LSBs are typically M⊙ yr-1 (van den Hoek et al., 2000). (ii) Blue compact dwarf galaxies (BCDG): From CFHT observations, Petrosian et al. (1997) reported a SFR of – M⊙ yr-1 kpc-2 for the two main H emitting regions of the local ( Mpc) BCDG, IZW 18; (iii) Typical spiral galaxies: The typical SFR for a spiral galaxy is M⊙ yr-1 (van den Hoek et al., 2000), spread over at least several kpc; (iv) Starbursts can have a much larger SFR, e.g. Arp 220 is forming stars at a rate of M⊙ yr-1, derived from Ly (Anantharamaiah et al., 2000). The SFR in the DLA at toward 3C336 is far less extreme than in a starburst or a typical spiral, and somewhat less extreme than a BCDG. However, it is consistent with that of an LSB galaxy and it could be even lower, i.e. zero.
Another example of a region of neutral hydrogen that exceeds the DLA threshold, but does not have significant star formation, has been found through 21-cm observations of the giant Hi cloud 1225+0146 (Giovanelli & Haynes, 1989); these data show that neutral gas structures with little or no star formation do exist. This suggests that factors beyond a simple column density threshold govern the formation of stars. This giant Hi cloud is 200 kpc along its major axis and has two peaks of Hi emission, with and cm-2, separated by 100 kpc. In a deep optical search, only a faint dwarf irregular, 5 kpc in extent, was discovered, corresponding to the largest peak in emission (McMahon et al., 1990). Furthermore, no galaxy has been detected near the cm-2 peak, which is almost enough neutral hydrogen to produce a DLA.
The absorption line properties of the DLA towards 3C336 corroborate the observed low SFR. This DLA is unusual in that it is a “Civ–deficient” Mgii absorber — rest frame equivalent width Å (Steidel et al., 1997)—, i.e. is less than half the typical value for DLAs. Churchill et al. (1999) found a correlation between the strength of Civ absorption and the kinematic spread of the Mgii profile in high resolution absorption profiles, with the exception of several Civ–deficient absorbers. They hypothesize that there is a relationship between the strength of Civ absorption (which is generally consistent with arising in a corona similar to that around the Milky Way disk) and the level of star formation activity in the disk. The kinematic spread of the Mgii profile is also thought to be related to star forming processes that either eject or are triggered by high velocity Mgii clouds. In this scenario, the Civ deficient absorbers would be characterized by a lower than average star formation rate, and in fact a few of them do have red colors (Churchill et al., 2000), rather than the blue colors of actively star-forming systems. This is consistent with the fact that the 3C336 DLA has both a small and a strong limit on the star formation rate in its vicinity.
There is at least some theoretical reason to expect low SFRs from DLAs. Mo, Mao & White (1999) hypothesize that — at least at — Lyman break galaxies (LBGs), which are selected partly by their strong star formation, and DLAs could be disjoint populations: If LBGs are the central galaxies of massive dark halos at , then they should be small objects with substantial star formation but low angular momentum, while DLAs should be biased towards objects with large angular momentum. In the hierarchical structure formation models of Maller et al. (2000), meanwhile, DLAs arise from the combined effects of massive central galaxies and a number of smaller satellite galaxies in virialized halos, rather than only the central galaxies, so predicted SFRs associated with DLAs are low. Another interesting result from Maller et al.’s models is that the impact parameter distribution has a longer tail at (up to 150 kpc) than at redshift , which could then reconcile the observed galaxy 120 kpc away from the line-of-sight of 3C336 and the absorber.
5 Summary and Conclusions
We can summarize previous observational results on DLAs as follows: (i) DLAs show little evolution of from to (Rao & Turnshek, 2000); (ii) DLAs show little metallicity evolution (Pettini et al., 1999) from to ; (iii) DLAs have heterogenous chemical properties (Pettini et al., 2000); (iv) DLAs have various morphologies (Le Brun et al., 1997; Kulkarni et al., 2000; Rao & Turnshek, 2000) (although it is possible that at least some DLAs are large disks like the galaxies found by Le Brun et al. (1997) and Pettini et al. (2000)). These results are inconsistent with the standard, DLA/Hi disk paradigm(Wolfe et al., 1995) for they indicate that DLAs (1) do not participate in the overall chemical enrichment of the universe and hence do not trace star formation; and (2) are not characteristic of a particular type of galaxy. Rather they are merely characteristic of a particular type of region: namely one with a large neutral column density (e.g. Khersonsky & Turnshek (1996)). It is quite reasonable, following the results of Rao & Turnshek (2000), to assume that this applies to higher redshift DLAs as well.
Nearly all space-based observations of low redshift DLAs have revealed star formation in some sort of galaxy. The system toward 3C336 is an exception. Our lack of detection of any source with SFR greater than 0.28 M⊙ yr-1, or M⊙ yr-1 kpc-2, demonstrates that DLAs with very little star formation can exist.
As evidence mounts against the standard, DLA/Hi disk scenario, we must address the question: “What is a DLA?”. Possibilities not yet ruled out include knots of Hi hundreds of kpc away from the main galaxy as seen locally (Hibbard & Yun, 1999); small compact dwarfs or LSBs; or photo-dissociation regions that may produce much of the Hi currently observed in galaxy disks (Smith et al., 2000). In some cases, both a cold (hundreds of K) and a warm (thousands of K) neutral medium are found along the line of sight through a DLA, based upon analysis of 21–cm emission profiles (Lane, Briggs, & Smette, 2000), while in others the warm phase dominates.
Our limits on H emission from the DLA towards 3C336 set the tightest constraints yet on star formation in a compact absorber at intermediate redshift, and probe closer to the QSO line-of-sight than any previous study. Our non-detection adds to the mounting evidence that low redshift DLAs are made of galaxies of diverse morphologies, luminosities and surface brightnesses rather than a uniform population of luminous disk galaxies.
References
- Alonso-Herrero et al. (1996) Alonso-Herrero, A., Aragón-Salamanca, A., Zamorano, J., & Rego, M. 1996, MNRAS, 278, 417
- Anantharamaiah et al. (2000) Anantharamaiah, K. R., Viallefond, F., Mohan, N. R., Goss, W. M., & Zhao, J. H. 2000, ApJ, 537, 613
- Bechtold et al. (1998) Bechtold, J., Elston, R., Yee, H. K. C., Ellington, E., & Cutri, R. M. 1998, in The Young Universe: Galaxy Formation and Evolution at Intermediate and High Redshift, ed. S. D’Odorica, A. Fontana, and E. Giallongo, ASP Conf. Series, (PASP), 146, 241
- Bertin & Arnouts (1996) Bertin, E., & Arnouts, S. 1996, A&A, 117, 393
- Boissé et al. (1998) Boissé, P., Le Brun, V., Bergeron, J., & Deharveng, J-M. 1998, A&A, 333, 841
- Bunker et al. (1999) Bunker, A. J., Warren, S. J., Clements, D. L., Williger, G. M., & Hewett, P. C. 1999, MNRAS, 309, 875
- Churchill et al. (1999) Churchill, C. W., Mellon, R. R., Charlton, J. C., Jannuzi, B. T., Kirhakos, S., Steidel, C. C., and Schneider, D. P. 1999, ApJ, 519, L43
- Churchill et al. (2000) Churchill, C. W., Mellon, R. R., Charlton, J. C., Jannuzi, B. T., Kirhakos, S., Steidel, C. C., and Schneider, D.P. 2000, ApJ, 543, 577
- Djorgovski et al. (1996) Djorgovski, S. G., Pahre, M. A., Bechtold, J., & Elston, R. 1996, Nature, 382, 234
- Fynbo, Burud & Møller (2000) Fynbo, J. U., Burud, I., & Møller, P. 2000, A&A, 358, 88
- Giovanelli & Haynes (1989) Giovanelli, R., & Haynes, M. P. 1989, ApJ, 346, L5
- Haehnelt et al. (1998) Haehnelt, M. G., Steinmetz, M., & Rauch, M. 1998, ApJ, 495, 647
- Hibbard & Yun (1999) Hibbard, J. E., & Yun, M. S. 1999, ApJ, 118, 162
- Hyland & Allen (1982) Hyland, A. R., & Allen, D. A. 1982, MNRAS, 199, 943
- Jimenez et al. (1999) Jimenez, R., Bowen, D. V., & Matteucci, F. 1999, ApJ, 514, 83L
- Katz et al. (1996) Katz, N., Weinberg, D. H., Hernquist, L., & Miralda-Escudé, J. 1996, ApJ, 457, 57L
- Kennicutt (1983) Kennicutt, R. C. Jr 1983, ApJ, 272, 54
- Kennicutt (1998) Kennicutt, R. C. Jr 1998, ARA&A, 36, 189
- Khersonsky & Turnshek (1996) Khersonsky, V. K., & Turnshek, D. A. 1996, ApJ, 471, 657
- Krist et al. (1997) Krist, J., & Hook, R.,
- Kulkarni et al. (2000) Kulkarni, V. P., Hill, J. M., Schneider, G., Weymann, R. J., Storrie-Lombardi, L. J., Rieke, M. J., Thompson, R. I., & Jannuzi, B. T. 2000, ApJ, 536, 36
- Lane, Briggs, & Smette (2000) Lane, W. M., Briggs, F. H., & Smette, A. 2000, ApJ, 532, 146
- Lane et al. (1998) Lane, W., Smette, A., Briggs, F., Rao, S., Turnshek, D., & Meylan, G. 1998, AJ, 116, 26
- Lanzetta et al. (1991) Lanzetta, K. M., McMahon, R. G., Wolfe, A. M., Turnshek, D. A., Hazard, C., & Lu, L. 1991, ApJS, 77, 1
- Lanzetta et al. (1995) Lanzetta, K. M., Wolfe, A. M., & Turnshek, D. A. 1995, ApJ, 440, 435
- Le Brun et al. (1997) Le Brun, V., Bergeron, J., Boissé, P., & Deharveng, J. M. 1997, A&A, 321, 733
- Lowenthal et al. (1995) Lowenthal, J. D., Hogan, C. J., Green, R. F., Woodgate, B. E., Caulet, A., Brown, L., & Bechtold, J. 1995, ApJ, 451, 484
- Maller et al. (2000) Maller, A. H., Prochaska, J. X., Sommerville, R. S., & Primack, J. R. 2000, in Clustering at high redshift, ASP vol. 200, Eds A. Mazure
- Mannucci et al. (1998) Mannucci, F., Thompson, D., Beckwith, S. V. W., & Williger, G. M. 1998, ApJ, 501, 11L
- McDonald & Miralda-Escudé (1999) McDonald, P., & Miralda-Escudé, J. 1999, ApJ, 519, 486
- McLeod (1997) McLeod, B. in 1997 HST Calibration Workshop, ed. S. Casertano et al., p. 281
- McMahon et al. (1990) McMahon, R. G., Irwin, M. J., Giovanelli, R., Haynes, M. P., Wolfe, A. M., & Hazard, C. 1990, ApJ, 359, 302
- Mo, Mao & White (1999) Mo, H. J., Mao, S., & White, S. D. M. 1999, MNRAS, 304, 175
- Pei & Fall (1995) Pei, Y. C., & Fall, S. M. 1995, ApJ, 454, 69
- Pettini et al. (1997) Pettini, M., Smith, L. J., King, D. L., & Hunstead, R. W. 1997, ApJ, 486, 665
- Pettini et al. (1999) Pettini, M., Ellison, S. L., Steidel, C.C., & Bowen, D. 1999, ApJ, 510, 576
- Pettini et al. (2000) Pettini, M., Ellison, S. L., Steidel, C.C., Shapley, A. E, & Bowen, D.V. 2000, ApJ, 532, 65
- Petrosian et al. (1997) Petrosian, A. R., Boulesteix, J., Comte, G., Kunth, D., & Lecoarer, E. 1997, A&A, 318, 390
- Prochaska & Wolfe (1997) Prochaska, J. X, & Wolfe, A. M. 1997, ApJ, 487, 73
- Rao & Briggs (1993) Rao, S. M., & Briggs, F. H. 1993, ApJ, 419, 515
- Rao & Turnshek (1998) Rao, S. M. & Turnshek, D. A. 1998, ApJ, 500, L115
- Rao & Turnshek (2000) Rao, S. M. & Turnshek, D. A. 2000, ApJS, 131, 1
- Roche, Lowenthal & Woodgate (2000) Roche, N., Lowenthal, J. D., & Woodgate, B. E. 2000, MNRAS, 317, 937
- Rosenberg et al. (2000) Rosenberg, J., & Schneider, S. 2000, private communication.
- Smith et al. (2000) Smith, D. A., Allen, R. J., Bohlin, R. C., Nicholson, N., Stecher, T. P. 2000, ApJ, 538, 608
- Steidel et al. (1993) Steidel, C. C. 1993, in The Environment and Evolution of Galaxies, eds. J. M. Shull & H. A. Thronson, Jr. (Dordrecht : Kluwer), 263
- Steidel et al. (1995) Steidel, C. C, Pettini, M., Dickinson, M., & Persson, S. E. 1995, AJ, 108, 2046
- Steidel et al. (1997) Steidel, C. C, Dickinson, M., Meyer, D. M., Adelberger, K. L., & Sembach, K. R 1997, ApJ, 480, 568
- Steidel et al. (1999) Steidel, C. C., Adelberger, K. L., Giavalisco, M., Dickinson, M., & Pettini, M. 1999, ApJ, 519, 1
- Storrie-Lombardi et al. (1996) Storrie-Lombardi, L. J., McMahon, R. G., & Irwin, M. J. 1996, MNRAS, 283, 79L
- Teplitz, Malkan & McLean (1998) Teplitz, H. I., Malkan, M., & McLean, I. S. 1998, ApJ, 506, 519
- Tyson (1988) Tyson, N.D. 1988, ApJ, 329, 59
- van den Hoek et al. (2000) van den Hoek, L. B., de Blok, W. J. G., van der Hulst, J. M., & de Jong, T. 2000, A&A, 357, 397
- van der Hulst et al. (1993) van der Hulst, J. M., Skillman, E. D., Smith, T. R., Bothum, G. D., McGaugh, S. S., & de Blok, W. J. G. 1993, AJ, 106, 548
- Wolfe et al. (1986) Wolfe, A. M., Turnshek, D. A., Smith, H. E., & Cohen, R. D. 1986, ApJS, 61, 249
- Wolfe et al. (1995) Wolfe, A. M., Lanzetta, K. M., Foltz, C. B., & Chaffee, F.H. 1995, ApJ, 454, 698
- Zwaan et al. (1999) Zwaan, M. A., Verheijnen, M. A. W., & Briggs, F. H. 1999, PASA, 20, 100

| F108N | F110M | |
|---|---|---|
| Object | (s) | (s) |
| 3C336 | s | s |
| GSC2044.810 | s | s |
| GSC2044.810 | s |
| Parameter | Value |
|---|---|
| QSO (=0.927) | |
| R.A., decl. (J2000) | |
| (1.08 m) (erg s-1 cm-2 Å-1) | |
| (mag) | |
| (1.10 m) (erg s-1 cm-2 Å-1) | |
| (mag) | |
| Upper Limits on Continuum Emission at | |
| (1.10 m) (erg s-1 cm-2 Å-1) | |
| (mag) | |
| (Unresolved source) (erg s-1 cm-2) | |
| (Unresolved source) ( erg s-1) | |
| Upper Limits on H Emission from the Damped Ly Cloud (0.656) | |
| (1.08 m) (erg s-1 cm-2 Å-1) | |
| (mag) | |
| (point source) (erg s-1 cm-2) | |
| (point source) ( erg s-1) | |
| SFR (point source) ( M⊙ yr-1) | |
| (3) (erg s-1 cm-2arcsec-2) aaH surface brightness. | |
| ( erg s-1 arcsec-2) bbH surface luminosity. | |
| (erg s-1kpc-2) bbH surface luminosity. | |
| Surface SFR ( M⊙ yr-1kpc-2) | |
| SFR (r=2kpc disk) (M⊙ yr-1) | |