The globular cluster system of the young elliptical NGC 6702
Abstract
We study the globular cluster (GC) system of the dust-lane elliptical galaxy NGC 6702, using , and -band photometric observations carried out at the Keck telescope. This galaxy has a spectroscopic age of Gyrs suggesting recent star-formation. We find strong evidence for a bimodal GC colour distribution, with the blue peak having a colour similar to that of the Galactic halo GCs. Assuming that the blue GCs are indeed old and metal–poor, we estimate an age of 2–5 Gyrs and supersolar metallicity for the red GC subpopulation. Despite the large uncertainties, this is in reasonable agreement with the spectroscopic galaxy age. Additionally, we estimate a specific frequency of for NGC 6702. We predict that passive evolution of NGC 6702 will further increase its specific frequency to within 10 Gyrs, in closer agreement to that of typical present-day ellipticals. We also discuss evidence that the merger/accretion event that took place a few Gyrs ago involved a high gas fraction.
keywords:
globular clusters: general – galaxies: individual: NGC 6702 – galaxies: star clusters.1 Introduction
The ‘merger’ hypothesis, postulating that elliptical galaxies form by spiral galaxy mergers, was first proposed by Toomre & Toomre (1972). This scenario has gained new impetus over the last few years by both numerical simulations (e.g. Barnes 1992; Hernquist 1992; Mihos & Hernquist 1996) and observational studies, suggesting that the properties of merger remnants are consistent with those of ellipticals (e.g. Toomre 1977; Schweizer et al. 1990; Casoli et al. 1991; Schweizer & Seitzer 1992; Hibbard & van Gorkom 1996; Georgakakis, Forbes & Norris 2000).
However, one of the long standing drawbacks of the ‘merger’ hypothesis is the excess globular clusters (GCs) per unit starlight around ellipticals compared to spirals (van den Bergh 1984). To overcome this problem Schweizer (1987) and Ashman & Zepf (1992) suggested that the starburst activity usually experienced during gas-rich mergers will form new GCs and thus increase their number compared to their progenitors. Indeed, there is accumulating observational evidence supporting this scenario in on-going mergers (e.g. Lutz 1991; Whitmore et al. 1993; Whitmore & Schweizer 1995; Schweizer 1996; Miller et al. 1997; Zepf et al. 1999; Forbes & Hau 2000). However, the situation in ellitpical galaxies (the eventual product of mergers) is less clear. Although many ellipticals have been observed to have bimodal colour distributions, when examined in detail their GC properties do not match those from the merger picture (Forbes et al. 1997). Outstanding questions include whether the newly formed GCs survive and whether the final GC system resembles that of typical (old) ellipticals. Probing the GC properties in intermediate age merger-remnants (1–5 Gyrs) may be of key importance for addressing these issues. Indeed, such young ellipticals may provide the link between on-going mergers and relaxed ellipticals.
For example, a sample of merger–remnants spanning a range of ages will allow study of the chronological development of the system’s specific frequency (measuring the number of globular clusters per unit starlight) in comparison with that of evolved ellipticals. Young ellipticals are also expected to have two distinct GC populations with different colour and magnitude distributions. By exploiting these differences one can attempt to age-date the newly formed GCs, which in turn can be compared to the time since the gaseous merger. Indeed, studies of the dynamically young proto-ellipticals NGC 1700 and NGC 3610 have shown the presence of bimodality in their colour distributions (Whitmore et al. 1997; Brown et al. 2000). Also the age of the new GCs, although model dependent, is found to be similar to estimates for the galaxy age based on spectroscopic or dynamical arguments.
In this paper we study the globular cluster system of the elliptical galaxy NGC 6702. Lauer (1985) found a dust lane in the centre of NGC 6702 indicating a recent gaseous merger event. This galaxy is also relatively luminous at far-infrared wavelengths compared to other elliptical galaxies, with (Wiklind et al. 1995). Terlevich & Forbes (2000) have estimated a spectroscopic age and metallicity of about 2 Gyrs and respectively for NGC 6702 suggesting that it is a young elliptical. The main observational properties of NGC 6702 are given in Table 1.
Additionally, according to the NED database the nearest galaxy projected on the sky that is either brighter or no more than 2 magnitudes fainter, than NGC 6702 is NGC 6703 at a projected distance of 10 arcmin. However, as NGC 6702 has a recession velocity of and NGC 6703 has they are actually separated by some 30 Mpc assuming no peculiar motions. The nearest galaxy with a similar recession velocity is NGC 6711 () with a separation of arcmin or over 2 Mpc. Other galaxies listed by NED are more than 2 magnitudes fainter than NGC 6702. Thus NGC 6702 is an example of an isolated elliptical galaxy with no comparable galaxies within 2 Mpc. Such galaxies are fairly rare and hence their evolutionary history is of some interest. In particular, ellipticals in low density environments are interesting within the hierarchical merger framework as they are expected to have assembled much more recently than their cluster counterparts (Kauffmann & Charlot 1998). Any merger would be expected to have occurred in the more recent past and involved progenitors that have largely processed gas into stars.
In section 2 the observations, data reduction and the isophotal properties of NGC 6702 are presented. Section 3 describes the candidate GC selection, while section 4 presents our results which are discussed in section 5. Finally, section 6 summarises our conclusions. Throughout this paper we adopt .
| Name | RA (J2000) | DEC (J2000) | l | b | type | heliocentric | distance | ||
|---|---|---|---|---|---|---|---|---|---|
| (RC3) | velocity () | modulus | (mag) | (mag) | |||||
| NGC 6702 | E 3 | 4727 | 34.00 | 13.04 | 12.15 |
2 Observations and data reduction
2.1 Description of the data
Broad-band imaging of NGC 6702 in the , and filters was carried out at the Keck-II telescope on 1999 August 17, using the the Low Resolution Imaging Spectrometer (LRIS; Oke et al. 1995). The LRIS instrument, equipped with a TEK CCD, is mounted on the Cassegrain focus providing a imaging scale and a field–of–view. The total exposure time in the , and filters was 3600, 1800, and 1200 sec respectively, segregated into three separate integrations of 1200, 600 and 400 sec respectively. The seeing at the time of the observations varied between 0.8 to 1 arcsec.
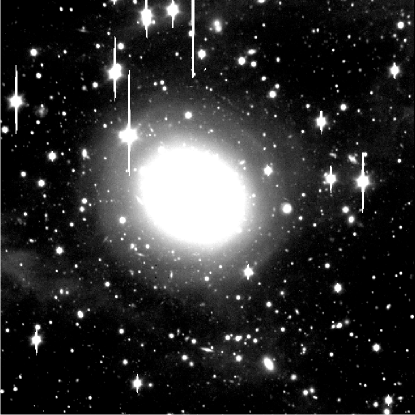
The data were reduced following standard procedures, using IRAF tasks. The reduced images are found to be flat to better than . The final -band image of NGC 6702 is shown in Figure 1. Photometric calibration was performed using standard stars from Landolt (1992). The photometric accuracy, estimated using these standard stars, is mag in all three bands. We adopt a Galactic extinction in the NGC 6702 direction of , taken from Burstein & Heiles (1984). Assuming a standard reddening curve (Savage & Mathis 1979), we correct each magnitude for Galactic extinction using the values , and mag.
2.2 Galaxy surface brightness profile
The -band surface brightness profile, , of NGC 6702 is plotted in Figure 2. This has been determined by fitting ellipses to the galaxy intensity profile using the ISOPHOTE task within STSDAS. During the ellipse fitting process the centre of the galaxy was kept fixed and a clipping algorithm was employed. Also, bright objects as well as the central saturated parts of the galaxy, were masked out. The position angle (PA) and ellipticity () were fitted at each radius, until S/N constraints terminated the fitting process at low surface brightness. For NGC 6702 this occurs at an equivalent radius (, where is the semi-major axis). Beyond that radius the position angle and ellipticity were kept constant. The sky level was determined using the method described by Goudfrooij et al. (1994).
Although the isophotes of elliptical galaxies are well approximated by ellipses, deviations at the few per cent level are common. Such deviations are often quantified by the 4th sine and cosine amplitudes (S4 and C4 respectively) of the Fourier transform of the galaxy intensity at a given radius. The standard interpretation of the residual C4 terms is that they indicate either the presence of a weak underlying disk if positive or boxiness if negative. However, it has been emphasised that both C4 and S4 terms should be considered when estimating the isophotal shape of galaxies (Franx et al. 1989; Peletier et al. 1990; Goodfrooij et al. 1994). For example, the presence of a disk, bar or ring with a significant position angle twist relative to the elliptical galaxy semi-major axis is expected to give both positive and negative C4 and/or S4 terms, depending on its orientation. Consequently, in the case of such projection effects we expect S4 terms to be significant.
Figure 3 plots the ellipticity, position angle as well as C4 and S4 terms as a function of radius for NGC 6702 in the -band. Similar trends are apparent for the and -bands. The C4 term is negative at small galactocentric distances, indicating boxiness, i.e. excess light at 45o relative to the semi-major axis. This is partly due to the presence of the dust lane in the core of NGC 6702 (Lauer 1985) lying perpendicular to the semi-major axis and extending out to . The S4 term is also non-zero within the same range of , albeit with a smaller amplitude. Masking out the dust lane reduces the amplitude of both the C4 and S4 terms. These terms are also non-zero (S4 positive and C4 negative) at indicating boxiness. At larger distances () both the C4 and S4 deviate significantly from the elliptical symmetry, but this is likely to be an artifact arising from the low S/N at these radii.


2.3 Source extraction and completeness limits
To detect sources superimposed on NGC 6702 we subtract the galaxy light profile using a median filter technique. Firstly, the reduced image for each filter is smoothed using a median rectangular filter with a size of 40 pixels. The smoothed image is then subtracted from the original frame and the resulting image is subsequently used for source extraction and photometry.
The sources in the reduced frames were extracted using the SExtractor package (version 2.1.0; Bertin & Arnouts 1996). The main input parameters are the detection threshold, given as a multiple of the sky variance () and the minimum area in pixels for an object to be extracted. After considerable experimentation, we adopted a threshold of 2.5 and a minimum area of 10–15 pixels (0.5–0.7 arcsec2). This choice of values minimises the number of spurious detections, while ensuring that faint objects are successfully extracted. A total of 1455, 1456 and 1494 sources were extracted form the , and frames respectively. The photometric catalogues generated for each waveband were then matched, resulting in a total of 939 common detections in all three filters, , and . This source list is referred to as the matched catalogue. Using this catalogue we performed photometry using the PHOT task. After a curve–of–growth analysis on several sources an aperture of 8 pixels radius was employed with the background estimated from an annulus of 15 to 20 pixels around each source. For unresolved sources the 8 pixels radius aperture magnitude is close to total.
The completeness limit in a given filter is estimated by adding artificial point sources of different magnitudes to the original image, using MKOBJECTS task. Then we attempt to recover the artificial objects using SExtractor package, with the same parameter settings as with those adopted for the real data. A total of 1500 point sources were added to a given filter frame. To avoid overcrowding the frame, artificial sources are added in groups of 150 and the process is repeated 10 times. The results are presented in Figure 4, plotting the fraction of recovered objects as a function of magnitude in the , and filters respectively. The completeness limits in the , and filters are found to be , and mag respectively. The mean photometric error at these magnitude limits is mag for all three filters. We have also investigated variations of the completeness limits due to the increased background close to the galaxy centre. A method similar to that described above was adopted, with artificial point sources being added within successive elliptical rings centred on NGC 6702 and having the same mean ellipticity and position angle as the galaxy (, PA=145∘). The effect of galaxy background was found to be small except for . However, this is close to the saturated region of the CCD images which is masked out in our analysis. Therefore, the lower sensitivity close to the galaxy center will not affect the results from this study.

3 Selection of globular cluster candidates
Globular cluster candidates are selected from the matched catalogue on the basis of their expected range in colour and magnitude. In particular, the full range of possible globular cluster metallicities is . Using the colour–metallicity relation of Couture et al. (1990) and Kissler-Patig et al. (1998), the above mentioned metallicity interval corresponds to and . Figures 5 and 6 plot the and colours against respectively, for the objects in the matched catalogue. The horizontal lines in these figures represent the above mentioned and colour cutoffs. Also shown are the regions of the parameter space occupied by the Galactic GCs (Harris 1996; corrected for Galactic reddening). The accepted range of colour for globular cluster selection is chosen to span the colour range of the Galactic GCs. Additionally, using the population synthesis models of Worthey (1994) we find that the , and colours of a stellar population of a given age get redder with increasing metallicity in the direction indicated by the arrows in Figures 5 and 6.
Globular cluster candidates are selected on the basis of their photometric colours if they lie within the regions indicated in Figures 5 and 6, adopting a uncertainty on each colour given by the PHOT software. A total of 374 candidate GCs are selected. These objects are then visually inspected to discard resolved sources, likely to be galaxies, and sources lying near hot pixels. The final list consists of 205 candidate GCs. Although visual inspection is not an objective method for identifying point sources, we believe that to the first approximation we successfully eliminate background galaxies from the GC catalogue. This is demonstrated in Figure 7 plotting an estimator of the spatial extent of a source as a function of -band magnitude. The size of a source is estimated by the difference between the -band magnitude measured within 3 and 8 arcsec radius apertures. It is clear from Figure 7 that visually classified resolved sources are separated from point-like objects, particularly at bright magnitudes. At fainter magnitudes ( mag), however, the visual classification scheme becomes more uncertain. Also note that point sources brighter than mag are likely to have saturated cores.


Additionally, we apply a bright magnitude cutoff set to mag brighter than the most luminous Milky Way GC (-Cen; mag), shifted to the distance of NGC 6702. This is because NGC 6702 has a young stellar component, with an estimated spectroscopic age of Gyrs (Terlevich & Forbes 2000). Therefore, NGC 6702 may possess a number of young metal–rich GCs, expected to be significantly brighter than the old metal–poor GCs. For example, the Worthey (1994) models predict a 2.0 Gyrs old stellar population to be brighter by as much as 1.5 mag in the -band compared to an old metal–poor stellar population (15 Gyrs, ) assumed to be representative of the Milky Way GCs. The bright magnitude cutoffs are thus set to , and mag. Sources brighter than this are almost certainly stars. In the rest of the paper, unless otherwise stated, we consider GCs brighter than the completeness limit for point sources. Therefore, the magnitude range of the candidate GC sample is , and mag. The colour and magnitude selected and visually inspected sample comprises a total of 151 GC candidates. It should be noted that including GCs brighter than the completeness limit for point sources does not change any of our conclusions.
Figure 8 shows the colour-magnitude diagram of all the colour selected and visually inspected GC candidates before applying any magnitude cuts. Objects have a wide range of colours but there is some evidence for two concentrations at and mag. This will be further discussed in section 4.

Although we attempt to minimise the fraction of foreground stars and background galaxies in the final GC sample, it is likely that a number of contaminating sources are also selected.
The number counts and colour distribution of foreground stars are estimated using the model developed by Bahcall & Soneira (1980)111The code for the star count model can be obtained from http://ascl.net/bsgmodel.html. In this model the Galaxy consists of both a disk and a spheroid component from which the distribution of stars in the and -bands as well as the colour distribution are calculated. To predict both the star counts in the -band and the and colour distributions we use the empirical tight relation between the and colours for stars (Bessel 1990). We predict about 120 stars within the field–of–view in the magnitude range , and mag. However, the colour selection (assuming a uncertainty of 0.2 mags) eliminates the majority of stars from the final catalogue. Indeed, the model of Bahcall & Soneira (1980), after both magnitude and colour selection, predicts a total of about stars in the final GC sample (total of 151 sources). Therefore, the star contamination is about .
To quantify the contamination of the final GC sample by background galaxies we should first estimate the completeness limits for galaxies at different wavebands. Since galaxies are resolved sources, their completeness limit is expected to be at brighter magnitudes to that of point sources (e.g. GCs in NGC 6702). Figure 9 plots the number counts for all the sources detected in our -band frame (total of 1455). Also shown is the star count prediction from the model of Bahcall & Soneira (1980). The difference between the total observed source counts and the predicted star counts in a given magnitude bin estimates, to the first approximation, the number of background galaxies detected in our field (here we ignore the contribution from GCs to the counts). Also shown in Figure 9 are the -band galaxy counts from Metcalfe et al. (1991, 1995). It is clear that the predicted galaxy counts in our field are in good agreement with those from Metcalfe et al. (1991, 1995) to the magnitude and then decline due to incompleteness. We estimate our -band galaxy catalogue to be about and complete at and mag respectively. Figures 10 and 11 are similar to Figure 9 for the and -bands respectively. From these Figures, we estimate our and -band galaxy catalogues to be complete at and mag respectively.
Ignoring GCs when calculating the number of galaxies within the field–of–view at , and –bands, overestimates the galaxy numbers at faint magnitudes. Consequently, the above mentioned completeness limits are conservative estimates.
To quantify the contamination of the GC sample due to background galaxies we use the multiwavelength () faint galaxy catalogue of Lilly, Cowie & Gardner (1991) complete to . The AB system is defined as , where is the flux cgs units. The transformations from the AB system are: , and (Lilly, Cowie & Gardner 1991). Using this galaxy sample we predict a total of galaxies with , and mag after converting to our magnitude system and scaling to the area of the LRIS field–of–view ( arcmin2). Taking into account the galaxy incompleteness of our sample, estimated from Figures 9–11, we predict a total of galaxies within the above mentioned magnitude limits. Colour selection, using the aperture colours of Lilly, Cowie & Gardner (1991) and assuming a uncertainty of 0.2 mags, reduces the number of contaminating background galaxies in our candidate GC sample to .
However, as demonstrated in Figure 7, visual inspection is efficient in removing extended sources from the sample especially at bright magnitudes. Indeed, a total of resolved sources with , and mag have been identified, leaving about unidentified galaxies within the final GC sample. This corresponds to a contamination of the GC candidate catalogue (total of 151) by galaxies of . We stress that this fraction is an upper limit. In particular, we simulated galaxy bulges following –law profile, with absolute luminosity and effective radius of =–21.0 mag and kpc respectively, typical of ellipticals. We found that only half of them are detected to the limit mag and this fraction drops to at mag. Moreover, disk-dominated galaxies will be missed by the detection algorithm at even brighter magnitudes. These surface brightness effects are likely to be significantly less severe in the deep surveys used to determine the galaxy counts at faint magnitudes. Indeed these surveys have effective exposure times as much as 10 times longer than those used here and are therefore, specifically designed to detect sources at faint magnitudes. Since bulges and compact galaxies account for less than of the galaxy population at faint magnitude limits (Elson & Santiago 1996), we anticipate the galaxy contamination of our final candidate GC sample to be much less than .


4 Results
4.1 Colour distributions
The colour distribution for the final GC sample is plotted in Figure 12. There is evidence for bimodality with the peaks of the distribution at and . Indeed the KMM statistical test (Ashman et al. 1994) rejects the single Gaussian model at a confidence level better than , giving peaks at and 2.16 respectively. It should be noted that this result is obtained after clipping objects with mag, likely to be background galaxies (3 out of 151; see Figure 13). However, this is not expected to artificially increase the likelihood of the two Gaussian fit. In particular, Ashman et al. (1994) argue that clipping of the data before applying the KMM test is sometimes desirable to remove background contamination. Also shown in Figure 12 is the reddening–corrected colour distribution of Galactic GCs that comprise old metal–poor GCs. The blue peak of NGC 6702 GCs lies close to the Milky Way GC distribution.
Figure 13 compares the candidate GC colour distribution with the colours of contaminating stars and galaxies (after being selected on the basis of their magnitudes and colours) predicted in the previous section. It is clear that foreground stars do not significantly modify the observed candidate GC colour distribution. Background galaxies, however, have a larger effect on the observed colour distribution, having colours similar to those of the red GC peak. Nevertheless, the fraction of contaminating galaxies within the sample is expected to be sufficiently small that it will not significantly modify the position of the peaks of the GC colour distribution. We further investigate this by subtracting the predicted galaxy colour distribution from that of the GC candidates in Figure 13. The KMM statistical test is then applied to the resulting distribution. A single Gaussian model is rejected at a confidence level better than , while the peaks of the bimodal distribution are at and 2.27 mag respectively. Although both peaks are redder than those recovered using the full candidate GC colour distribution, the difference is sufficiently small that does not alter any of our conclusions.
Figure 14 plots the colour histogram of both the NGC 6702 GC candidates and the Galactic GCs. There is no strong evidence for bimodality, with the KMM test finding no improvement of the two-group fit over a single Gaussian. This seems surprising since the colour distribution shows clear evidence for bimodality. It is likely that the absence of bimodality in Figure 14 is due to the smaller wavelength baseline of compared to the colour, providing less metallicity leverage. The expected difference between the peaks in is smaller (i.e. mag; see next section) than that in the histogram and therefore random photometric errors can more easily smear out any bimodality. Contamination of the GC candidate sample by stars and galaxies may also affect the significance of the detection of bimodality in the colour distribution. This is demonstrated in Figure 15, plotting the colour distribution of contaminating stars and galaxies (after being selected on the basis of their magnitudes and colours).


4.2 Age of the NGC 6702 Globular Clusters
To constrain the age and metallicity of NGC 6702 GC system we employ a method similar to that developed by Whitmore et al. (1997) that uses the colour-magnitude relation of GCs. The basic assumptions of the method are discussed in detail by Whitmore et al. (1997). In brief, it is assumed that the GCs comprise two distinct sub-populations of different age and metallicity but with the same initial mass functions. An additional assumption is that both sub-populations have similar numbers of GCs. The older population is taken to have properties similar to those of the Milky Way GCs and therefore consists of old (15 Gyrs) metal–poor () GCs. The younger population is formed at a later stage of the evolution of the galaxy, through either a merger event (e.g. Ashman & Zepf 1992) or a secondary in situ star-formation burst (Forbes et al. 1997). The young GCs, assumed to be metal–rich, are initially bluer than the old metal–poor ones but become redder after about 1–2 Gyrs. Similarly, the newly formed GCs are much brighter than the pre-existing metal–poor population but become fainter at later stages as they evolve passively. Therefore, the difference between the colours and magnitudes of the two GC populations can be used to constrain the age of the new GCs.
Here we employ the models of Worthey (1994) to predict the colour and magnitude difference of a young GC population relative to an old (15 Gyrs) metal–poor () population. The predicted colours of this old stellar population are and . The model predictions for the colour against both and magnitudes are shown in Figures 16 and 17 respectively. For NGC 6702 the difference between the colours of the two GC populations is taken as the difference between the peaks of the bimodal distribution in Figure 12. The blue peak in that figure is assumed to correspond to the old metal–poor population. This is a reasonable assumption since the blue peak overlaps with the Milky Way GCs fairly well. The peak colour difference from the KMM statistical test is , where the error is estimated assuming an uncertainty of 0.07 mag in defining the peaks of the bimodal distribution.
The and -band magnitude difference, and , between the two GC populations is estimated following the method of Whitmore et al. (1997) by taking the offset between the 10th brightest cluster of the blue and red subpopulations. The blue and red subpopulations are defined to have colours in the range and respectively. The uncertainties in and are estimating using the bootstrap resampling technique. We find and , i.e. the young GCs are brighter than the old ones.
The results are shown in Figures 16 and 17, and suggest that NGC 6702 GCs have solar to supersolar metallicity and an age in the range 2-5 Gyrs. Also we note that despite the errorbars, in both figures the data point lies close to the age of 3 Gyrs and [Fe/H]=0.5 model prediction. Moreover, although there are uncertainties in the calculation of the age of the newly formed GCs, our estimate is in fair agreement with the galaxy’s spectroscopically estimated age and metallicity of Gyrs and respectively (Terlevich & Forbes 2000).
To assess the sensitivity of the age and metallicity estimates to the adopted single stellar population model of Worthey, we repeat our calculations using the models developed by Bruzual & Charlot (1996) and Vazdekis et al. (1996) with a Salpeter IMF. Both models predict an age of about 2 Gyrs for the recently formed GC population. The predicted metallicity of is higher than that from the Worthey model. Despite, the discrepancies, it is clear that all three models used here predict that the blue GCs sub-population is relatively young with a supersolar metallicity.
Additionally, assuming an age of 3 Gyrs and [Fe/H]=0.5 for the red GCs, the Worthey (1994) models predict a colour difference between the two GC subpopulations of mag. As discussed in the previous section such a small colour difference is difficult to detect with the present dataset.


4.3 The surface density and specific frequency
We study the surface density profile, , of the NGC 6702 GCs using all the sources detected in the -band to mag (total of 1237), the completeness limit for point sources. We use the -band detections instead of the colour selected GC sample because the selection criteria (i.e. completeness limits) are easier to quantify and do not depend on the GC colours. The sample is binned into elliptical rings centred on NGC 6702 and having the same mean ellipticity and position angle as the galaxy (, PA=). The counts in each bin are corrected for geometric incompleteness due to foreground saturated stars, bad columns and the limited size of the field–of–view. Additionally, we mask out the central saturated part of NGC 6702 for radii . The correction for magnitude incompleteness to the counts in individual bins was found to be small () and was ignored. The density profile is plotted in Figure 18(a). The background surface density level, , was determined by combining the counts within the outermost three bins lying at (corresponding to galactocentric distances kpc) where the density profile reaches a constant level. We find (assuming Poisson statistics) or sources over the LRIS field–of–view of 31.2 arcmin2 (after applying geometrical corrections). The total number of objects to mag is 1237 and therefore the number of candidate GC is estimated to be 12356 (Poisson statistics). In section 3 we found a total of 151 candidate GCs, selected on the basis of their colours and magnitudes in the range mag. This is in fair agreement with the number of candidate GCs estimated here.
Figure 18(b) shows the candidate GC density profile, estimated by statistically subtracting the constant background surface density level from the density profile of all the sources detected on the -band frame to mag. Assuming a power law density profile of the form for the candidate GCs, we find . This slope for the GC system of NGC 6702 is consistent with that for other galaxies of a similar magnitude (Forbes et al. 1997). Also shown in Figure 18(b) is the -band surface brightness profile of NGC 6702. It is clear that the starlight of NGC 6702 drops more steeply than the GC density profile as is often seen in other galaxies (Harris 1991; Durrell et al. 1996). This is often attributed to further dissipative collapse of the host galaxy after the older GCs had formed and before the halo stars formed (e.g. Harris 1986). The radial distributions of the red and blue subpopulations of the GC candidates selected on the basis of their colours and magnitudes have also been investigated and have been found to be consistent within the uncertainties.

The globular cluster specific frequency is defined (Harris 1991)
| (1) |
where is the total number of globular clusters in the galaxy and is the host galaxy absolute -band luminosity. To calculate we assume that the -band luminosity function of NGC 6702 GCs is a Gaussian with the same parameters as that of the Milky Way GCs ( mag and ). We note that differences in the peak -band magnitude of the blue and red GC subpopulation luminosity function are small (see section 4.2). At the distance of NGC 6702 corresponds to =27.5 mag. Previously, we found that the number of GCs to the limiting magnitude =26 mag is 12356. Therefore integrating over the entire area of the luminosity function we find . This implies , assuming mag for NGC 6702.
It is an interesting exercise to predict the evolution of with time to investigate whether NGC 6702 will resemble normal ellipticals within a few Gyrs. For this calculation we assume that the total number of GCs is conserved and that the change in is due to passive evolution of the host galaxy. Furthermore, we assume that during the most recent major star-formation event, that took place about 2 Gyrs ago, of the NGC 6702 mass (see section 5 below) has been converted into metal–rich ([Fe/H]=+0.5) stars. After 10 Gyrs this new stellar population will fade in the -band by mag (Worthey 1994), corresponding to . Harris, Harris & McLaughlin (1998) found a mean of for large ellipticals in the Virgo, Fornax and the NGC 5846 group (excluding cD galaxies). However, exclusion of Bright Cluster Galaxies (BCGs) results in a mean , in better agreement, although somewhat larger, with the estimated for NGC 6702 after 10 Gyrs. However, the estimated evolution is sensitive to the galaxy mass fraction involved in the most recent major star-formation event, which in turn is uncertain and difficult to constraint. We calculate an upper limit for the NGC 6702 after 10 Gyrs by assuming the extreme scenario where as much as of the galaxy mass has been turned into stars. We estimate a fading of mag (Worthey 1994) within 10 Gyrs, corresponding to an upper limit of . Therefore, we conclude that the NGC 6702 , although lower than that of bright cluster ellipticals, it is likely to be similar to that of ‘normal’ (old) present-day ellipticals (excluding BCGs) within the next 10 Gyrs. The calculations above are also consistent with suggestions that galaxy interactions and mergers although unable to account for large galaxies, may explain the low values of in relatively isolated ellipticals (Elmegreen 1999).
5 Discussion
| NGC 6702 | NGC 1700 | |
| Type | E3 | E4 |
| MV (mag) | –21.9 | –21.5 |
| Environment | Field | Group |
| 0.21 | 0.38 | |
| Spectroscopic | ||
| age2 (Gyr) | 2 | 2.3 |
| 0.5 | 0.5 | |
| 0.12 | 0.13 | |
| Fundamental Plane | ||
| residual3 | –0.20 | –0.37 |
| 1Bender et al. 1992 | ||
| 2Terlevich & Forbes 2000 | ||
| 3Forbes, Ponman & Brown 1998 | ||
| 4The for NGC 1700 from Brown et al. 2000 | ||
A comparison between the properties of NGC 6702 and the group proto-elliptical NGC 1700 (Brown et al. 2000; Whitmore et al. 1997), is shown in Table 2. It is clear that there are quite a few similarities between the two galaxies. Both of them have similar optical luminosities and deviate from the Fundamental Plane in the sense of having younger ages on average (Forbes, Ponman & Brown 1998). This is confirmed by their central spectroscopic ages of 2 Gyrs (Terlevich & Forbes 2000). The central stars appear to be of high metallicity ([Fe/H] 0.5) with supersolar [Mg/Fe] abundance. Supersolar abundances have been the source of much debate in the literature but probably indicate either a rapid star formation time-scale or an IMF skewed towards massive stars. Both galaxies have radial velocity to velocity dispersion ratios, , indicating that they are anisotropic rotators. Bender et al. (1992) have suggested that the last major merger for anisotropic galaxies involved relatively little gas, i.e. the progenitors were largely stellar. In the case of NGC 6702 and NGC 1700 there must have been sufficient gas to support the central starburst and associated cluster formation. The similarities above also suggest a similar formation mechanism for these galaxies.
Moreover, our analysis above indicates the presence of two GC populations in NGC 6702 with different metallicities and ages. It is an interesting exercise to estimate the formation efficiency of the young (red; ) GC subpopulation, assuming they formed during the most recent star-formation burst, and compare it to that of stars formed in the same burst.
A robust estimator of the GC formation efficiency is the ratio of the total GC mass to the total baryonic galaxy mass. For this calculation we assume a typical GC mass of (Harris, Harris & McLaughlin 1998) and a mass–to–light ratio for NGC 6702 , typical to that of ellipticals (Faber & Gallagher 1979; Binney & Tremaine 1987). We have identified a total of 88 red GCs () to the limit mag, assumed to be the newly formed metal–rich GCs of NGC 6702. We adopt a Gaussian luminosity function for this GC subpopulation with parameters similar to those used in section 4.3 ( mag and ). This is a reasonable assumption, since the blue and red GC subpopulations of NGC 6702 in section 4.2 have a similar -band magnitude distribution within few tenths of a magnitude. Integrating over the entire luminosity function, assuming a completeness limit for our sample mag, we estimate a total of 970 red GCs. Thus, the total mass of the red GCs is . The total baryonic mass in stars of NGC 6702, estimated using its -band luminosity and the assumed mass–to–light ratio, is found to be . Therefore, we estimate that of the NGC 6702 mass has been turned into GCs during the most recent star-formation event, which is lower compared to recent estimates for the GC formation efficiency of 0.25% (Harris, Harris & McLaughlin 1998; McLaughlin 1999). It should be noted that this calculation assumes that the estimated baryonic mass in stars represents the total mass of the system, i.e. most of initial gas has been used for star-formation.
Elmegreen et al. (1999), argue that GCs represent about of the total galaxy star-formation. Therefore, for the GC formation efficiency of we expect that of the total NGC 6702 mass has turned into field stars (not in bound clusters) during the most recent star-formation event. Is our estimate of the mass in new stars (i.e. 8% of the total) consistent with the spectral line indices in the central re/8 region (Gonzalez et al. 1993)? If we assume that the new stars formed with a metallicity of [Fe/H]=0.5, and that the old stars (representing 92% of the central stellar mass) have solar metallicity and an age of 15 Gyrs, then the new stars would have to be slightly younger than 1 Gyr old. Assuming a time since the starburst of Gyrs and applying that to the new stars, their mass fraction would have to be increased to . Furthermore, if the galaxy reveals evidence for a young stellar population outside of the central region this will also point towards a large mass fraction (see also Trager 1997). Clearly there are large uncertainties involved in the above arguments, but there is some agreement between the mass fraction of young stars estimated independently using spectroscopic line indices and the properties of the NGC 6702 GC system. Moreover, it seems clear that a large fraction of new stars formed in NGC 6702 a few Gyrs ago. In the merger context, it implies a high gas fraction for the progenitors and hence a highly dissipational event. This is contrary to the claims of Bender et al. (1992) that anisotropic galaxies (such as NGC 6702 and NGC 1700) formed by largely dissipationless mergers.
Next, we compare the fraction of galaxy starlight in newly formed dense clusters relative to that of young field stars. To do that we add the luminosities of the red GCs (total of 88; ) and then divide by the luminosity of the young stellar population of NGC 6702. We note that estimating the total GC luminosity by extrapolating to the GC luminosity function will not modify our results, since the main contribution to the luminosity is from bright systems. Therefore, adding the red GC luminosities is a simple approximation that is sufficient for the purposes of the present study. Additionally, in our calculation we assume that by mass of the NGC 6702 stars are young (2 Gyrs) and metal rich ([Fe/H]=0.5), while the remaining of the mass is in old (15 Gyrs) metal poor ([Fe/H]=–1.5) stars. Using the mass–to–light ratios of the above stellar populations predicted by the models of Worthey (1994) we estimate that of the total NGC 6702 -band light originates in newly formed stars, i.e. . Consequently, we estimate , i.e. of the young star -band luminosity originates in bound clusters formed during the most recent star-formation event. This is much lower than the estimates in recent mergers which have shown that as much as of the blue galaxy light originates from GCs (Zepf et al. 1999; Meurer 1995). However, the main contribution to the integrated starlight in bound clusters in these systems is from young luminous clusters, the nature of which is under debate. In particular, it is still unclear whether these objects are proto-globular clusters that will evolve into bona-fide GCs (Brodie et al. 1998) or are luminous open clusters that will be destroyed by dynamical evolution (van den Bergh 1995). Indeed, in older merger remants, like NGC 7252, the fraction of light in bound clusters is somewhat lower than (Zepf et al. 1999). Moreover, van den Bergh (1994) noted that GCs account for about of the total halo luminosity of both the Milky Way and the LMC, in good agreement with our estimate for NGC 6702.
Clearly, the young elliptical galaxy NGC 6702 (and also NGC 1700) is at an interesting evolutionary stage for further study of its GC system. Direct measurement of individual GC metallicities with 8-10m class telescopes would confirm (or refute) the inferred supersolar metallicities for the new GCs and hence their age estimates. We note that the magnitude differences and in section 4.2, used to constrain the GC age and metallicity, are hard to define and would benefit from deeper imaging. Deeper imaging studies would also help determine the GC luminosity function (e.g. Gaussian or power law) to explore possible destruction mechanisms and would allow a detailed study of the radial distribution of the GC subpopulations.
6 Conclusions
We have carried out , and -band photometric observations of the elliptical galaxy NGC 6702 to explore its GC system. The GC candidates are selected on the basis of their colour, magnitude and morphology. We find strong evidence that the colour distribution of GC candidates is bimodal with the blue peak having a colour similar to that of the old metal–poor Galactic GCs. Assuming that the blue GC subpopulation is indeed old and metal–poor, we estimate that the red GCs have an age of 2–5 Gyrs and super-solar metallicity. Despite the large uncertainties, this is in reasonable agreement with the spectroscopically estimated age and metallcity of about 2 Gyrs and 0.5 respectively for the galaxy. Thus the red GCs in NGC 6702 are consistent with having formed during the most recent starburst, likely to have been triggered by a merger or an accretion event, a few Gyrs earlier. Additionally, we find a specific frequency for the NGC 6702 GC system of . We predict that passive evolution of the NGC 6702 stellar population formed during the most recent star-formation event will increase the NGC 6702 specific frequency to within 10 Gyrs, in reasonable agreement with the mean for present-day ellipticals, excluding the largest cluster ellipticals. Finally, using the NGC 6702 GC properties and making reasonable assumptions about the GC formation efficiency, we estimate the mass fraction of newly formed stars during the most recent star-formation event. We find reasonable agreement with the mass fraction estimated using stellar population synthesis models to interpret the line indices of the underlying galaxy starlight.
7 Acknowledgements
We thank Soeren Larsen and Richard Brown for useful comments and suggestions. Part of this research was funded by NATO Collaborative Research grant CRG 971552. The data presented herein were obtained at the W.M. Keck Observatory, which is operated as a scientific partnership among the California Institute of Technology, the University of California and the National Aeronautics and Space Administration. The Observatory was made possible by the generous financial support of the W.M. Keck Foundation. This research has made use of the NASA/IPAC Extragalactic Database (NED), which is operated by the Jet Propulsion Laboratory, Caltech, under contract with the National Aeronautics and Space Administration.
References
- [1]
- [2] Ashman K. A., Bird C. M., Zepf S. E., 1994, AJ, 108, 2348
- [3]
- [4] Ashman K. M., Conti A., Zepf S. E., 1995, AJ, 110, 1164
- [5]
- [6] Ashman K. M., Zepf S. E., 1992, ApJ, 384, 50
- [7]
- [8] Bahcall J. N., Soneira R. M., 1980, ApJS, 44, 73
- [9]
- [10] Barnes J. E., 1992, ApJ, 393, 484
- [11]
- [12] Bender R., Burstein D., Faber S. M., 1992, ApJ, 399, 462
- [13]
- [14] Bertin E., Arnouts S., 1996, A&AS, 117, 393
- [15]
- [16] Bessel 1990, A&AS, 83, 357
- [17]
- [18] Binney J., Tremaine S., 1987, Galactic Dynamics (Princeton: Princeton Uviversity Press)
- [19]
- [20] Brodie J. P., Schroder L. L., Huchra J. P., Phillips A. C., Kissler-Patig M., Forbes D. A., 1998, AJ, 116, 691
- [21]
- [22] Brown R. J. N., Forbes D. A., Kissler-Patig M., Brodie J., 2000, MNRAS, in press
- [23]
- [24] Bruzual A. G.m, Charlot S., 1996, electronically available see: Leitherer C., et al., 1996, PASP, 108, 996
- [25]
- [26] Burstein D., Heiles C., 1984, ApJS, 54, 33
- [27]
- [28] Casoli F., Dupraz C., Combes F., Kazes I., 1991, A&A, 251, 32
- [29]
- [30] Couture J., Harris W. E., Allwright J. W. B., 1990, ApJS, 73, 671
- [31]
- [32] Durrell P. R., Harris W. E., Geisler D., Pudritz R. E., 1996, AJ, 112, 972
- [33]
- [34] Elmegreen B., 1999, astro-ph/9911157
- [35]
- [36] Elson R. A. W., Santiago B. X., 1996, MNRAS, 280, 971
- [37]
- [38] Faber S. M., Gallagher J., 1979, ARA&A, 17, 135
- [39]
- [40] Franx M., Illingworth G., Heckman T., 1989, AJ, 98, 538
- [41]
- [42] Forbes D. A., Grillmair C. J., Williger G. M., Elson R. A. W., Brodie J. P., 1998, MNRAS, 293, 325
- [43]
- [44] Forbes D. A., Ponman T. J., Brown R. J. N., 1998, 508, L43
- [45]
- [46] Forbes D. A., Brodie J. P., Grillmair C. J., 1997, AJ, 113, 1652
- [47]
- [48] Forbes D. A., Hau G., 2000, MNRAS, in press
- [49]
- [50] Georgakakis A., Forbes A. D., Norris P. R., 2000, MNRAS, in press
- [51]
- [52] Gonzalez J. J., Faber S. M., Worthey G., 1993, AAS, 183, 4206
- [53]
- [54] Goudfrooij P., Hansen L., Jorgensen H. E., Norgaard-Nielsen H. U., de Jong T., van den Hoek L. B., 1994, A&AS, 104, 179
- [55]
- [56] Harris W. E., 1986, AJ, 91, 822
- [57]
- [58] Harris W. E., 1991, ARA&A, 29, 543
- [59]
- [60] Harris W. E., 1996, AJ, 112, 1487
- [61]
- [62] Harris W. E., Harris G. L. H., McLaughlin D. E., 1998, AJ, 115, 1801
- [63]
- [64] Hernquist L., ApJ, 1992, 400, 460
- [65]
- [66] Hibbard J. E., van Gorkom J. H., AJ, 1996, 111, 655
- [67]
- [68] Kauffmann G., Charlot S., 1998, MNRAS, 294, 705
- [69]
- [70] Kissler-Patig M., Brodie J. P., Schroder L. L., Forbes D. A., Grillmair C. J., Huchra J., 1998, AJ, 115, 105
- [71]
- [72] Landolt A. U., 1992, PASP, 104, 336
- [73]
- [74] Lauer T. R., 1985, ApJ, 292, 104
- [75]
- [76] Lilly S. J., Cowie L. L., Gardner J. P., 1991, ApJ, 369, 79
- [77]
- [78] Lutz D., 1991, A&A, 245, 31
- [79]
- [80] McLaughlin D. E., 1999, AJ, 117, 2398
- [81]
- [82] Metcalfe N., Shanks T., Fong R., Jones L. R., 1991, MNRAS, 249, 498
- [83]
- [84] Metcalfe N., Shanks T., Fong R., Roche N., 1995, MNRAS, 274, 257
- [85]
- [86] Meurer G. R., Heckman T. M., Leitherer C., Kinney A., Robert C., Garnett D. R., 1995, AJ, 110, 2665
- [87]
- [88] Miller B. W., Whitmore B. C., Schweizer F., Fall S. M., 1997, AJ, 114, 2381
- [89]
- [90] Mihos J. C., Hernquist L., 1996, ApJ, 464, 641
- [91]
- [92] Oke J. B., Cohen J. G., Carr M., Cromer J., Dingizian A., Harris F., H. Labrecque S., Lucinio R., Schaal W., Epps H., Miller J., 1995, PASP, 107, 375
- [93]
- [94] Peletier R. F., Davies R. L., Illingworth G. D., Davis L. E., Cawson M., 1990, AJ, 100, 1091
- [95]
- [96] Savage B. D. & Mathis J. S., 1979, ARA&A., 17, 73
- [97]
- [98] Schweizer F., 1987, in Nearly Normal Galaxies, ed. S. Faber (Springer: New York), 18
- [99]
- [100] Schweizer F., 1996, AJ, 111, 109
- [101]
- [102] Schweizer F., Seitzer P., 1992, AJ, 104, 1039
- [103]
- [104] Schweizer F., Seitzer P., Faber S. M., Burstein D., Ore C. M. D., Gonzalez J. J., 1990, ApJ, 364, L33
- [105]
- [106] Terlevich I. A., Forbes A. D., 2000, MNRAS, submitted
- [107]
- [108] Tragger S. C., 1997, PhD Thesis
- [109]
- [110] Toomre A., Toomre J., 1972, ApJ, 178, 623
- [111]
- [112] Toomre A., 1977, ‘The Evolution of Galaxies and Stellar Populations’, edited by B. M. Tinsley and R. B. Larson (Yale University, New Haven), p. 401
- [113]
- [114] van den Bergh S., 1995, Nature, 374, 215
- [115]
- [116] van den Bergh S., 1994, AJ, 108, 2145
- [117]
- [118] van den Bergh S., 1984, PASP, 96, 329
- [119]
- [120] Vazdekis A., Casuso E., Peletier R. F., Beckman J. E., 1996, ApJS, 106, 307
- [121]
- [122] Wiklind T., Combes F., Henkel C., 1995, A&A, 297, 643
- [123]
- [124] Woods D., Fahlman G. G., 1997, ApJ, 490, 11
- [125]
- [126] Worthey G., 1994, ApJS, 95, 107
- [127]
- [128] Whitmore B. C., Miller B. W., Schweizer F., Fall S. M., 1997, AJ, 114. 1797
- [129]
- [130] Whitmore B. C., Schweizer F., 1995, AJ, 109, 960
- [131]
- [132] Whitmore B. C., Schweizer F., Leitherer C., Borne K., Robert C., 1993, AJ, 106, 1354
- [133]
- [134] Zepf S. E., Ashman K. M., English J., Freeman K. C., Sharples R. M., 1999, AJ, 1999, 118, 752
- [135]