EXTREME ULTRAVIOLET EMISSION FROM ABELL 4059
We present the results of a search for Extreme Ultraviolet emission in A4059, a cluster with an X-ray emitting cluster gas. Our analysis of Extreme Ultraviolet Explorer (EUVE) Deep Survey observations of this cluster shows that it is associated with diffuse EUV emission. Outside the central 2 arcmin radius the entire EUV emission detected is explained by the low energy tail of the X-ray emitting gas. Within the central 2 arcmin region of the cluster we find a deficit of EUV emission compared to that expected from the X-ray gas. This flux deficit is discussed in the context of the cluster’s cooling flow. The results derived for A4059 are compared to EUVE results obtained for other clusters such as Coma, Virgo, A1795, and A2199. As part of the study we have carried out a detailed investigation of the stability of the EUVE Deep Survey detector background. Based on long integrations of blank sky over 27 months we disprove claims of substantial time dependent changes in the detector background by R. Lieu and coworkers. We also show, contrary to the claim of R. Lieu and coworkers, that the images obtained with the detector are independent of the pulse height threshold of the detector over a substantial range of threshold settings.
1 Introduction
A4059 at Mpc (z = 0.0487) is well studied in the X-ray, radio, and optical. It is relatively compact and is classified as richness class l (Schwartz et al., 1991 and references therein). It is dominated by a central CD galaxy, ESO 349-G010, and contains the radio galaxy PKS 2354-35 (Taylor, Barton, & Gee, l994). Taylor et al. (1994) found that the radio galaxy has a double lobe structure extending along the major axis of the host galaxy. X-ray observations with HEAO I and EXOSAT (Edge & Stewart 1991; Schwartz et al. 1991; Edge, Stewart & Fabian 1992) showed the cluster has substantial X-ray cluster emission with a strong cooling flow. ASCA observations (Ohashi 1995) found a chemical abundance gradient in the cluster gas around the central CD galaxy. Huang & Sarazin (1998) analyzed ROSAT, HRI and PSPC X- ray data on the cluster and found two X-ray holes near the center of the cluster emission.
We have studied A4059 in the hopes that it might shed light on the underlying source mechanism for EUV emission in clusters of galaxies. It is a particularly interesting cluster to study in this regard because it appears to have achieved a relaxed state (Huang & Sarazin 1998) and has a cooling flow. These characteristics are similar to those in A1795 and A2199 and Bowyer et al. (1999) showed these clusters did not exhibit excess EUV emission. On the other hand, A4059 does contain a radio galaxy, and Berghöfer et al. (2000) have shown that radio emission may be at least indirectly associated with the EUV emission in the Virgo Cluster.
We report herein our analysis of the EUV emission from A4059. In view of recent claims that the EUVE Deep Survey Telescope detector background is uncertain since it varies over time, and that the images obtained are highly dependent upon the threshold setting employed (Lieu et al. 1999), we have examined these issues in detail. Throughout this paper we assume a Hubble constant of 50 Km s-1 Mpc-1 and q(0) = 0.5.
2 Data and Data Analysis
A4059 was observed on two separate occasions. The first observation was carried out in June 1998 and provided 39,373 s of data; the second observation was made in November 1998 and provided 93,473 s of data. During the observation in June 1998 the cluster center was placed near the boresight of the Deep Survey Telescope about two arcmin away from the known dead spot of the detector.
In order to avoid the dead spot and to minimize other detector position dependent effects on the detected EUV emission the second observation of A4059 in November 1998 was carried out at two detector offset positions. During the first part of the second observation, 48,856 s of data was obtained to the right of the optical axis; the cluster was then observed for another 44,617 s to the left of the optical axis. A comparison of the cluster’s radial EUV profiles obtained during the different EUVE observations shows that the effect of the dead spot during the June 1998 observation is small and not visible within the statistical error bars.
The reduction of the data was carried out with the EUV package built in IRAF. We intended to employ the analysis methods described in Bowyer, Berghöfer & Korpela (1999) and Berghöfer, Bowyer & Korpela (2000) in this work. However, several aspects of these procedures have been questioned by Lieu et al. (1999). We note that the criticisms of Lieu et al. were made as declarative statements, and were unsupported by any analysis. Nonetheless, we have examined their points in detail. In specific, Lieu et al. claim that the character of the images obtained with the Deep Survey Telescope are dependent upon the lower level pulse height cutoff employed, and that the cutoff threshold for valid data varies substantially over the face of the detector. In addition, these authors claim that the background for observations with the Deep Survey Telescope must be taken nearly simultaneously with the observation itself since this background varies over time.
To examine the claim that the pulse-height threshold level setting varies widely over the face of the detector, we first assembled 363 Ks of data from a variety of blank fields. We then examined the effect of varying the lower level threshold on the summed image of these fields. In specific, we constructed an image taken with a lower level setting of 2700 (a detector control number that is linearly related to the voltage of the pulse-height cutoff setting). We then constructed an image taken with a lower level cutoff of 1280. We compared these two images using a cross correlation analysis and found the two had a correlation coefficient of 0.97. Hence the use of a lower level threshold cutoff that varies by well over a factor of two has essentially no effect on the final images and using any threshold within this range provides valid data.
We next studied the claim that the background data must be taken almost simultaneously with data from the field to be studied because the stability of the Deep Survey Telescope detector sensitivity function varies over time. We found that virtually every blank field observation made with the EUVE Deep Survey Telescope is well fit with a two-parameter profile. One profile is a flat background that varies from observation to observation (though typically by less than a factor of two). This reflects the different charged particle backgrounds encountered at different times. Such background changes are well known from other detectors in space-borne instruments. We note, for example, that there are several types of slowly varying background in the ROSAT PSPC data that are routinely accounted for in the analysis of data obtained with that instrument.
The second profile needed to parameterize a blank field is the detector sensitivity variation over the face of the detector. This profile accounts for telescope vignetting, obscuration by support structures in the detector window, and other factors. To study the stability of this parameter, we added a number of blank fields, individually obtained over a period of 27 months, to obtain a total data set of 363 Ks of blank sky. We subtracted the appropriate flat background determined from highly obscured regions at the outer most parts of the field of view near the filter frames from each of these fields. We then convolved the data with a 32 pixel wide Gaussian corresponding to the instrument resolution. We show the result in Figure 1a. A previous assemblage of 425 Ks of data obtained from a different set of blank fields and processed in the same manor is shown as Figure 1 of Bowyer et al. (1999) and is reproduced here as Figure 1b.
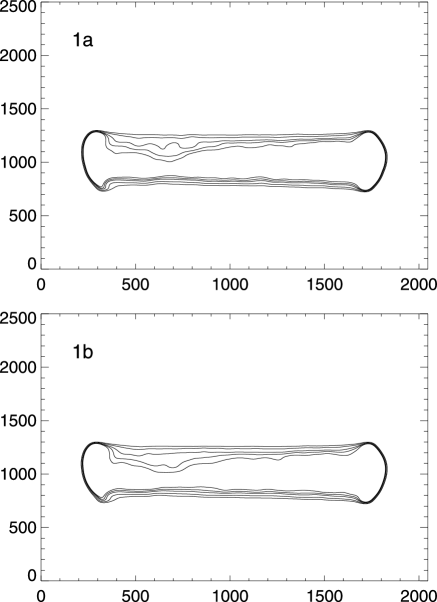
We compared these two data sets and found these two images are correlated at the 97% level over the active area of the Deep Survey Telescope detector. Given that the statistical errors in each element in each data set are about 1.5%, this is consistent with there being no difference between the images. We also employed a separate test to check the similarity of these two images. We computed the reduced of the fit of one image to the other and obtained a result of 1.05, again indicating that the two data sets are identical to within the statistical uncertainties.
Because this profile is stable there is no need to obtain a contemporaneous background for a particular individual observation. By combining a number of blank field observations, this effective detector sensitivity profile can be established to any level of desired statistical certainty.
We note that a similar type of correction for the variation of the detector sensitivity over the field of view is routinely used to correct ROSAT PSPC observations where the detector sensitivity variations in that instrument are incorporated into an effective area exposure map (Snowden et al 1994). A similar procedure is also routinely used in ground based observations of astronomical fields with CCD detectors where the procedure is designated as “flat fielding”.
In consideration of this demonstration of the validity of our analysis procedure, we began our analysis of the EUV data on A4059. We first examined the pulse-height spectrum of the detected events to exclude background events with pulse-heights significantly larger or lower than the source events. Events with low pulse-heights are primarily noise events, and events with very large pulse heights are primarily cosmic ray events. The photon events are concentrated in a Gaussian profile on top of a noise background that rises exponentially towards lower pulse-heights. A demonstration of this effect is shown in Figure 2. Here we show a smoothed pulse height distribution (PHD) of data from a 77 Ks blank field observation. The dashed line shows the PHD of the non-photonic background for data obtained from highly obscured regions of the detector at the outermost parts of the field of view. The sold line represents the PHD of events obtained over the entire portion of the detector exposed to the celestial sky. The curves have been normalized to the detector area of the samples. The difference between the two curves represents the PHD of photon events. In the case of the June 1998 A4059 data set we excluded events with pulse heights below 2,500 and above 12,500. For the November observation we excluded events below 2,500 and above 13,500.

Corrections for the detector dead time and telemetry limitations were then applied and raw DS EUV images were produced for the observations at the three different detector positions. For each of these images a flat non-photonic background, determined from highly obscured regions at the outer most parts of the field of view near the filter frames as discussed above, was subtracted from the image. We computed azimuthally averaged radial emission profiles of A4059 centered on the respective detector positions of the cluster from the individual EUV Deep Survey images.
The detector sensitivity map (or flat field) that we constructed from the assemblage of 788 Ks blank field observations was then used to determine radial sensitivity profiles for the three detector positions where the cluster was centered during the observations. These radial sensitivity profiles were then fit to the respective profiles of the distinct cluster observations at radii between 15 – 20′. In all three cases, the June 1998 observation and the two parts of the November 1998 observation, the fit of the sensitivity map to the observations provide an excellent representation of the data at radii larger than .
In Figure 3 we show the combined observed azimuthally averaged, radial EUV emission profile of the cluster A4059. The background and its statistical error is shown as a gray shaded area. Here we have used the entire 788 Ks background data set. Given this extensive data set, the statistical uncertainties in this background are small.
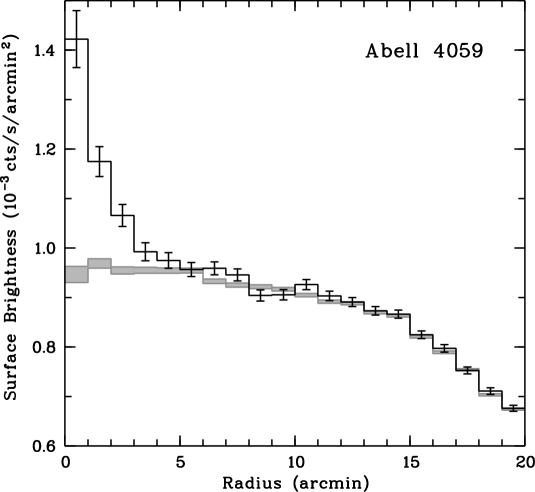
The data in this figure shows diffuse EUV emission in A4059 that extends to a radius of 4 to 5′. Beyond this point, the radial emission profile matches the detector sensitivity function, showing there is no EUV emission at larger radii.
We next determined the EUV contribution of the low energy tail of the X-ray emitting cluster gas in A4059. To this end we analyzed 5,439 s of ROSAT PSPC archival data on this cluster. Using standard procedures implemented in the EXSAS software package, we produced a cluster image in the ROSAT hard energy band (PSPC channels 51 to 201) and constructed an azimuthally averaged radial emission X-ray profile centered on the cluster position.
We employed the cluster X-ray gas temperature profile derived by Huang & Sarazin (1998), the abundance profile from ASCA measurements (Ohashi 1995), and the MEKAL plasma code to simulate ROSAT PSPC to EUVE DS counts conversion factors. The correction for the intervening absorption of the Galactic interstellar medium (ISM) was carried out using an interstellar hydrogen absorption column of Ncm-2 (Murphy et al. 2000) and an absorption model including cross sections and ionization ratios for the ISM as described in Bowyer, Berghöfer & Korpela (1999). Note that the ISM column employed, based on new radio measurements, is lower than that used in the analysis of Huang & Sarazin (1998). We conclude that the effect of the somewhat lower ISM column and the improved ISM cross sections on the X-ray temperatures derived by Huang & Sarazin is small. However, an accurate modeling of the foreground absorption is required in our work in order to obtain an accurate conversion from ROSAT PSPC counts into EUVE DS counts.
For the range of X-ray temperatures (1.8 to 4.0 keV) and element abundances of 0.29 to 0.63 times the solar value as established for A4059 by ASCA observations (Ohashi 1995), we determine the ROSAT PSPC hard band to EUVE Deep Survey counts conversion factor fell between 115 to 130. Employing these values as limits and using the azimuthally averaged radial X-ray emission profile derived from the PSPC hard energy band, we derived upper and lower limits for the EUV emission from the X-ray emitting gas in the EUVE Deep Survey band pass.
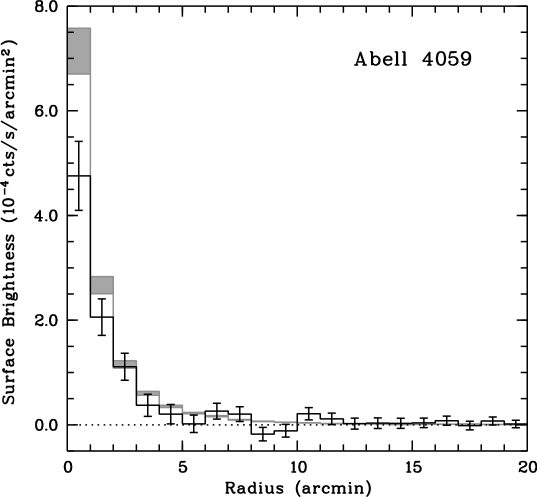
In Figure 4 we show the EUV emission from the X-ray emitting gas as shaded regions with the uncertainties in this emission indicated by the size of the shaded region. We also show the EUV emission in the cluster as derived from the data displayed in Fig. 3; we have subtracted the background from the signal and show the emission with the errors in the signal and background added in quadrature. Within the central 2′ bins the EUV emission has a deficit compared to the expected emission from the diffuse X-ray gas. At larger radii the EUV emission is consistent with the EUV contribution of the X-ray emitting cluster gas.
3 Discussion
The data displayed in Figure 4 shows there is no excess EUV emission in this cluster. There is, in fact, an EUV deficit in the innermost two arc minute region of the cluster. This deficit is similar to the EUV deficit found by Bowyer et al. 1999 in the inner core of A1795 and A2199. This effect is due to absorption by partially ionized material in the cooling flow material as has been discussed in Allen et al. (1996) and Bowyer et al. (1999).
Given that A4059 appears to have achieved a relaxed state and has a cooling flow, characteristics similar to those in A1795 and A2199, which Bowyer et al. (1999) showed did not posses an excess EUV emission, it is perhaps not surprising that we did not find excess EUV emission in this cluster. On the other hand, A4059 does contain a radio galaxy. Since Bowyer & Berghöfer (1998) have shown the EUV excess in the Coma Cluster is non-thermal and Berghöfer et al. (2000) have shown that radio emission may be at least indirectly associated with the EUV emission in the Virgo Cluster, it is reasonable to speculate that EUV emission would be present in this cluster as well. Since it is not, there must be some other mechanism involved in the production of this flux, either as the underlying cause, or as a correlative requirement.
In any attempt to understand the phenomena of EUV excess in clusters of galaxies, one must confront the fact that Lieu et al. (1999) claimed to have found excess EUV emission from A2199 while Bowyer et al (1999) did not. This difference is clearly due to the different analyses procedures employed.
Lieu et al. claim the pulse height threshold varies widely in the EUVE DS detector and that this is of fundamental importance. We have discussed this issue at length earlier in this paper and show that it is incorrect. Their second claim is that a background observation must be made nearly contemporaneously with the field observation because of the instability of the EUVE Deep Survey telescope background. We discussed this point earlier in this paper and show that this point is also incorrect.
An additional problem in the Lieu et al. analysis is introduced by the small background data set these authors employed. In their Figure 4 they claim the radial emission profile shows the emission extends out to almost 30′. However, their background observation is about one fifth as long as their cluster observation and consequently the errors in this background measurement are substantially larger than those for the cluster observation. It is an elementary statistical requirement that in order to optimize the measurement of a weak signal embedded in a background with a similar intensity, both the signal and the signal plus the background must have data sets of similar size. This is obviously not the case and the large statistical uncertainties in the background as shown in Figure 4a of Lieu et al. clearly dominate any attempt at establishing a signal even out to three arcmin. This can be verified by comparing the error bars of the background in Fig 4a with those of the signal plus background shown in Figure 4b, although this comparison would be easier if the background and its uncertainties were not omitted in Figure 4b.
The only difference between our analysis and the analysis of Lieu et al. that has any effect is their use of a wavelet analysis to establish their detector sensitivity profile or flat field. The profile they obtain using a wavelet analysis is clearly different than ours as can be seen by comparing Figure 1 of Lieu et al. showing their background with Figure 1 herein showing our profile. A wavelet analysis is a complex procedure and may well produce surprising results if inappropriately employed. Given the lack of transparency in their description of the use of a wavelet analysis, it is impossible to determine the source of effects seen in their Figure 1. We note that in an extensive anaysis of clusters of galaxies, Mohr et al. (1999) find that wavelet analyses of clusters of galaxies by Durret et al (1994), provide results that are different from virtually all other authors; they also comment that it is ”difficult to discern the source of the disagreement.” One possibility is that the large edge effects seen in the background in our Figure 1 are adding substantial power to their template. We have asked Lieu (2000, private communication) if this has occurred, but he has stated that he will not discuss this issue with us.
An apparent confirmation of a diffuse EUV emission from A2199 is provided by Kaastra et al. (1999) who use BeppoSAX and EUVE data in their analysis. These authors do not describe their reduction of the EUVE data so we cannot comment on that part of their analysis. However, these authors claim the BeppoSAX data show an excess EUV emission in this cluster. However, in analyzing the BeppoSAX data these authors use a curious mix of in-flight observational data and ground-based calibration data to determine the detector sensitivity function. The cosmic X-ray and particle background was obtained from in-flight data of empty files taken at high Galactic latitude. However, this in-flight data was not used to determine the effective area, point-spread function, strong back obscuration and vignetting of the detector. Instead these authors use a function that is based on response matrices derived from ground-based calibrations and ray trace codes. The lack of transparency of this procedure makes it difficult for an outside person to establish the validity of this process. We do note, however, that it was the use of a ground-based detector response function for the background of the EUVE detector that resulted in the errors in the original reports of EUV excesses in clusters of galaxies. It was only when in-flight background data were employed that the true extent of the EUV excess could be established.
It is superficially curious that excess EUV emission has been found in the Virgo Cluster by Lieu et al. (1996a) and Berghöfer et al. (2000), and in the Coma Cluster by Lieu et al. (1996b) and Bowyer et al. (1999) using different methods of analysis. Upon reflection it is clear that this is because the emission in both these clusters is sufficiently intense and extended that both groups obtain clear evidence for an excess. Nonetheless, the results obtained using these different methods differ in detail.
While there is agreement that there is an EUV excess in both Virgo and Coma, this emission is more complex than previously imagined. In the Virgo Cluster EUV emission is associated with the core and jet of the central galaxy M87. Additionally, in the vicinity of M87, diffuse emission is observed out to a distance of 13′. The spatial distribution of this flux is incompatible with thermal plasma emission originating from a gravitationally bound gas. Furthermore, the diffuse EUV emission is not directly correlated with either the X-ray or radio emission in the cluster (Berghöfer et al. 2000).
New data on the Coma Cluster shows the EUV emission is not only associated with the main cluster but is also present in the subcluster to the northwest (Korpela et al. in progress). A thermal source for the emission in the cluster can be ruled out since the emission is not consistent with a 1/r2 gravitational potential. Nonetheless, the emission is spatially intermixed with the high temperature X-ray emitting thermal emission.
4 Conclusion
We analyzed unpublished EUVE Deep Survey observations of the cluster of galaxies A4059. In order to test the integrity of our results for this clusters and to test the validity of our background model for the EUVE Deep Survey instrument we also analyzed 363 Ks of blank field observations and compared this to a previous assemblage of 425 Ks of blank sky. Using statistical tests of these two backgrounds we definitely confirm the stability of the instrument’s background and disprove claims of time dependent changes in the detector background by Lieu et al. (1999). Further analysis shows that for a wide range of threshold cutoffs the pulse-height threshold level setting has essentially no effect on the final EUVE Deep Survey images, another claim cooked up by Lieu et al. (1999).
Our analysis of the EUVE observations of the cluster of galaxies A4059 shows that this cluster exhibits diffuse EUV emission. However, the emission over most of the cluster is that expected from the low energy contribution of the X-ray emitting cluster gas. The EUV emission in the central 2 arcmin of the cluster shows an EUV deficit. The observed level of EUV flux is extremely sensitive to absorption effects and the flux deficit demonstrates intrinsic absorption of the X-ray emitting cluster gas. Together with A1795 and A2199 (Bowyer et al. 1999), A4059 is the third example of a cluster of galaxies with EUV absorption due to cooler gas in the existing central cooling flow.
References
- (1) Allen, S., Fabian, A., Edge, A. C., Bautz, M., Furuzawa, A., & Tawara, Y. 1996, MNRAS, 283, 263
- (2) Berghöfer, T. W., Bowyer, S., & Korpela, E. J. 2000, ApJ, 535, 615
- (3) Bowyer, S. & Berghöfer, T. W. 1998, ApJ, 506, 502
- (4) Bowyer, S., Berghöfer, T. W., & Korpela, E. J. 1999, ApJ, 526, 592
- (5) Durret, F., Gerbal, D., Lachieze-Rey, M., & Sadat, R. 1994 A&A, 287, 733
- (6) Edge, A. C., & Stewart, G. C. 1991, MNRAS, 252, 414
- (7) Edge, A. C., Stewart, G. C., & Fabian, A. C. 1992, MNRAS, 258, 177
- (8) Huang, Z., & Sarazin, C. L. 1998, ApJ, 496, 728
- (9) Kaastra, J. S., Lieu, R., Mittaz, J. P. D., Bleeker, J., Mewe, R., Colafrancesco, S., & Lockman, F. 1999, ApJ, 519, L119
- (10) Lieu, R., Mittaz, J. P. D., Bowyer, S., Breen, J., Lockman, F. J., Murphy, E. M., & Hwang, C-Y. 1996a, Science, 274, 1335
- (11) Lieu, R., Mittaz, J. P. D., Bowyer, S., J., Lockman, F. J., Hwang, C-Y., & Schmitt, J. H. M. M. 1996b, ApJ, 458, L5
- (12) Lieu, R., Bonamente, M., Mittaz, J. P. D., Durret, F., Dos Santos, S., Kaastra, J. S. 1999, ApJ527, L77
- (13) Mohr, J., Mathisen, B., & Evrard, A. 1999, ApJ, 517, 627
- (14) Murphy, E., Sebach, K., & Lockman, F. 2000, ApJS, in prep.
- (15) Ohashi, T. 1995, in Dark Matter, ed. S. S. Holt & C. L. Bennett (New York: AIP), 255
- (16) Schwartz, D. A., Bradt, H. V., Remillard, R. A., & Tuohy, I. R. 1991, ApJ, 376, 424
- (17) Snowden, S. L., McCammon, D., Burrows, D. N., & Mendenhall, J. A. 1994 ApJ, 424, 714
- (18) Taylor, G. B., Barton, E. J., & Ge, J. 1994, AJ, 107, 1942