The Extended X-ray Halo of the Crab-like SNR G21.5-0.9
Recent XMM-Newton observations reveal an extended () low-surface brightness X-ray halo in the supernova remnant G21.5-0.9. The near circular symmetry, the lack of any limb brightening and the non-thermal spectral form, all favour an interpretation of this outer halo as an extension of the central synchrotron nebula rather than as a shell formed by the supernova blast wave and ejecta. The X-ray spectrum of the nebula exhibits a marked spectral softening with radius, with the power-law spectral index varying from in the core to at the edge of the halo. Similar spectral trends are seen in other Crab-like remnants and reflect the impact of the synchrotron radiation losses on very high energy electrons as they diffuse out from the inner nebula. A preliminary timing analysis provides no evidence for any pulsed X-ray emission from the core of G21.5-0.9.
Key Words.:
ISM: individual (G21.5-0.9) - supernova remnants - X-rays:ISM1 Introduction
Of the known supernova remnants (SNRs) in our galaxy no more than are classified as Crab-like remnants (Green green00 (2000)). Prominent members of this class of SNR, also known as plerions, include the Crab Nebula, CTB 87, and 3C58. The characteristic centre-filled radio and X-ray morphologies of the Crab-like SNRs is thought to be due to the presence of an active pulsar which powers a bright synchrotron nebula. In the case of the Crab nebula, 33 ms pulsations testify to the presence of the central spinning neutron star, although in many Crab-like systems there is no direct evidence for pulsed emission. Typically a Crab-like SNR exhibits a flat power-law spectrum in the radio regime which eventually steepens at shorter wavelengths to join smoothly to a similarly featureless power-law X-ray continuum. This non-thermal form for the radio to X-ray spectrum is a consequence of the continuous injection by the pulsar of high energy electrons, which suffer radiation and adiabatic losses as they diffuse through the nebula; however the details of the process are undoubtedly complex (e.g. Reynolds & Chanan reynolds84 (1984)). A feature of the Crab-like remnants, which distinguishes them from both shell-like and composite-type SNRs (the latter typically exhibiting a filled-centre X-ray morphology within a radio shell), is the lack of any evidence for an outer shell structure marking the progress of the blastwave from the original supernova explosion.
G21.5-0.9 is a SNR with many of the characteristics of a Crab-like remnant (e.g. Becker & Szymkowiak becker81 (1981); Asaoka & Koyama asaoka90 (1990)). To date there has been no detection of pulsed emission in either the radio or X-ray bands (e.g. Biggs & Lyne biggs96 (1996); Slane et al. slane00 (2000)). However, recent X-ray observations made by Chandra have pinpointed the probable location of the pulsar, namely a very compact central core on a scale of embedded within a more extended ( radius) synchrotron nebula (Slane et al. slane00 (2000)). A faint extended halo was also detected which might correspond to the outer “shell” formed from the expanding ejecta and the passage of the supernova-driven blastwave (Slane et al. slane00 (2000)). In this interpretation G21.5-0.9 would be best described as a composite remnant. Here we report further recent X-ray observations of G21.5-0.9 made by XMM-Newton which help to clarify the nature of the extended X-ray halo in this object.
2 XMM-Newton observations
G21.5-0.9 was observed as a calibration target during orbits 60-62 and 64-65 of the XMM-Newton mission. Here we focus on measurements from orbit 60 (date: 2000/04/07; start time: 12.35 UT; end time 22.57 UT) in which the SNR was observed on-axis by the EPIC MOS and PN cameras (Turner et al. turner01 (2001); Strüder et al. struder01 (2001)) giving a total accumulated exposure time of ks. For these observations all three EPIC cameras were operated in the standard full-frame mode with the medium filter selected. Attitude information files are not yet available but all the indications are that a stable pointing was maintained for the duration of the observation111Our nominal position for the centre of G21.5-0.9 is (RA, Dec) = 18 hr 33 min 33.8 s, (J2000); (l, b) = , ..
The recorded events were screened with the XMM Science Analysis Software (SAS) to remove known hot pixels and other bad data and pre-processed using the latest CCD gain values. X-ray events corresponding to patterns 0–12 for the two MOS cameras (similar to grades 0-4 in ASCA) were used, whereas for the PN only pattern 0 events (single pixel events) were accepted. Investigation of the full-field count-rate revealed a number of flaring events in the non-cosmic component of the background during the observation. As a final step in the data screening we identified a period when the background was essentially “quiescent”, with full-field background rates in the MOS and PN cameras of and count/s. Selecting events only in this low-background period lead to effective exposure times of 13800 s and 11800 s for the MOS and PN cameras respectively.
3 Spatial Analysis
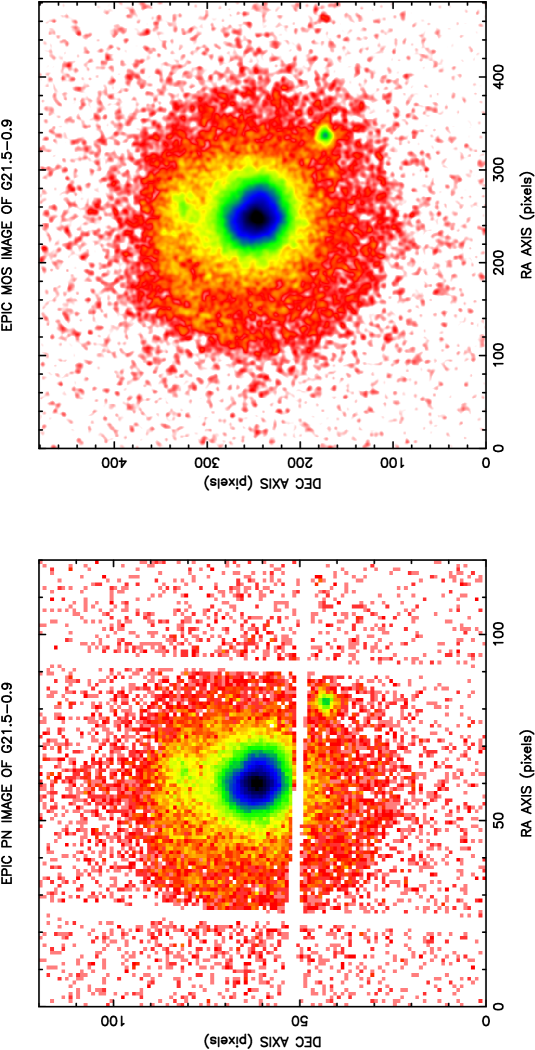
Given the observed soft X-ray cut-off in the spectrum of G21.5-0.9 (see §4), we utilize the 1–10 keV energy band in the spatial analysis. The raw image of G21.5-0.9 from the PN dataset binned into pixels is shown in Fig. 1 (left panel). The bright synchrotron nebula at the centre of this SNR is the most prominent feature of the image, although the central core is clearly surrounded by a more extended low surface-brightness emission region. In addition a point source is evident to the south-west of the centre of the remnant.
To avoid the complications due to the chip boundaries in the PN data we have based our spatial analysis on the data from the MOS cameras (since the field of view of the central chip in the MOS cameras comfortably encompasses the full extent of the SNR). Broad band images were constructed for both MOS 1 and 2 cameras utilizing pixels. The MOS 1 and 2 images were then aligned (by eye) using the nebula core and the south-western point source as fiducial marks and co-added. Fig. 1 (right panel) shows the resultant image after applying a Gaussian smoothing filter with a width = 2 pixels (FWHM of ). At a qualitative level there is clearly excellent agreement between the images from the PN and MOS cameras. The bright centre of the synchrotron nebula (i.e. the region within of the centre) shows deviations from circular symmetry, in particular there is an indentation in the north-west quadrant. At a slightly lower level of surface brightness a curious “spur” is evident which appears initially to track northwards away from the core region but then at sweeps round in an arc into the north-eastern quadrant of the remnant. These spatial features match rather well to similar structure seen in the higher spatial resolution images from Chandra (Slane et al. slane00 (2000)). One of the strengths of the EPIC cameras on XMM-Newton is, of course, the sensitivity afforded to extended, relatively low-surface X-ray emission. This is evident in the images of Fig. 1 in which a low surface brightness “halo” is well delineated out to . This halo exhibits a near perfect circular symmetry apart from the hint of a “linear termination” along its northern rim (note that out-of-time events, namely events recorded during the period when charge is transferred to the readout node, partly mask this feature in the PN image).

In order to investigate more quantitatively the spatial extent of the low surface brightness halo, we have calculated the azimuthally-averaged radial profile of the X-ray emission (Fig. 2). The surface brightness away from the centre of the synchrotron nebula drops rapidly out to . A plateau region is then reached corresponding to the low surface brightness halo. A sharp further decline in the surface brightness then sets in at , with the signal eventually falling below the detection threshold at . In this paper we define the remnant’s outer radius to be at which point the surface brightness is roughly one-fifth of the plateau value.
4 Spectral Analysis
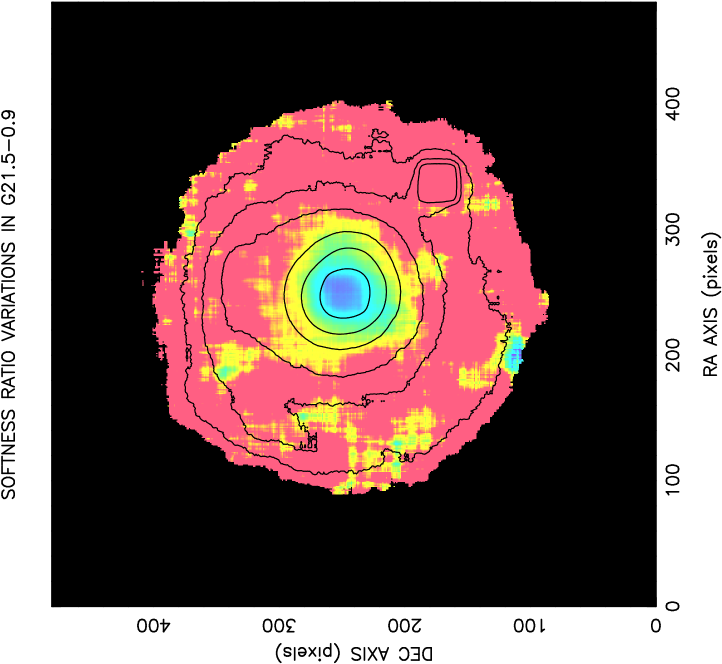
We first examined the spectral properties of G21.5-0.9 by plotting the softness ratio image shown in Fig. 3, which shows that the core of the nebula is significantly harder than the low-surface brightness halo.
We have investigated the spectral characteristics of the core of G21.5-0.9 using data from both the PN and MOS cameras. The X-ray spectrum of the core of the nebula was obtained using a circular extraction region of radius centred on the position of peak surface brightness. Background spectra were extracted from representative regions greater than away from the SNR. The source spectra were binned to a minimum of 20 counts per spectral channel, in order to apply minimisation techniques. The source and corresponding background spectra were then analysed using the xspec v11.01 and the most recent response matrices available from the EPIC team. The spectral modelling assumed a power-law continuum (photon spectral index, , and normalisation, ) subject to soft X-ray absorption in cool gas along the line of sight (with an equivalent hydrogen column density, ).
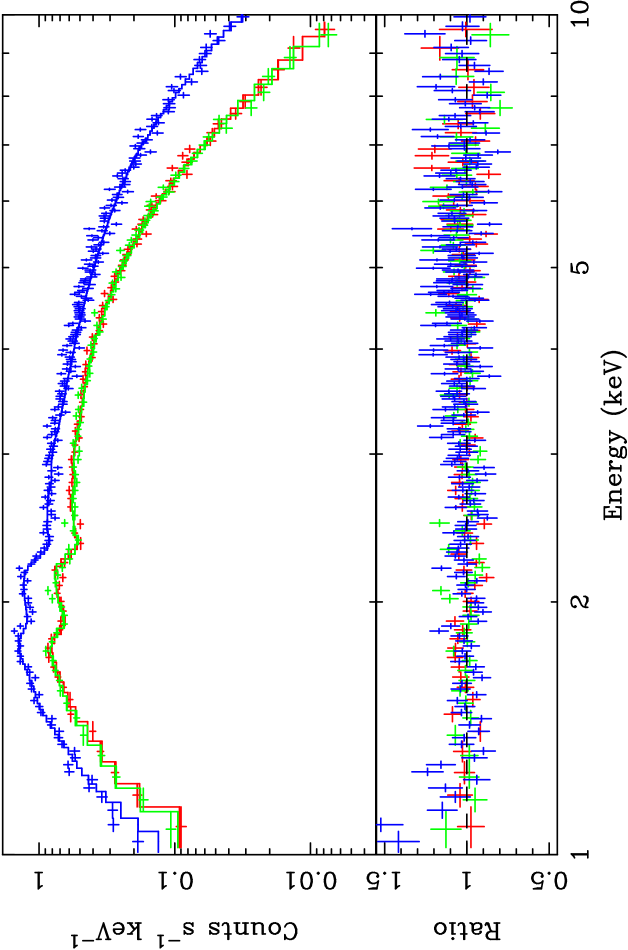
Fig. 4 shows the observed count rate spectra for the PN, MOS 1 and MOS 2 detectors together with the corresponding best-fitting model spectra. The spectral response of the two MOS cameras is so similar that the MOS 1 and MOS 2 count rate spectra almost totally overlap. The figure illustrates that the observed count rate in the PN camera is roughly a factor of two higher than in a single MOS camera at 2 keV, rising to a factor of four by 8 keV. The best-fitting spectral parameters obtained for separate fits to the PN and MOS spectra are summarised in Table 1, where the errors are quoted at a 90% confidence level. The simple absorbed power-law model provides a very good fit to all three data sets. In addition the agreement between the spectral parameters derived independently from the PN, MOS 1 and MOS 2 datasets is excellent.
| Camera | a | b | c | /dof |
|---|---|---|---|---|
| PN | 1278/1203 | |||
| MOS 1 | 384/425 | |||
| MOS 2 | 448/423 |
a Column density in units of
b Photon spectral index
c Normalisation in units of
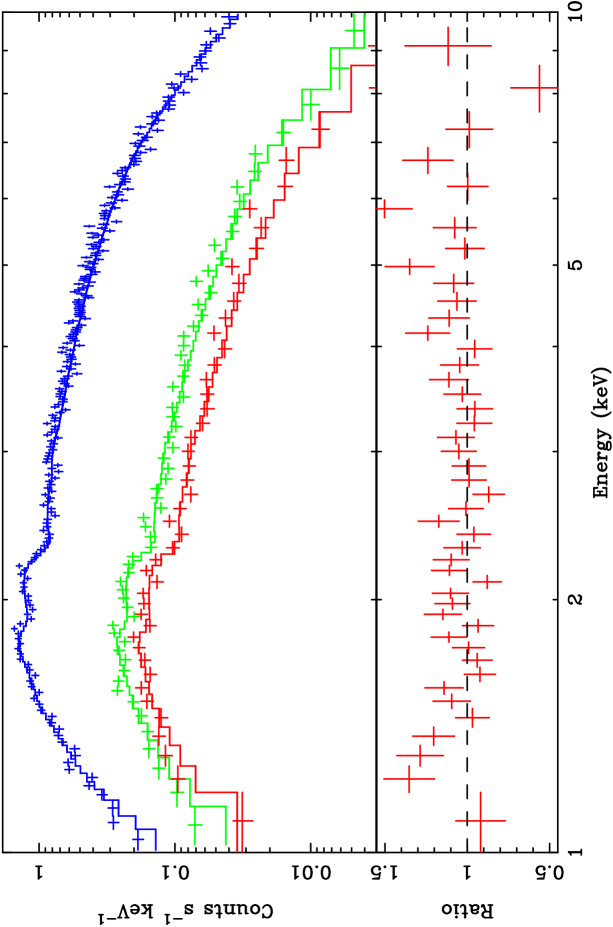
The spectral variations revealed in Fig. 3 were investigated by extracting spectra from the PN dataset from a set of annular regions centred on the point of peak surface brightness222In this analysis we excluded a radius region centred on the south-western point source.. The resulting spectra were then fitted as before with a simple absorbed power-law model. Initially we allowed to vary as a free parameter between the different spectral datasets but, in the event, excellent fits were obtained with fixed at the value obtained for the core region (Table 1). The derived photon spectral index shows a steady increase with radius from a value of at the centre to at the outer edge of the low surface brightness halo (Fig. 5). We note that the rate of spectral softening with radius will be slightly underestimated due to spreading caused by the instrument PSF (see Fig.2); however the impact on the derived spectral indices is likely to be small (). Fig. 6 further illustrates the variation of the X-ray spectrum from the core through to the outer halo region.
We next investigated whether there is any evidence for thermal emission from the halo component, focussing on the PN spectrum extracted from an outer () annular region. As a first step we fitted a two component model, comprising a power-law and a (solar abundance, MEKAL) thermal component. The result was a modest improvement in the with respect to the power-law model (see Table 2) which the F-test shows to be marginally significant for two additional parameters. However, this putative ( keV) thermal component accounts for only of the observed flux. The lack of prominent line features in the X-ray spectrum of the outer halo is evident in Fig. 6 which shows the fitting residuals to a simple power-law spectral model. One possibility is that the line emission is suppressed due to the fact that shock-heated X-ray emitting gas in the halo of G21.5-0.9 has not had time to reach a state of ionization equilibrium. When we fit a non-equilibrium ionization model (the NEI model in xspec) we obtain the spectral parameters listed in Table 2. The NEI model provides only a rather poor fit to the data when the column density is constrained to the value measured for the SNR core. A rather better result is obtained when is allowed to vary freely (the last entry in Table 2) but nevertheless the fit is not as good as that obtained for the absorbed power-law model.
We also examined the spectrum of the brightest part of the spur feature (located directly to the north of the core) but unfortunately the signal-to-noise ratio was too low to distinguish between thermal and power-law spectral forms.

| Model | a | b | c | d | /dof |
|---|---|---|---|---|---|
| PL | e | - | - | 258/231 | |
| 2-Comp | e | - | 253/229 | ||
| NEI | e | - | 356/230 | ||
| NEI | - | 277/229 |
a Column density in units of
b Photon spectral index
c Temperature in keV
d Ionization timescale in units of
e Fixed parameter
The total integrated X-ray flux of G21.5-0.9 within a radius of , corrected for the line-of-sight absorption, is erg cm-2 s-1 in the 2–10 keV band. Assuming a distance of 5 kpc based on HI absorption measurements (Davelaar, Smith & Becker davelaar86 (1986)), this implies an X-ray luminosity of .
Finally we have briefly considered the spectral properties of the south-west point source. We obtained an on-source spectrum from the PN dataset using an extraction cell of radius. A complementary background spectrum was taken (on the same CCD) using a cell of the same dimension sited equidistant from the centre of G21.5-0.9. Spectral fitting indicated a relatively hard spectrum ( or keV) and a column density of . As the latter is about a factor two lower than the derived of G21.5-0.9, we can conclude that this point source is a foreground object with respect to the SNR. If we estimated its distance as kpc (i.e. roughly half the distance to the SNR in line with the ratio of for the two sources) then the inferred 2–10 keV luminosity is . This point source is positionally coincident with the emission-line star SS397.
5 X-ray Timing Analysis
We have carried out a preliminary search for pulsed X-ray emission using EPIC data from the full observation (i.e. including periods of relatively high background rate). The photon events in the 1–10 keV band from a region of radius centred on the core of G21.5-0.9 were extracted for all three cameras. Next the event times were barycentric corrected using the standard SAS task “Barycen” and the latest available “Reconstructed Orbit” file. Power spectra were then calculated for the combined data from all three cameras and the PN dataset alone. No evidence was found for a significant periodic signal. In terms of the amplitude of an underlying sinusoidal signal, the detection threshold was ct/s in the frequency range – 0.17 Hz for the PN + MOS combination (the upper frequency limit being set by the frame time of the MOS CCDs). Corresponding values for the PN-only data were ct/s in the frequency range – 2 Hz. In terms of the pulsed fraction (of the core emission) the limits are roughly and respectively.
6 Discussion
In a recent paper reporting Chandra observations, Slane et al. (slane00 (2000)) consider the possibility that the low-surface brightness halo surrounding the central synchrotron nebula in G21.5-0.9 might be the shell formed from the ejecta and blastwave of the original supernova explosion. The present XMM-Newton observations help delineate the spatial extent and morphology of this component. Crucially the new spectral information demonstrates that the extended halo has a spectral form devoid of any significant line features. If the halo emission is thermal then the lack of line emission implies that the plasma is far from ionization equilibrium. Our NEI modelling confirms a low ionization state with . The temperature derived for the continuum (bremsstrahlung) emission is keV which is rather hot, even for a very young SNR. Assuming the distance to G21.5-0.9 is 5 kpc (Davelaar, Smith & Becker davelaar86 (1986)) and taking a maximum shell expansion velocity of , we can estimate the (minimum) elapse time since the shock heating of the bulk of the X-ray emitting gas in the outer halo to be yrs. Applying the above constraint on then gives . However, the observed X-ray luminosity of the outer halo, if interpreted as bremsstrallung radiation, sets a requirement for a significantly higher electron density, . There would appear therefore to be considerable difficulties in interpreting the extended X-ray halo in G21.5-0.9 as a thermal shell.
There are known examples of SNR shells which exhibit non-thermal X-ray spectra due to local particle acceleration (e.g. SN 1006, Koyama et al. koyama95 (1995); G347.3-0.5, Slane et al. slane99 (1999)). However, in the case of G21.5-0.9 the lack of any limb brightening, the smooth transition in spectral index throughout the remnant and the remarkable circular symmetry, all suggest an interpretation of the outer halo as an extension of the central synchrotron nebula. We conclude therefore, on the basis of the present observations, that G21.5-0.9 is a true Crab-like system rather than a composite (centre-filled plus thermal shell) object.
The observed spectral softening with radius in G21.5-0.9 most likely reflects the impact of synchrotron radiation losses on very high energy electrons as they flow from the region of the termination shock around the pulsar to the edges of the nebula. For example, if the nebula magnetic field is mG (Slane et al. slane00 (2000) ), then the synchrotron lifetime of the TeV electrons producing 5 keV X-rays is only yrs. Similar spectral trends due to “synchrotron burn-off” are seen in other Crab-like SNR, such as 3C58 (Torii et al. torii00 (2000)). In fact the variation in photon spectral index from a value of 1.63 at the centre of the G21.5-0.9 to 2.45 at the edge of its halo is amazingly similar to the index range seen in the Crab nebula (Willingale et al. willingale01 (2001)). In the case of the Crab nebula the spatial and spectral distribution of the optical to hard X-ray continuum has been explained in terms a magnetohydrodynamic flow of plasma and magnetic flux in a particle dominated wind (e.g. Kennel & Coroniti kennel84 (1984)). For G21.5-0.9, the origin of halo which represents a “plateau” in the surface brightness extending from remains unclear, but could possibly be the result of an unusual magnetic field geometry (see below).
One interesting contrast is that the radio extent of the Crab nebula is roughly a factor four greater than that observed in X-rays, whereas for G21.5-0.9 the dimensions of the X-ray halo exceeds that of the radio synchrotron nebula (which has a major axis of ; Fürst et al. furst88 (1988)) by a similar factor. Slane et al. (slane00 (2000)) note that no radio “shell” is detectable to a (1) threshold of at 1 GHz. If we make the assumption that the ratio of the core to halo flux is the same in the X-ray and radio regimes, then we predict the average surface brightness of an underlying radio halo (between ) to be roughly 5 times this threshold. The inference is that very deep radio observations may well reveal the presence of an extended radio halo in G21.5-0.9.
The differences in the spatial morphology of the Crab and G21.5-0.9 could be due to the viewing orientation. Specifically the near circular symmetry of G21.5-0.9 might be explained if our line of sight is reasonably aligned with the spin axis of the resident pulsar, so as to give a near face-on view of a putative inner torus. This hypothesis might also explain the non-detection of pulsed X-ray emission from the core of G21.5-0.9, but is hard to reconcile with the axisymmetric structure seen in high frequency radio maps and the near radial distribution of the magnetic field lines (Fürst et al. furst88 (1988)). In this setting the spur-like feature which emanates northwards from the core could a “plerionic” wisp associated with a complex inner magnetic field and/or jet structure.
Acknowledgements.
The results presented in this paper are based on observations obtained with XMM-Newton, an ESA science mission with instruments and contributions directly funded by ESA Member States and the USA (NASA). We thank the whole XMM-Newton team for the hard work and dedication which underlies the success of the mission.References
- (1) Aschenbach, B., Briel, U., Haberl, F., Bräuninger, H. Burkert, W., Oppitz, A., Gindoin, P. & Lumb,D. 2000, astro-ph/0007256/
- (2) Asaoka, I. & Koyama, K. 1990, PASJ, 42, 625
- (3) Becker R.H. & Szymkowiak, A.E. 1981, ApJ, 248, L23
- (4) Biggs, J.D. & Lyne A.G. 1996, MNRAS, 282, 691
- (5) Davelaar,J., Smith,A. & Becker, R.H. 1986, ApJ, 300, L59
- (6) Fürst, E., Handa, T., Morita, K., Reich, P., Reich, W. & Sofue, Y. 1988, PASJ, 40, 347
- (7) Green, D.A. A Catalogue of Galactic Supernova Remnants (2000 August version): Cambridge, UK. Available at http://www.mrao.cam.ac.uk/surveys/snrs/
- (8) Kennel C.F. & Coroniti F.V. 1984, ApJ, 283, 694
- (9) Koyama, K., Petre, R., Gotthelf, E.V., Hwang, U., Matsura, M., Ozaki, M & Holt, S.S. 1995, Nature, 378, 255
- (10) Reynolds S.P. & Chanan, G.A. 1984, ApJ, 281, 673
- (11) Slane, P., Gaensler, B. M., Dame, T. M., Hughes, J. P., Plucinsky, P. & Green, A. 1999, ApJ 525, 357
- (12) Slane, P., Chen, Y., Schulz, N.S. & Seward, F.D. 2000, ApJ 533, L29
- (13) Strüder, L., Briel, U., Dennerrl, K. et al. 2001, A&A, 365 (this issue)
- (14) Torii, K., Kinugasa, K., Hashimotodani, K., Tsunemi, H. & Slane, P. 2000, PASJ, in press
- (15) Turner, M.J.L., Abbey, A.F., Arnaud, M. et al. 2001, A&A, 365 (this issue)
- (16) Willingale, R., Aschenbach, B., Griffiths, R.G. et al. 2001, A&A, 365 (this issue)