The central region of M31 observed with XMM-Newton ††thanks: Based on observations obtained with XMM-Newton, an ESA science mission with instruments and contributions directly funded by ESA Member States and the USA (NASA).
We present the results of a study based on an XMM-Newton Performance Verification observation of the central 30′ of the nearby spiral galaxy M31. In the 34-ks European Photon Imaging Camera (EPIC) exposure, we detect 116 sources down to a limiting luminosity of erg s-1 (0.3–12 keV, kpc). The luminosity distribution of the sources detected with XMM-Newton flattens at luminosities below erg s-1. We make use of hardness ratios for the detected sources in order to distinguish between classes of objects such as super-soft sources and intrinsically hard or highly absorbed sources. We demonstrate that the spectrum of the unresolved emission in the bulge of M31 contains a soft excess which can be fitted with a 0.35-keV optically-thin thermal-plasma component clearly distinct from the composite point-source spectrum. We suggest that this may represent diffuse gas in the centre of M31, and we illustrate its extent in a wavelet-deconvolved image.
Key Words.:
galaxies: individual: M31 – galaxies: spiral – galaxies: general – galaxies: ISM – X-rays: galaxies1 Introduction
Being the closest spiral galaxy to our own, the Andromeda Galaxy (M31) is in many respects ideal for the study of X-ray emission in a galaxy similar to the Milky Way. The sources in M31 are observed at a nearly uniform distance, and, owing to the inclination of the galaxy (77∘), they are viewed through a substantially lower absorption column than for sources in the Galactic plane.
In a recent review, van den Bergh (2000) reports a distance modulus to M31 of 24.40.1, corresponding to a distance of 760 kpc. We adopt this value in our analysis, and for consistency we scale to this distance when discussing published luminosities which assume a different distance.
Over 100 X-ray sources in M31 were detected with the Einstein observatory (Trinchieri & Fabbiano 1991; van Speybroeck et al. 1979). The brightest X-ray source in M31 was found to have a luminosity of erg s-1, approximately the Eddington luminosity for spherical accretion onto a 1.4 neutron star. For sources down to erg s-1, the luminosity distribution was reported to be consistent with a single power law which, extrapolated to fainter levels, could fully account for the X-ray emission from the bulge of M31.
Primini, Forman & Jones (1993) detected 86 X-ray sources in the central 34′ of M31 with the ROSAT HRI. They found a break in the luminosity distribution at erg s-1, below which the distribution of sources flattened. This flattening suggested that the detected population of X-ray sources could account for only 15–26% of the unresolved X-ray emission in M31. Contributions from known less-luminous populations of X-ray sources also could not fully account for the unresolved emission, suggesting that the remaining emission is truly diffuse or due to a new class of X-ray sources.
In an extensive, 6.3 deg2, survey of M31 with the ROSAT PSPC, 396 X-ray sources were detected (Supper et al. 1997). However, only 22 of these sources were detected in the bulge region (′) due to the resolution of the PSPC.
In the first Chandra observation of M31, the nuclear source seen with Einstein and ROSAT was resolved into five sources (Garcia et al. 2000). One of these sources is located within 1″ of the radio nucleus of M31 and exhibits an unusually soft X-ray spectrum, suggesting that it may be associated with the central super-massive black hole. A few more pairs of previously unresolved sources and a new transient were also detected within 30″ of the nucleus.
M31 was selected as an XMM-Newton (Jansen et al. 2001) Performance Verification target in order to demonstrate the capabilities of XMM in performing spectral and timing studies in a field of point sources and extended emission. In this paper we focus on the group properties of the X-ray point sources in M31 as well as the diffuse emission. In a companion paper (Osborne et al. 20001, Paper II), we discuss the spectral and timing properties of individual X-ray sources in M31.
2 XMM-Newton Observations
The central region of M31 was observed with XMM-Newton on 2000 July 25. The observation was centred on the core of M31 (, J2000), with a field of view of 30′ in diameter for the three European Photon Imaging Camera (EPIC) instruments. Exposures of 34.8 ks were obtained with each of the two EPIC MOS instruments (Turner et al. 2001), and a 31.0-ks exposure was obtained with the EPIC PN (Strüder et al. 2001). All three EPIC instruments operated in full-window mode with the medium optical blocking filter. The two Reflection Grating Spectrometer (RGS) cameras (den Herder et al. 2001) each obtained 43-ks exposures (not discussed here). The Optical/UV Monitor Telescope (OM; Mason et al. 2001) filter wheel was set to the blocked position during this observation; however, UV and optical exposures with the OM are planned during upcoming Guaranteed-Time Observations of M31.
The background rate in the EPIC detectors was steady for the entire observation except for a background flare during the final 5 ks. Data from this background flare are excluded from the image in Figure 1 and from our analysis of extended regions; however, we have found that they do not significantly affect the spectra of individual point sources. Therefore, the entire data-set was used for the extraction of discrete sources.
We used the XMM-Newton Science Analysis System (versions from 2000 Sept.) to reduce the EPIC data to calibrated event lists, produce images, and extract spectra. We used a combination of SAS programs and external software to further analyse the data. In this paper, we concentrate on data from MOS1 but we have used a sample of data from MOS2 and PN to confirm the consistency of our results. Slight differences in the locations of sources on the outer MOS1 CCDs relative to MOS2 and PN indicate that the calibration of chip boundaries must be refined. We used the response matrix mos1_medium_all_v3.17_15_tel4.rsp for fitting MOS1 spectra; we checked that our results do not change significantly if the more recent response matrix mos1_medium_all_qe17_rmf3_tel5_15.rsp (2000 Oct.) is used.
3 EPIC Images
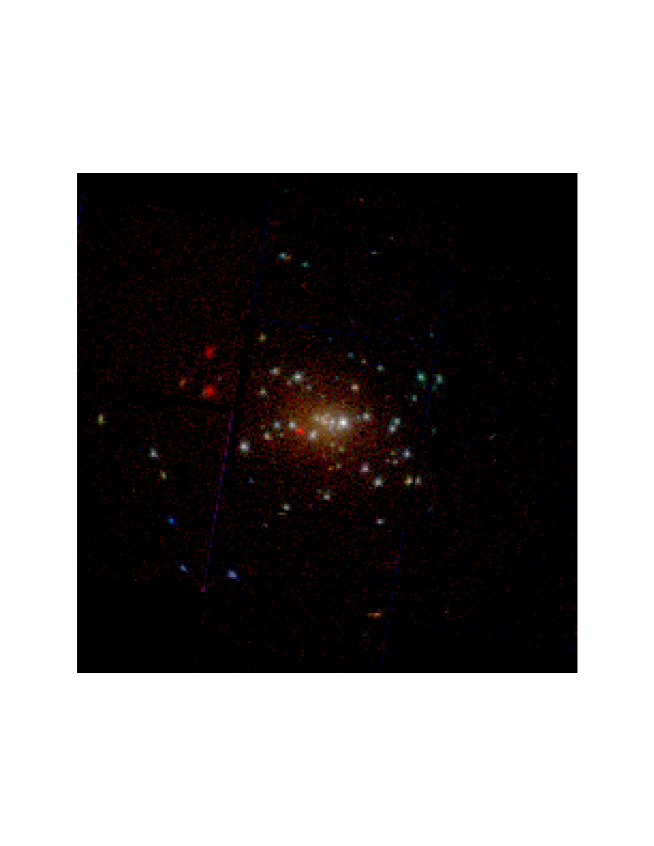
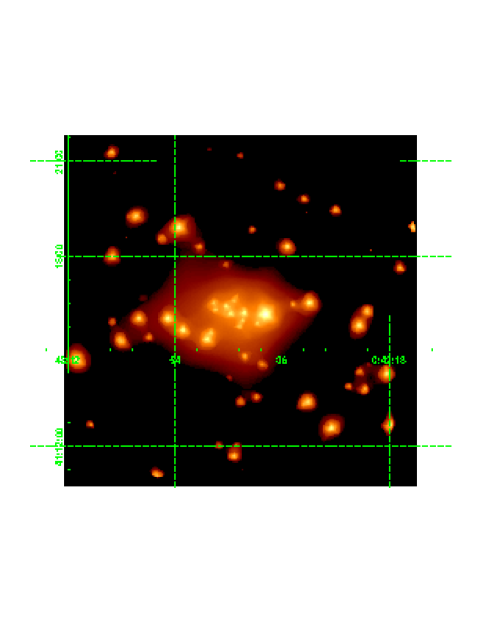
The EPIC images of the central 30′ of M31 (e.g., the MOS1 image in Figure 1) contain more than 100 discrete X-ray sources as well as unresolved emission near the centre. The images show four very soft (red) sources: two of them were identified by Kahabka (1999) as candidate super-soft sources (SSS), based on a wider ROSAT PSPC hardness-ratio criteria than the original sample of SSS identified by Supper et al. (1997); one is coincident with a super-nova remnant; the fourth one is an unidentified source detected with the ROSAT HRI (Primini et al. 1993). Several very hard (blue) sources are also present. The nature of these extreme-colour objects is discussed below in the context of the point-source group properties.
4 Discrete X-ray sources
4.1 Source Detection
Sources were detected with the IRAF routine DAOPHOT (Stetson 1987); the SAS produced similar results. We determined the point spread function (PSF) from the brightest sources in our image rather than from calibration models, and we used the measured PSF to fit source intensities. The FWHM of the PSF is a function of energy and distance from the image centre; for the core region (′, 1.1 kpc), where most of the sources are found, 4″–7″. It is more difficult to determine the PSF for sources at ′ from the centre. For a few of these off-axis sources, we compared the count rate found with the PSF fitting routine with the rate obtained by considering a 30″ source circle and a 15″ sky annulus. We find that the count rates obtained with the two methods are similar. We also correct the count rates of all the sources for the vignetting of the XMM telescope, based on the Current Calibration Files provided with the SAS.
We detect 116 discrete sources above a threshold. Two sources previously identified as foreground or background objects (ROSAT HRI sources 9 and 82 Primini et al. 1993) have been excluded from the analysis below. In addition, three sources at or near the nucleus have been resolved into two or more sources with Chandra (Garcia et al. 2000) and are thus also excluded from our discussion of the luminosity distribution.
4.2 Spectral Characterisation

We have fitted simple absorbed power-law models to the spectra of the 23 brightest point sources (those with more than 500 counts above the background in the first 30 ks of observation). We present more detailed spectral fits of selected sources in Paper II. In order to obtain the spectra of the bright sources, we used an extraction radius of 15″; we subtracted a background extracted from an annulus at the same distance from the galactic centre as the source and from which the point sources have been removed. The resulting spectra were fitted with an absorbed power-law model, with the column density fixed at cm-2. Figure 2 shows the fitted photon indices plotted versus the distance of each source from the M31 nucleus. We note that the hardest sources tend to be outside the central few arcminutes of the galaxy.
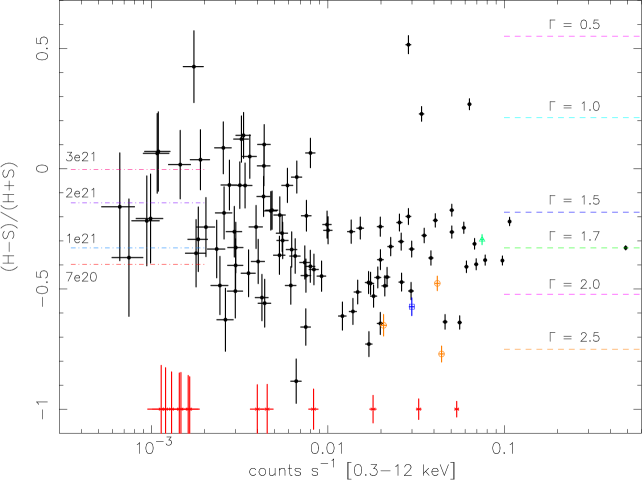
In order to characterise the gross spectral properties of all the detected sources, including those for which we do not have enough counts for spectral fitting, we derived source counts in soft (S) and hard (H) energy bands of 0.3–2.0 keV and 2.0–12 keV respectively, and we constructed hardness ratios defined as . In Figure 3, we show the hardness ratio versus total count rates of all the 116 sources detected in EPIC MOS1. Thirteen sources detected only in the soft band are plotted with a hardness ratio . Among this group of very soft sources, three have an estimated emitted luminosity erg s-1 (see Section 4.3); as mentioned above, two of them are super-soft sources, and the third one is identified with an SNR. The three bright, blue sources in Figure 1 all have hardness ratios significantly larger than the other sources in Figure 3. We show in Paper II that these sources are intrinsically hard, rather than highly absorbed. In Figure 3, we have included three core sources resolved with Chandra , plotted here as open circles. The softest (and brightest) of these three unresolved XMM-Newton sources contains the true nucleus CXO J004244.2+411608 (Garcia et al. 2000); its hardness ratio confirms that the spectrum of the nucleus is very soft. The open triangle marks the bright transient found with Chandra (Garcia et al. 2000). The open square marks a bright new transient source we detected with XMM-Newton (Paper II).
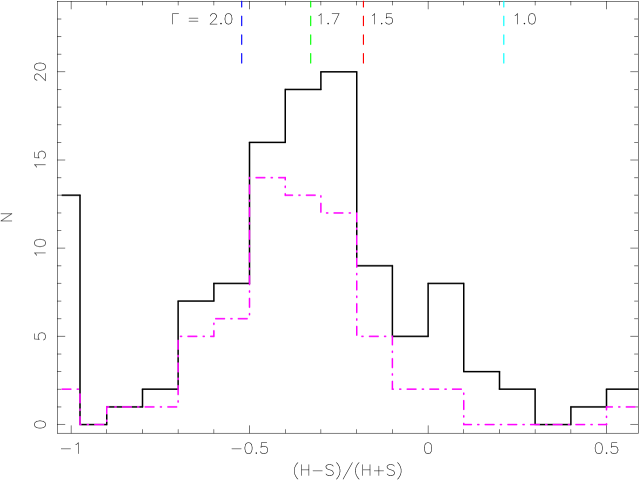
On the right-hand side of Figure 3, we have marked with dashed lines the expected hardness ratios of sources characterised by a pure power-law spectrum of various photon indices (from 0.5 to 2.5) for a fixed column density . On the left-hand side, we have marked with dash-dotted lines the expected hardness ratios for various column densities – cm-2, for a fixed photon index . The majority of sources we detect have hard and soft intensities consistent with a power law of photon index 1.0–2.5 and column densities – cm-2. Histograms of the hardness ratio distribution for all sources and for those sources within 5′ of the M31 nucleus are shown in Figure 4. The hardness ratio plots justify our choice of a power-law spectral model with photon index 1.7 and for our conversion from count rate to luminosity (see Section 4.3).
4.3 Luminosity Distribution
We convert from count rates to unabsorbed luminosities in the – keV range by using an absorbed power-law model with cm-2 and , for a distance of 760 kpc. This gives a count rate to luminosity conversion factor of 1 count s-1 erg s-1. If we take an average of the 23 brightest sources (see Figure 2), we obtain a conversion factor of 1 count s-1 erg s-1, consistent with the previous model. For the brightest source only, a conversion factor of 1 count s-1 erg s-1 is obtained. The observed spread in the values of the conversion factor for sources with different spectral characteristics gives us an estimate of the error (%) in the luminosity of faint sources for which no spectral fit is available. The limiting sensitivity of our sample is erg s-1.
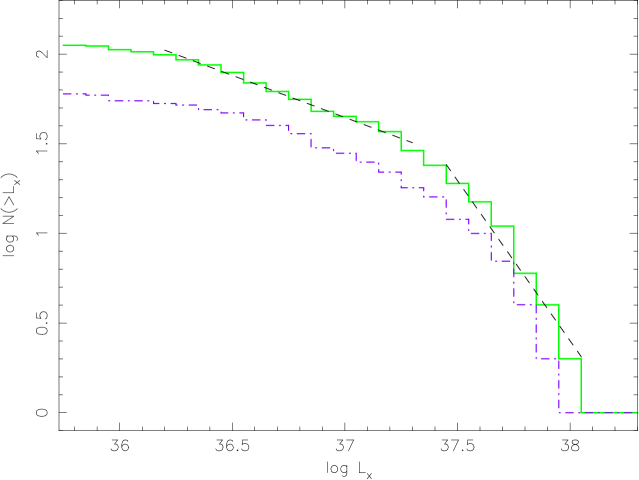
The cumulative luminosity distribution for all the X-ray sources in the EPIC MOS field of view is shown in Figure 5. We also determined a luminosity distribution for the 60 sources detected in core of M31 (′ from the centre); we plot it in Figure 5 as a dash-dotted line. Our data show a flattening of the luminosity distribution for erg s-1. We fitted the low- and high-luminosity sections of the total distribution with simple power laws. For , we obtain a power-law index of ; for , the power-law index is . For the core source distribution, the power-law indices are and respectively. Thus, we find no significant difference in the shape of the distribution for sources in the core compared with the distribution for all the sources out to ′. These results are in agreement with the luminosity distribution found by Primini et al. (1993) and Supper et al. (1997).
Based on Chandra deep field results (Giacconi et al. 2000), we estimate that at the faint end of the luminosity distribution, at , we might expect 10–20 background AGN in the field of view. We would also expect about half that number of foreground K and M stars (following Supper et al. 1997). Correction for the contribution of such foreground/background objects would further flatten the faint end of the full-field-of-view distribution but would not significantly affect the brighter portion of the distribution. In the much smaller core region (′), we estimate the contribution of background AGN or foreground stars to the luminosity distribution above to be minimal, i.e., in the core we expect –3 AGN and 0 or 1 stars brighter than that level.
The – keV observed luminosity of the brightest X-ray source in our sample is erg s-1, corresponding to an emitted luminosity of erg s-1 for the fitted spectral model and column density. For a comparison with earlier ROSAT observations (Primini et al. 1993; Supper et al. 1997), this corresponds to an emitted luminosity of erg s-1 in the – keV band, and of erg s-1 in the – keV band. These values are in agreement with the ROSAT results, when we take into account our different choice of spectral model, column density and distance to M31.
We determine an integrated – keV emitted luminosity erg s-1 for the region at . The background was extracted from regions at , excluding detected sources. The result is insensitive to the exact model used for the spectral fitting and the region selected for the background. The – keV emitted luminosity erg s-1, in agreement with the ROSAT results (Supper et al. 1997). The total – keV contribution of the discrete sources we detected in the core, correcting for an estimated 20% of the counts being in the PSF wings, is erg s-1, i.e., they account for % of the total X-ray emission in the core. If we extrapolate the observed luminosity distribution of the core to a lower limit of erg s-1, we obtain only a small additional contribution of erg s-1based on the power-law index fitted to the distribution at , or even less if the flattening below continues to fainter levels.
5 Diffuse emission
As mentioned in the Introduction, ROSAT results suggested the presence of diffuse X-ray emission in the core of M31 (Primini et al. 1993). Recently, it was reported that Chandra , in spite of its excellent imaging capabilities, does not resolve all the soft X-ray emission from the central part of M31 into individual sources (Garcia et al. 2001). The extent of the unresolved X-ray emission in the XMM-Newton observation is illustrated by a wavelet-deconvolved image in Figure 6. In order to determine the nature of the unresolved emission seen in the image, we performed spectral analysis of several regions in the central part of M31.
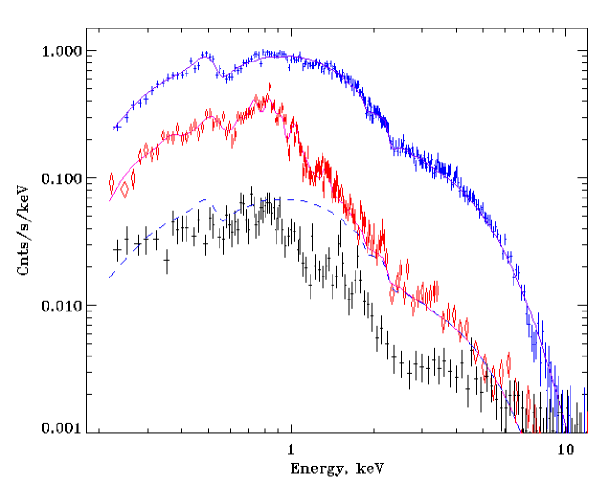
We first extracted the composite spectrum of 44 bright point sources detected within 5′ of the nucleus. Trying to maximise the relative contribution of point sources in this spectrum, we collected only data within small circles around each source, with radii of 10″–30″ (–% encircled energy fraction) depending on the source brightness (smaller radii for fainter sources). We then collected a spectrum from areas where significant unresolved emission is present and no point sources were detected. We collected the background spectrum from the same MOS chip, but outside its central region, in areas where no point sources were detected. We cannot exclude a small contamination of the background by unresolved point sources and faint diffuse emission; however, since the background is much fainter than the point-source and unresolved emission at all but the highest energies (Figure 7), this is not likely to be a significant source of error. The shape of the background spectrum is not significantly affected by vignetting, because, for a given off-axis angle on the central chip, the vignetting function varies with energy by no more than % for keV. The vignetting function at different off-axis angles on the central chip is also relatively flat, decreasing by only 15% from the centre to 5′ off axis and by a total of 25% at 7′ off axis.
We scaled the spectra of the unresolved emission and of the background to the area of the point-source spectrum. We show the background-subtracted point-source and unresolved spectra, along with the background itself, in Figure 7. The point-source spectrum is well fitted with a power law of photon index and absorption column density cm-2. This spectrum is typical of low-mass X-ray binaries (LMXBs) and the column density is close to the Galactic column along the line of sight to M31. In contrast, the spectrum of the unresolved emission cannot be fitted with a single power-law component. Above 2 keV, a power-law component of the same slope as the point-source spectrum is dominant, but a significant soft excess is clearly present below this energy. This soft excess can be fitted with an additional component from an optically-thin thermal plasma (MEKAL) with keV.
Based on the portion of the PSF that fell outside our exclusion region around each point source, we conclude that the power-law component in the spectrum of the unresolved emission is mostly due to point-source counts in the wings of the PSF. A further contribution to this component may come from faint LMXBs below our detection limit. An accurate determination of the relative contribution of PSF wings, unresolved LMXBs, background, and any other component to the hard portion of the unresolved emission will require further knowledge of the instrument performance. We thus defer this task to a future work.
We now turn our attention to the soft portion of the unresolved emission. The fraction of encircled energy inside a chosen angular radius falls with energy for XMM , so that the spectrum of the PSF wings should be harder than the extracted point-source spectrum; thus, the PSF wings cannot contribute to the soft excess in the unresolved emission. Moreover, Figure 7 shows that the contribution of the background in this spectral region is much smaller than the soft excess. Therefore, the soft excess and its thermal-plasma spectrum cannot be explained by instrumental or background effects.
What is the physical nature of this component? It was suggested by Irwin & Bregman (1999) that LMXBs could contribute to the soft excess. However, we have not detected a significant soft component in the LMXB-dominated point-source spectrum. Furthermore, we have shown in Fig. 3 that the fainter sources we detect have a similar or higher hardness ratio than most of the brighter sources. Therefore, we see no evidence that LMXBs might significantly contribute to the soft spectral excess.
We cannot exclude that a population of faint point sources with soft X-ray spectra, different from the population of our detected bright sources, may be responsible for part or all of the soft X-ray excess. However, because the soft excess in the unresolved emission spectrum is well fitted with a thin thermal plasma model with significant line emission, we favour the interpretation of the soft excess as truly diffuse emission from hot, optically-thin plasma.
We fit the background-subtracted spectrum of the total emission within ′ using the thermal-plasma plus power-law model and found that the thermal component contributes 10% of the total unabsorbed spectral flux (0.3–12 keV). We accept this spectrally-determined value as our best estimate of the diffuse-emission contribution to the X-ray luminosity of the bulge of M31. This value is also consistent with our estimate based the discrete source distribution (Section 4.3). We leave a more precise determination of the relative contribution of diffuse emission to the total X-ray flux to a future work when calibration details are more secure.
6 Conclusions
Using XMM-Newton data, we have confirmed that the X-ray emission from the bulge of M31 is dominated by bright point-like sources, most of which are likely to be low-mass X-ray binaries. For sources in the central region of M31, we have confirmed that the luminosity distribution is flatter toward lower luminosities (Primini et al. 1993). The steepening of the luminosity distribution above erg s-1 is indicative of a lack of bright sources in M31 (cf. the source distribution in M33, Long et al. 1996). Only two sources in our sample have a – keV unabsorbed luminosity erg s-1.
As in previous observations with Einstein and ROSAT (Trinchieri & Fabbiano 1991; Primini et al. 1993), significant unresolved emission was found to contribute to the total emission of the bulge. The flattening of the luminosity distribution for fainter sources means that an extrapolation of the detected population of point sources at lower energies cannot account for the total core emission of M31.
A soft excess in the spectrum of the M31 bulge was previously reported in ROSAT and BeppoSAX observations (Irwin & Bregman 1999; Trinchieri et al. 1999). Our analysis of the XMM-Newton data shows that the soft component in the spectrum of the bulge is associated with unresolved emission; this confirms the results of Borozdin & Priedhorsky (2000) based on ROSAT data.
More importantly, our XMM-Newton study has revealed for the first time that while the integrated spectrum of point-like sources is featureless, the spectrum of the unresolved emission shows multiple emission lines typically found in the spectrum of hot, optically thin plasma. Therefore, we suggest that the second significant source of X-ray emission in the bulge is truly diffuse gas with an effective temperature 0.35 keV. The contribution of this gas to the total unabsorbed X-ray luminosity is estimated to be 10% in 0.3–12 keV band (corresponding to erg s-1), but more than 20% in the ROSAT band (0.1–2.4 keV). The significance of this result goes far beyond the case of M31, because the bulge of this galaxy is often considered as a prototype for the population of early-type X-ray galaxies. For example, Sarazin et al. (2000) recently reported that, according to Chandra observations, 23% of X-ray emission from NGC 4697 is emitted by interstellar gas, contrary to their previous expectations (Irwin et al. 2000).
Two more XMM-Newton observations of the central region of M31 are scheduled as part of the Guaranteed-Time program, as are observations of five additional fields along the disk of M31. These will allow us to reach fainter flux levels in the bulge and to study the populations of X-ray sources in different parts of the M31 galaxy.
Acknowledgements.
We thank all the members of the XMM-Newton teams for their work building, operating, and calibrating the powerful suite of instruments on-board.References
- Borozdin and Priedhorsky (2000) Borozdin, K. N. and Priedhorsky, W. C., 2000, ApJL, in press
- den Herder et al. (2001) den Herder, J. W. et al., 2001, A&A, 365 (this issue)
- Garcia et al. (2001) Garcia, M. R. et al., 2001, Proceedings of the XXIV General Assembly of the International Astronomical Union (S205), in preparation
- Garcia et al. (2000) Garcia, M. R., Murray, S. S., Primini, F. A., Forman, W. R., McClintock, J. E., and Jones, C., 2000, ApJ, 537, L23
- Giacconi et al. (2000) Giacconi, R. et al., 2000, ApJ, submitted (astro-ph/0007240)
- Irwin and Bregman (1999) Irwin, J. A. and Bregman, J. N., 1999, ApJ, 527, 125
- Irwin et al. (2000) Irwin, J. A., Sarazin, C. L., and Bregman, J. N., 2000, ApJ, in press (astro-ph/0007408)
- Jansen et al. (2001) Jansen, F. et al., 2001, A&A, 365 (this issue)
- Kahabka (1999) Kahabka, P., 1999, A&A, 344, 459
- Long et al. (2001) Long, K. S., Charles, P. A., Blair, W. P., and Gordon, S. M., 2001, ApJ, 466, 750
- Mason et al. (2001) Mason, K. et al., 2001, A&A, 365 (this issue)
- Osborne et al. (2001) Osborne, J. et al., 2001, A&A, 365 (this issue)
- Primini et al. (1993) Primini, F. A., Forman, W., and Jones, C., 1993, ApJ, 410, 615
- Sarazin et al. (2000) Sarazin, C. L., Irwin, J. A., and Bregman, J. N., 2000, ApJ, in press (astro-ph/0009448)
- Stetson (1987) Stetson, P. B., 1987, PASP, 99, 191
- Strüder et al. (2001) Strüder, L. et al., 2001, A&A, 365 (this issue)
- Supper et al. (1997) Supper, R., Hasinger, G., Pietsch, W., Truemper, J., Jain, A., Magnier, E. A., Lewin, W. H. G., and van Paradijs, J., 1997, A&A, 317, 328
- Trinchieri and Fabbiano (1991) Trinchieri, G. and Fabbiano, G., 1991, ApJ, 382, 82
- Trinchieri et al. (1999) Trinchieri, G., Israel, G. L., Chiappetti, L., Belloni, T., Stella, L., Primini, F., Fabbiano, P., and Pietsch, W., 1999, A&A, 348, 43
- Turner et al. (2001) Turner, M. et al., 2001, A&A, 365 (this issue)
- van den Bergh (2000) van den Bergh, S., 2000, The Galaxies of the Local Group, Cambridge University Press, Cambridge
- van Speybroeck et al. (1979) van Speybroeck, L., Epstein, A., Forman, W., Giacconi, R., Jones, C., Liller, W., and Smarr, L., 1979, ApJ, 234, L45