The eclipsing bursting X-ray binary EXO 0748676 revisited by XMM-Newton
Abstract
The bright eclipsing and bursting low-mass X-ray binary EXO 0748676 has been observed at several occasions by XMM-Newton during the
initial calibration and performance verification (CAL/PV) phase.
We present here the results obtained from observations with the EPIC
cameras.
Apart from several type-I X-ray bursts, the source shows a high degree of variability
with the presence of soft flares.
The wide energy coverage and high sensitivity of XMM-Newton allows for the first
time a detailed description of the spectral variability.
The source is found to be the superposition of a central ( 2 cm)
Comptonized emission, most probably a corona surrounding the inner edge of an accretion
disk, associated with a more extended ( 3 cm) thermal halo
at a typical temperature of 0.6 keV with an indication of non-solar abundances.
Most of the variations of the source can be accounted for by a variable absorption
affecting only the central comptonized component and
reaching up to NH 1.3 cm-2.
The characteristics of the surrounding halo are found compatible with an irradiated atmosphere
of an accretion disc which intercepts the central emission due to the system high inclination.
Key Words.:
Stars: individual (EXO 0748676/UY Vol) - binaries: eclipsing - X-rays: stars - accretion: accretion disc1 Introduction
The X-ray binary EXO 0748676 is unique in showing all types of
variability commonly seen in different low-mass X-ray binaries. The
source was discovered in outburst by the EXOSAT satellite. The
observations revealed the existence of sharp eclipses, intensity dips as
well as repetitive type I bursts which were used to infer the presence
of a neutron star as the compact object and to estimate the distance to
10 kpc (Parmar et al. 1986 hereafter PA86, Gottwald et al. 1986).
More recent observations with the Rossi X-ray Timing Explorer (RXTE)
have also shown that the source exhibits variable ( Hz and kHz)
quasi-periodic oscillations (Homan et al. 1999, Homan & van der Klis
2000). The length of the orbital period (3.82 hr), combined with the
duration of the eclipses, allows the geometry of the system to be
constrained with a high 75∘ inclination and a
0.5 M☉ companion. The presence of residual flux during
eclipses and of dips in the orbital light curve makes EXO 0748676 typical of the ADC (accretion disc corona) sources in which the central
compact source is surrounded by an asymmetric disc with the presence of a
bulge in the outer edge and an extended central hot region (White
et al. 1982).
This complex geometry has prevented so far the different components to be isolated
unambiguously and contradictory interpretations of the spectral variability
have been put forward. From EXOSAT data, Parmar et al. (1986) concluded
to the presence of a cut-off power-law emission whose part was strongly
absorbed. However from ASCA observations, Church et al. (1998) described the
spectrum as the superposition of a point source ( 2 keV) blackbody from the
neutron star and a partially covered Comptonized emission, originating
from the ADC.
The very rich variability of EXO 0748676 makes it an ideal target for
XMM-Newton. The high throughput and large energy coverage of the EPIC cameras
provide for the first time a detailed picture of the system.
We present here the results obtained with the EPIC MOS and PN cameras.
More results on the RGS Grating observations of the source can be found
in Cottam et al. (2001).
2 Observations and data reduction
EXO 0748676 was observed by XMM-Newton at four occasions during the CAL/PV phase, in revolutions 50, 55, 59 and 67 of the satellite. Details on the XMM-Newton mission and on the EPIC MOS and PN cameras can be found in Jansen et al. (2001), Turner et al. (2001) and Strüder et al. (2001).
| Instrument | Mode1/Filter | SR2 | Start time | Texp |
|---|---|---|---|---|
| (2000, UT) | (ks) | |||
| MOS1+2 | FF/Thin | 59 | Apr. 04, 17:18 | 20.0 |
| MOS1+2 | FF/Medium | 67 | Apr. 21, 04:11 | 16.9 |
| PN | FF/Medium | 67 | Apr. 21, 03:59 | 18.1 |
| PN | LW/Medium | 67 | Apr. 21, 09:50 | 3.2 |
| PN | SW/Medium | 67 | Apr. 21, 15:22 | 18.1 |
(1) FF Full Frame, LW Large and SW small window mode
(2) Satellite revolution
Scientific data from EPIC MOS were secured in revolutions 59 and 67 (see Table 1). The data, obtained with a 2.6 s time resolution, were processed with the standard analysis of the XMM Science Analysis System. This involves the removal of bad or hot pixels, and of the electronic noise. For the MOS, X-ray events with pattern 0 to 12 (similar to grades 0-4 in ASCA) were selected. The gain was adjusted with reference to the closest observation in the Closed Calibration position. The source events were selected by applying a mask of radius 1.5′ centered on the source which corresponds to 98% of the energy of the typical point spread function of the telescope (Gondoin et al. 2000). The source is bright and some effects of the pile-up of events might be expected in the FF mode. The average counting rate in each MOS camera, except for the bursts, was found to be between (7-10) event/reading frame which is at the threshold for significant pile-up (see Fig. 6 in Ballet 1999). The pile-up rate is expected to be less than 0.8% so that a moderate effect should affect the most central part of the image.
EPIC PN data are currently available from revolution 67 of XMM-Newton in three different modes (Table 1). For light curves we selected the valid event-patterns (single, double, triple and quadruple; pattern 0-12) while for the spectral analysis only single-events (pattern 0) were used for which an advanced spectral response matrix exists. To avoid pile-up effects only the data from the fastest read-out mode (the SW) was used for the spectral analysis.
3 The varying light curve of EXO 0748676
3.1 The EPIC MOS observations
Light curves were produced by selecting the source events in two different soft S (0.5 - 2 keV) and hard H (2 - 10 keV) energy ranges and adding the counts from the two MOS cameras. The background rate is found negligible with mean values of 0.04 and 0.08 counts s-1, respectively in the soft and hard bands, illustrating the very clean images obtained by XMM-Newton. Figures 1 and 2 show the extreme variability of the source for the two observations. In each observation, an eclipse is clearly seen in the hard band as well as several type I bursts with counting rates reaching up to 25 counts s-1.
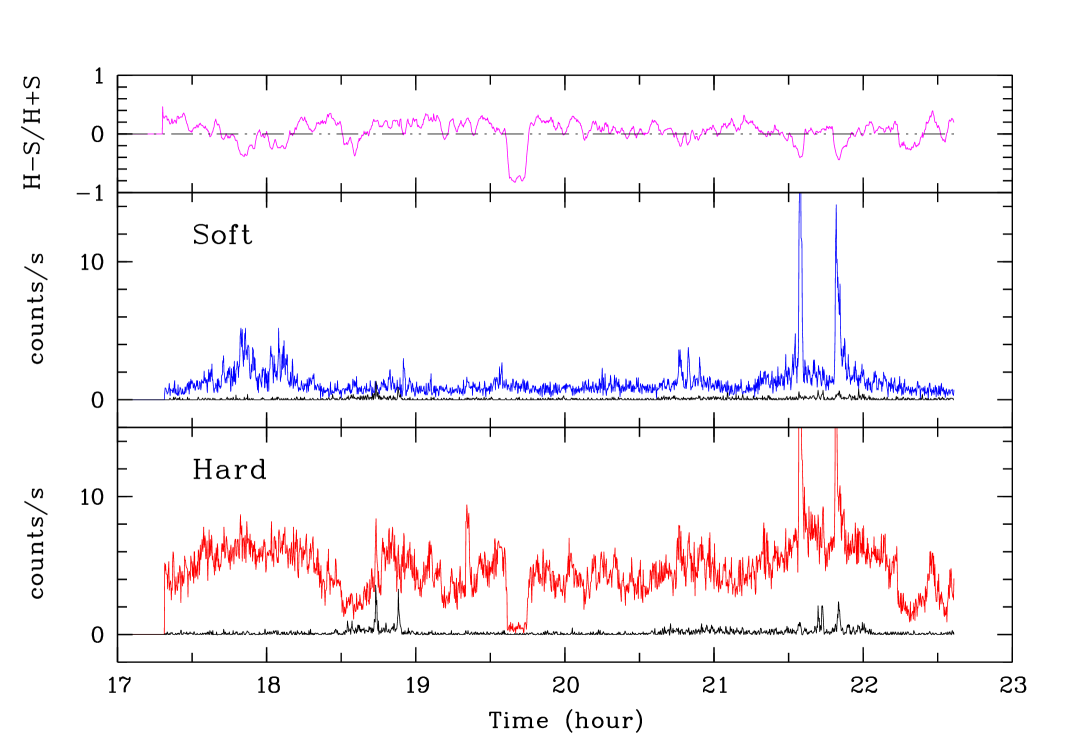
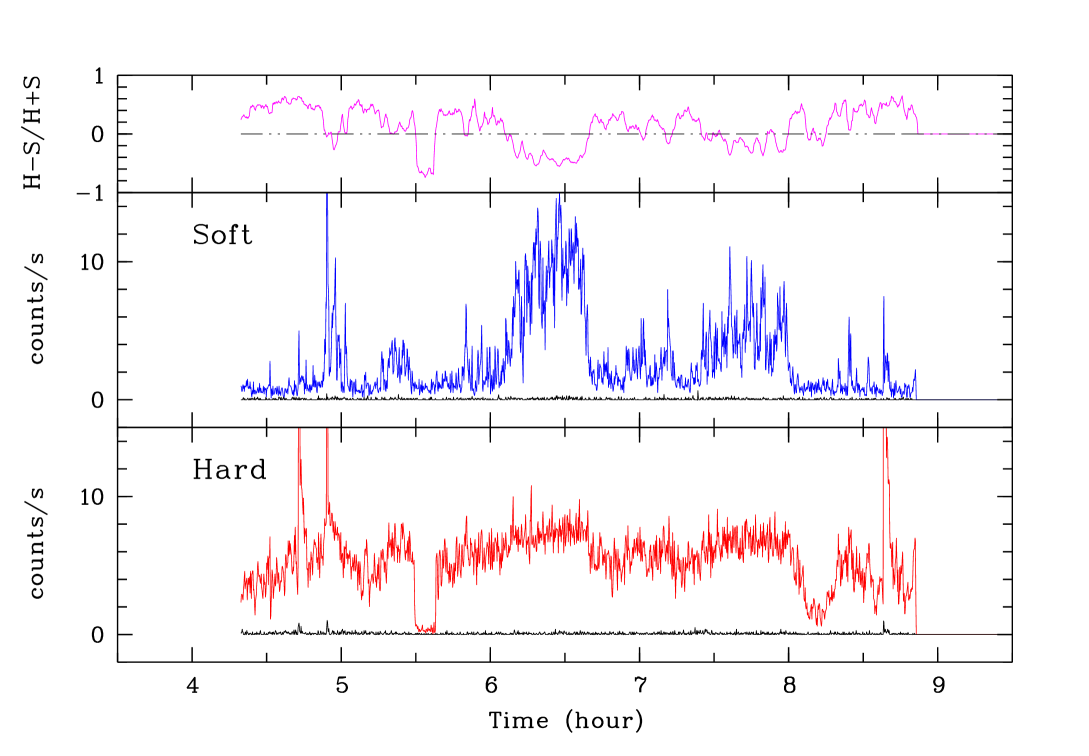
The characteristics of the two eclipses are similar to those reported from EXOSAT (PA86) and RXTE (Hertz et al. 1997). The present lack of exact absolute timing prevents a precise comparison with the source ephemeris. However, the use of the provisional start times listed in Table 1 gives observed mid eclipses times which fall within 17 s (April 4) and 38 s (April 21) of the predicted times using the linear ephemeris of Hertz et al. (1997). More tight constraints on the period changes will be provided when precise absolute timings will be available. Due to the very low background rates, the residual counts in eclipse can be measured for the first time very accurately. In the hard band, the residual counts are (0.500.20) counts s-1 and (0.370.18) counts s-1 on April 4 and 21 respectively, which corresponds to (104)% and (73)% of the corresponding mean flux outside eclipse. Significantly, this ratio, in the time interval corresponding to the hard eclipse, is (8725)% and (3210)% in the soft band. The behaviour of the source is different in the two observations as seen in Fig. 1 and 2.
On 4 April 2000, the variability is mainly confined to the hard band with the presence of two typical dips, around phase 0.7 of the 3.82 hr cycle (where phase 0 is defined as the mid-eclipse time). There is no evidence in the soft band of the eclipse nor of the dips. The hardness ratio, computed as (H-S)/(H+S), is also shown at the top of Fig. 1 and 2. A significant softening is seen during eclipse, bursts and dips. On 21 April 2000, the source appears in a quite different and more active state. An intense flaring activity is seen in the soft band with two major increases of flux arising around phase 0.2 and 0.6. The hardness ratio is marked by a significant softening during these flares.
A similar activity around the same phases has been noted from previous ASCA observations though above 1 keV and with somewhat different energy bands (Church et al. 1998). The lack of information at lower energy has made the interpretation uneasy in this case. The very wide spectral coverage of EPIC allows here a more straightforward separation between the lowest energies (below 2 keV) where the absorption effects are dominant and the higher ones (above 2 keV) where they are negligible (see below). We note also that our definition of the hardness ratio is quite different to that adopted in the 1 - 10 keV range for the EXOSAT observations (PA86).
3.2 The EPIC PN observations
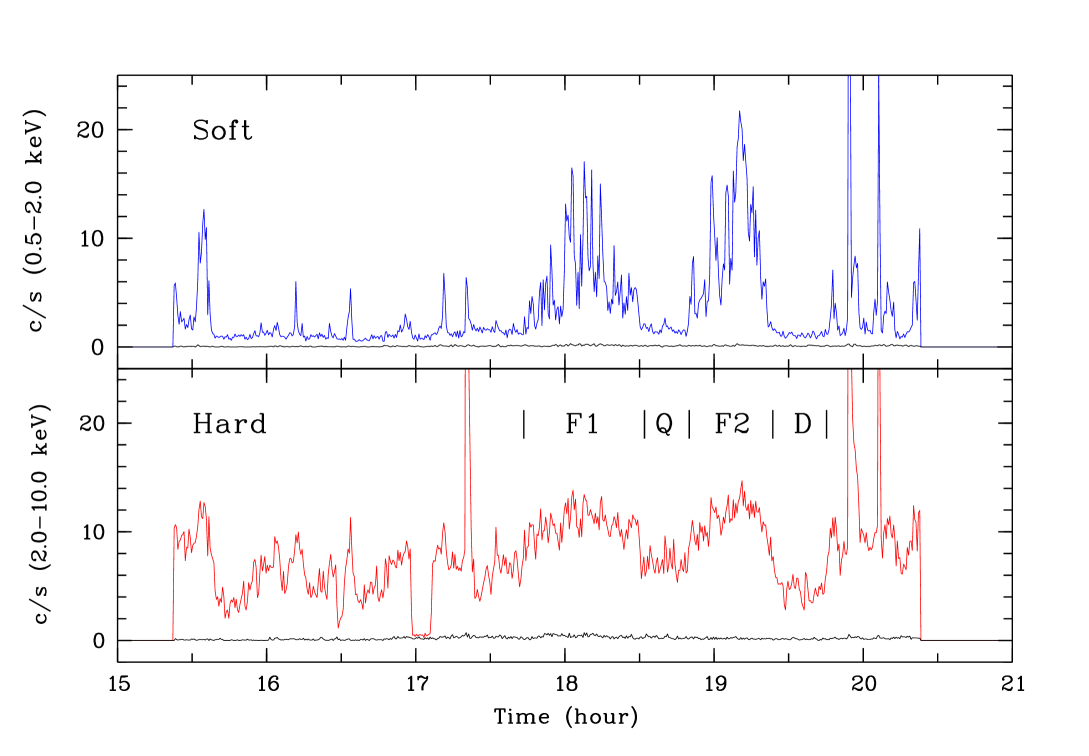
The EPIC PN observations of EXO 0748676 in FF and SW modes on April 21 (see Table 1) were performed accidentally at almost identical binary phases. The light curves are qualitatively identical showing marked features like flaring activity and dips at similar phases. Since during the FF observation also the MOS cameras observed EXO 0748676 (Fig. 2) we show only the EPIC PN light curves of the SW observation in Fig. 3.
4 Spectral variability
Source spectra were accumulated from the EPIC PN data, using a circular extraction region of radius 40″ around the peak surface brightness. Background spectra were created in adjacent regions of the same size. In view of the large variability of the source four representative spectra were chosen by selecting events in time intervals corresponding to the first and second soft flaring episodes (F1 and F2), the between-flare or quiescent interval (Q) and the dip part (D) of the EPIC PN SW observation on April 21 (see Fig. 3). The count rate during this observation was well below the pile-up limit of the SW mode of 100 counts s-1. Spectra were binned to obtain at least 20 counts per bin. The most recent response matrices (version Sept. 2000) were obtained from the hardware groups and the spectra analyzed using the XSPEC package.
Descriptions with a power-law and either a blackbody or a multi-temperature blackbody accretion disc model, as suggested from previous observations, were found inadequate (see Table 2 where reduced values are given for various spectral models). In particular none of the models represents the spectrum around 0.7 keV where a steep decline due to an emission line feature can be seen. This line can be attributed to the O-VIII ion. To model the soft part of the spectra below 2 keV where more lines are visible we therefore tried thermal emission models, keeping in mind that the models available in XSPEC were developed for a thin plasma in collisional equilibrium, while the plasma which likely exists in EXO 0748676 is photo-ionized by hard X-ray emission from a central source (see below).
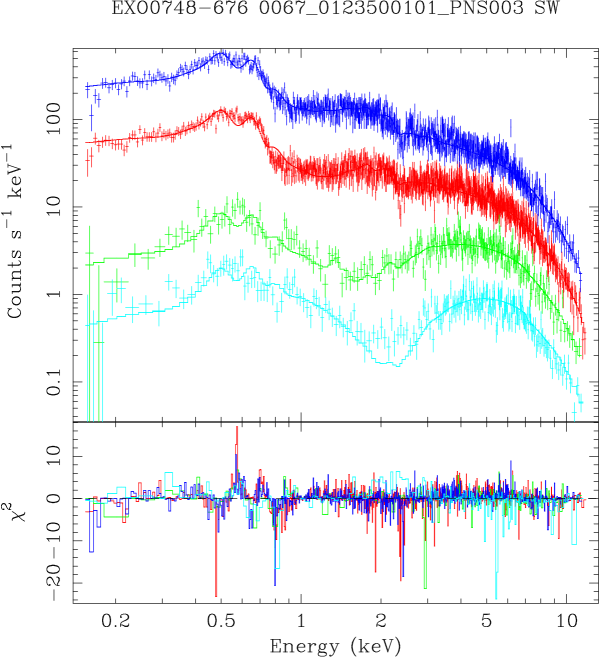
Best fits in the range 0.15 - 10 keV were obtained with a combination of a power-law (PL) and a Raymond-Smith thermal component (RS), each attenuated by individual photo-electric absorption (Morrison & McCammon 1983). Elemental abundances were treated relative to solar (Anders & Grevesse 1989). It was checked that the fits with the Mewe et al (1985) instead of the RS thermal model gives fully consistent results including for the abundances.
The four representative spectra were jointly fitted by the same model. In the power-law component, intensity and index were each kept as single free parameter tied together for all four spectra. Only the column density attenuating this component was allowed to vary individually. Similarly in the thermal component, the temperature and the elemental abundances were tied, but intensity and absorption allowed to vary separately. The abundances of Si and higher Z elements were fixed to zero as is suggested by the RGS spectrum where no emission lines of these elements are found (Cottam et al. 2001). The other abundances were allowed to vary freely. The best fit RS model results in non-solar abundances of N (102), O (0.60.1), Ne (0.020.02) and Mg (0.310.23). The Mg line was only seen in the spectrum between flares. Table 3 summarizes the best fit continuum parameters for the different intensity levels of the source. All quoted errors were determined at of +2.7 around the minimum. The spectra are shown in Fig. 4 with superimposed best fit spectral models. Residual features around emission lines seen below 1 keV are caused by calibration problems of the charge transfer losses in SW mode. In the current version of charge transfer loss correction in SW the event energies are over-corrected by about 10 - 20 eV at energies below 1 keV, i.e. the data points in the spectra are shifted to the right. This causes the typical residual pattern seen in the bottom panel of Fig. 4 where data and model emission lines are shifted slightly against each other in energy. This should affect the derived abundances only slightly and will not affect our conclusions. Other residuals near 2.2 keV are caused by problems in the effective mirror areas around the Au edge.
| Model1 | /dof |
|---|---|
| powerlaw*wabs | 6.66/1071 |
| (powerlaw+bbody)*wabs | 2.10/1069 |
| powerlaw*wabs+bbody*wabs | 1.57/1068 |
| powerlaw*wabs+diskbb*wabs | 1.62/1068 |
(1) Model components as defined in XSPEC
| Power-law | Thermal component | ||||||
| APL (*) | (*) | NH | ARS | kT (keV) (*) | NH | /dof | |
| Flare 1 | 0.0230 (12) | 1.35 (3) | 2.25 (11) | 0.021 (3) | 0.64 (5) | 0.041 (6) | 1.27/2467 |
| Quiescent | 6.43 (28) | 0.009 (2) | 0.145 (26) | ||||
| Flare 2 | 1.48 (10) | 0.033 (4) | 0.044 (6) | ||||
| Dip | 13.1 (6) | 0.011 (2) | 0.22 (3) | ||||
| (*) single parameter in the joint fit to all four spectra | |||||||
| APL in photons cm-2 s-1 keV-1 at 1 keV, photon index, NH in units of 1022 cm-2 | |||||||
| ARS emission measure in units of 10-14/(4d2) nenHdV, | |||||||
| where d is the distance to the source (cm), ne and nH are the electron and hydrogen densities (cm-3) | |||||||
The modulation of the source is mainly due to a strong PL absorption varying from 13.0 cm-2 in the dip to 6 cm-2 in quiescence and down to (1.5 - 2.2) cm-2 during flares. In the same time, the soft RS component is affected by a much lower (0.04 - 0.1) cm-2 absorption increasing only to 0.2 cm-2 during the dip. However, the flares are marked also by a significant increase in the RS intensity.
5 Discussion
The very good sensitivity of the EPIC cameras at energies below 2 keV allows for the first time to build a consistent picture of the source. A straightforward interpretation of its variability can be made with an unique effect of absorption in front of a stable underlying emission with two separated components. The hard component, best described by a power-law, is suggestive of a Comptonized-type spectrum with a high energy break high above the 12 keV XMM-Newton limit. This same component was also identified in EXOSAT and ASCA observations (PA86, Church et al. 1998). However at low energy, the XMM-Newton observations show clearly that the emission is dominated by a thin hot plasma, affected by a much lower absorption than the hard component. This is at variance with previous interpretations involving a second unabsorbed Comptonized spectrum (PA86) or a blackbody emission (Church et al. 1998).
A constraint on the size of the emission area for the hard Comptonized emission is provided by its nearly complete eclipse in the orbital cycle. For a binary orbit with a Porb = 3.82 h, the transition time (T) in and out of eclipses yields a typical size of R = (Mx+Mc)1/3(T/Porb)sin cm, where Mx and Mc are the masses of the compact star and of the companion in M☉ and the inclination of the system. Eclipse transition times are best determined by high time resolution data of 19 eclipses seen by EXOSAT (PA86) and 10 eclipses seen by RXTE (Hertz et al. 1997) which give mean values of 6 s (EXOSAT) and 5 s (RXTE). Assuming a compact star of 1.0 M☉, a 0.45 M☉ companion and an inclination of = 75∘ (PA86), yields a typical radius of the Comptonized emission of = (2.40.5) cm.
On the other hand, the soft thermal component is seen un-eclipsed so that its size should be significantly greater than the companion occulting sphere which, for a Roche lobe filling star on the main sequence is of radius R 7.9Porb(hr) cm (Frank et al. 1992). This corresponds to 3 cm for EXO 0748676.
The picture of the system as seen by XMM-Newton is therefore a rather compact ( 2 cm) Comptonized region as a central hard X-ray source surrounded by a more extended ( 3 cm) hot halo-type thermal emission. This is the opposite to the previous descriptions in which the central source was expected to be a ( 2 keV) blackbody surrounded by a Comptonized emission from the accretion disc corona (ADC) (Church et al. 1998). We stress that the inner Comptonized region is compatible in size with the disturbed inner edge of the accretion disc where low frequency QPOs are expected to form. If the observed (0.58 - 2.44) Hz QPOs (Homan et al. 1999) are indeed produced at the Keplerian frequency in the accretion disc, their distance to the centre is given by = 1.50 108 -2/3(Mx/M☉) cm, where is the QPO frequency, which corresponds to a range of (0.8 - 2.2) cm in radial distance. The ADC is then strictly restricted to the central part of the disc. The spectral variability demonstrates that we always see this inner ADC strongly absorbed even during flares, most probably because of the high inclination and of the occultation by the external parts of the disc including the bulge during the dip.
The most extended halo region is much less absorbed. In fact we note that the lowest best fitting value of NH is a factor two lower than the average galactic column density in this direction NH 1.1 cm-2 (Dickey & Lockman 1998). This is possibly due to the more complex shape of the continuum in this region and a contamination by highly ionized regions in the system which should be accounted for by a warm absorber. The absorption during the dip is a factor 2 higher than the galactic value, revealing that the thermal extended halo is also significantly affected by absorption of the bulge. This is in favour of a flattened rather than spherical halo. The emission measure of this thermal halo in quiescent state is 0.8 cm-3 for a 10 kpc distance. For a spherical halo, with a typical dimension of 3 cm, the electron density will then be 0.8 cm-3. If a flat geometry is assumed, with a radius of 3 cm and a typical height of 109 cm, this density is significantly higher at 5.3 cm-3. We note that very similar values of emission measures and densities are derived from the characteristics of the absorption edges and emission lines of highly ionized elements clearly detected by the RGS at energies lower than 2.5 keV (Cottam et al. 2001). If the central source is seen through such a flat halo, a rough estimate of the absorption is NH . cm-2. This value is consistent with the measured absorption of 6.4 cm-2 (Table 3). The estimated dimension and density of the halo suggest that it may be a hot atmosphere at the surface of an irradiated accretion disc. The high inclination of the system will impose then that the central source is always seen through this extended highly ionized region on top of the accretion disc. A better description of the halo may therefore be in terms of a fully photo-ionized model which is beyond the scope of this letter. Some caution should then be taken in interpreting the abundances derived from a pure collisional RS model.
Assuming a distance of 10 kpc, consistent with a maximum Eddington luminosity in the bursts (Gottwald et al. 1986), the (2 - 10 keV) unabsorbed luminosity of the source is constant at 2.0 erg s-1 which is comparable to the luminosities observed by ASCA and EXOSAT, though at the lowest end. In the total XMM-Newton range, the (0.5 - 10 keV) luminosity only slightly varies from 2.64 (in quiescence) to 2.79 erg s-1 (flares). In this range, the thermal halo luminosity varies from 0.6 (quiescence) to 2.1 erg s-1 (flares), contributing from 2 to 7.5% to the total luminosity. The increase of the halo luminosity is apparently not linked to any simultaneous changes in the central source luminosity. The total increase of energy inside the flares with typical duration of 2000 s is 3 erg. This is only a small fraction of the energy 2 erg released during the bursts. It is then possible that the halo changing luminosity may be due to a delayed re-processing of a previous burst at the surface of the accretion disc.
Acknowledgements.
The results presented are based on observations obtained with XMM-Newton, an ESA science mission with instruments and contributions directly financed by ESA Member States and the USA (NASA).EPIC was developed by the EPIC Consortium led by the Principal Investigator, Dr. M. J. L. Turner. The consortium comprises the following Institutes: University of Leicester, University of Birmingham, (UK); CEA/Saclay, IAS Orsay, CESR Toulouse, (France); IAAP Tübingen, MPE Garching,(Germany); IFC Milan, ITESRE Bologna, IAUP Palermo, Italy. EPIC is funded by: PPARC, CEA, CNES, DLR and ASI.
References
- (1) Anders E., Grevesse N., 1989, Geochimica et Cosmochimica Acta 53, 197
- (2) Church M., Balucinska-Church M., Dotani T., Asai K., 1998, ApJ 504, 516
- (3) Cottam J., Kahn S.M., Brinkman A.C., den Herder J.W., Erd C., 2001, A&A 365 (this issue)
- (4) Dickey J. M., Lockman F. J. 1990, ARA&A 28, 215
- (5) Frank J., King A., Raine D., 1992, in Accretion Power in Astrophysics, Camb Univ. Press
- (6) Gondoin Ph., Aschenbach B., Erd C., et al., 2000, SPIE
- (7) Gottwald M., Haberl F., Parmar A., White N., 1986, ApJ 308, 213
- (8) Hertz P., Wood K., Cominsky L., 1997, ApJ 486, 1000
- (9) Homan J., Jonker P., van der Klis M., van Paradijs I., 1999, ApJ 516, L91
- (10) Homan J., van der Klis M., 2000, ApJ 539, 847
- (11) Jansen F., Lumb D., Altieri B., et al., 2001, A&A 365 (this issue)
- (12) Mewe, R., Gronenschild E. H., van den Oord G. H., 1985, A&AS, 62, 197
- (13) Morrison R., McCammon D., 1983, ApJ, 270, 119
- (14) Parmar A., White N., Giommi P., Gottwald M., 1986, (PA86), ApJ 308, 199
- (15) Strüder L., Briel U., Dennerl K., et al., 2001, A&A 365 (this issue)
- (16) Turner M.J.L., Abbey A., Arnaud M., et al., 2001, A&A 365 (this issue)
- (17) White N., Holt S., 1982, ApJ 257, 318