Modelling gaseous and stellar kinematics in the disc galaxies NGC 772, NGC 3898, and NGC 7782††thanks: Based on observations carried out at the Multiple Mirror Telescope Observatory (Arizona, USA) which is a joint facility of the Smithsonian Institution and the University of Arizona, with the Isaac Newton Telescope which is operated on the island of La Palma by the Isaac Newton Group in the Spanish Observatorio del Roque de los Muchachos of the Instituto de Astrofísica de Canarias, and with the Vatican Advanced Technology Telescope, which is the Alice P. Lennon Telescope and the Thomas J. Bannan Astrophysics Facility at the Mount Graham International Observatory (Arizona, USA). , ††thanks: Tables 4 to 12 are only available in electronic form at the CDS via anonymous ftp to cdsarc.u-strasbg.fr (130.79.128.5) or via http://cdsweb.u-strasbg.fr/Abstract.html.
Abstract
We present band surface photometry and major-axis kinematics of stars and ionized gas of three early-type spiral galaxies, namely NGC 772, NGC 3898 and NGC 7782. For each galaxy we present a self-consistent Jeans model for the stellar kinematics, adopting the light distribution of bulge and disc derived by means of a two-dimensional parametric photometric decomposition. This allowed us to investigate the presence of non-circular gas motions, and derive the mass distribution of luminous and dark matter in these objects.
NGC 772 and NGC 7782 have apparently normal kinematics with the ionized gas tracing the gravitational equilibrium circular speed. This is not true in the innermost region () of NGC 3898 where the ionized gas is rotating more slowly than the circular velocity predicted by dynamical modelling. This phenomenon is common in the bulge-dominated galaxies for which dynamical modelling enables us to make the direct comparison between the gas velocity and the circular speed, and it poses questions about the reliability of galaxy mass distributions derived by the direct decomposition of the observed ionized-gas rotation curve into the contributions of luminous and dark matter.
keywords:
galaxies: individual: NGC 772, NGC 3898, and NGC 7782 — galaxies: kinematics and dynamics — galaxies: spiral — galaxies: formation — galaxies: structure1 Introduction
In the past kinematic and dynamical studies of disc galaxies have been mainly focused on late-type spirals. With respect to lenticular and early-type spiral galaxies (defined as those with , following Simien & de Vaucouleurs 1986), the study of late-type spirals has many advantages from both the observational and interpretative points of view. Late-type spirals have small or even negligible bulges, so they are usually described as luminous discs embedded in dark matter halos. They are on average more gas-rich than early-type spirals. Gas is mainly confined in the galactic disc, considered moving at circular speed and therefore used as direct tracer of the gravitational potential. Since the line-of-sight velocity distribution (LOSVD hereafter) of ionized or neutral hydrogen is easier to measure than the stellar one, the number of spirals of known gaseous kinematics increased faster than that of the galaxies for which stellar motions were measured. These facts made late-type spirals easy targets, particularly in the search for dark matter (see Sofue & Rubin 2001 for a review).
Only recently Heraudeau & Simien (1998) and Heraudeau et al. (1999) measured the stellar rotation curves and velocity-dispersion profiles along the major axis of a large sample of spirals (more than 60 objects) ranging from Sa to Sc. In last years systematic surveys have been started to derive the stellar and gaseous kinematics in S0’s (Bertola et al. 1995; Fisher 1997; Bettoni & Galletta 1997) and in early-to-intermediate type spirals (Corsini et al. 1999; Vega Beltrán 1999; Vega Beltrán et al. 2000).
If the direct comparison of stellar and gaseous kinematics allowed to unveil also in disc galaxies the presence of kinematically-decoupled components (see Bertola & Corsini 1999 for a recent review), the application of dynamical models showed that in the bulge-dominated region the ionized-gas velocity may fall below the circular speed (Fillmore, Boroson & Dressler 1986; Kent 1988; Kormendy & Westpfahl 1989). These ‘slowly-rising’ rotation curves have been interpreted as the signature of the presence of pressure-supported gas (Bertola et al. 1995; Cinzano et al. 1999), which has been recently expelled by stars of the bulge but not yet heated to the virial temperature of the galaxy. This discovery poses new questions about the reliability of galaxy mass distributions derived by the decomposition of the observed ionized-gas rotation curve into the contributions of luminous and dark matter. In fact the inner gradient of the gas velocity curve is usually used to fix the amount of luminous matter, which results to be underestimated if gas velocity rises slowly than circular speed.
In this paper we present a study of the ionized-gas and stellar kinematics for 3 Sa – Sb galaxies, namely NGC 772, NGC 3898, and NGC 7782. We apply a self-consistent dynamical model based on a two-dimensional photometric decomposition method to explain the different kinematical behaviour of gas and stars. The goal of this work is to derive the mass distribution of these objects and investigate the possible presence of non-circular gas motions in the bulge region.
The paper is organized as it follows. In Sect. 2 we give an overview of the properties of NGC 772, NGC 3898 and NGC 7782; in Sect. 3 we present the broad and narrow-band imaging and major-axis kinematics of stars and ionized gas; in Sect. 4 we discuss the photometric and dynamical techniques adopted to investigate the light and mass distribution of these galaxies; in Sect. 5 we apply these techniques to the galaxies, deriving their structural and kinematic parameters; finally, Sect. 6 is devoted to the discussion of the results and conclusions.
2 Global properties of NGC 772, NGC 3898 and NGC 7782
The galaxies studied in this paper are a subset of the 20 disc galaxies observed by Vega Beltrán et al. (2000). All these galaxies are bright () and nearby objects ( ) with an intermediate-to-high inclination () and their Hubble morphological types run from S0 to Sc.
Since the presence of ionized-gas supported by non-circular motions have been observed only in lenticular or bulge-dominated spiral galaxies, we focused our attention on S0 – Sb galaxies. We selected unbarred galaxies according to the classification of both Sandage & Tammann (1981, hereafter RSA) and de Vaucouleurs et al. (1991, hereafter RC3). To better disentangle the contributions of the bulge, the disc and eventually of the dark matter halo to the total mass of the galaxy we choosed between the sample objects those with the more extended ionized-gas and stellar kinematics (in units of ). At the end of this selection process we remained with five galaxies: an S0 (NGC 980), two Sa (NGC 772 and NGC 5064) and two Sb spirals (NGC 3898 and NGC 7782).
All the selected galaxies display a smooth and regular morphology, except for NGC 772 which is characterized by a strong lopsidedness (Fig. 6). However the symmetry of velocity curves and velocity-dispersion profiles of both ionized gas and stars (Fig. 2) suggests us that also NGC 772 has an axisymmetric structure at least in the radial region were the kinematic parameters were measured (corresponding to ).
An accurate analysis of the photometric and kinematic properties of the selected galaxies (see Vega Beltràn 1999 for details) showed that the surface brightness of NGC 980 is characterized by a strong twisting of the isophotes and that the LOSVD profiles of NGC 5064 have a strongly non-Gaussian shape. We interpreted these two phenomena as due to the misalignment between bulge and disc of NGC 980 (or even to the presence of a triaxial bulge) and to the possible coexistence in NGC 5064 of two counterrotating components, respectively. Therefore the two galaxies were discarded and are not studied here.
An overview of the properties of the remaining galaxies, namely NGC 772, NGC 3898 and NGC 7782 which will be the subject of our investigation, is given in Table 1. Their available photometric and kinematical data are listed here briefly.
| Parameter | NGC 772 | NGC 3898 | NGC 7782 |
|---|---|---|---|
| Other name | UGC 1466; PGC 7525 | UGC 6787; PGC 36921 | UGC 12834; PGC 72788 |
| Morphological type | Sb(rs)I; Sb; SAS3 | SaI; Sa; SAS2 | Sb(s)I-II; Sb; SAS3 |
| Heliocentric systemic velocity () | |||
| Distance (Mpc) | 34.7 | 17.1 | 75.2 |
| Major-axis position angle | |||
| Apparent isophotal diameters | |||
| Inclination | |||
| Apparent magnitude (mag) | 10.31 | 10.70 | 12.23 |
| Total color index (mag) | 0.78 | 0.90 | 0.85 |
| Total corrected luminosity (L⊙,V) | |||
| H I linewidth at of the peak () | 473 | 504 | 570 |
| H I linewidth at of the peak () | 410 | 469 | 559 |
| Mass of neutral hydrogen (M⊙) | |||
| Mass of cool dust (M⊙) |
a from RSA.
b from Nilson (1973, hereafter UGC).
c from RC3. The apparent isophotal diameters are measured at a surface brightness level of .
d from this paper. The distance is derived as with the velocity relative to the centroid of the Local Group obtained from the heliocentric systemic velocity as in RSA and Mpc-1. The inclination is derived as , where the observed axial ratio is taken from RC3 and an intrinsic flattening of has been assumed following Guthrie (1992).
e from Rhee & van Albada (1996), the neutral hydrogen mass has been scaled for the adopted distance.
f from van Driel & van Woerden (1994), the neutral hydrogen mass has been scaled for the adopted distance.
g from Krumm & Salpeter (1980), the neutral hydrogen mass has been scaled for the adopted distance.
h derived following Young et al. (1989) from the IRAS flux densities at 60 and 100 m (Moshir et al. 1990).
2.1 NGC 772
Surface photometry of NGC 772 was obtained in the band by Lu (1998), who also derived the photometric parameters of the exponential disc, and in the and bands by Heraudeau & Simien (1996). NGC 772 belongs to the sample of 34 early-to-late spiral galaxies, whose major-axis stellar velocities has been recently measured by Heraudeau & Simien (1998). NGC 772 was observed in the 21-cm line of neutral hydrogen by Rhee & van Albada (1996), who obtained the H I position-velocity map, global velocity profile and radial surface density distribution. These data show the asymmetric distribution of the H I at radii larger than from the centre. On the NW side a low rotation-velocity ( ) component can be traced out to , while on the SE the H I emission extends to with a rotation velocity of .
2.2 NGC 3898
Surface photometry of NGC 3898 is available in (Barbon, Benacchio & Capaccioli 1978; Boroson 1981), (Watanabe 1983; Kodaira, Okamura & Ichikawa 1990; Heraudeau & Simien 1996), (Heraudeau & Simien 1996), (Kent 1988), (Giovanardi & Hunt 1996; Moriondo, Giovanardi & Hunt 1998a), (Giovanardi & Hunt 1996), and band (Giovanardi & Hunt 1996; Moriondo et al. 1998a). Whitmore, Rubin & Ford (1984), Fillmore et al. (1986), Heraudeau et al. (1999) measured the major-axis stellar velocity curve and velocity-dispersion profile of NGC 3898. The ionized-gas rotation curve was obtained along the galaxy major axis by Rubin et al. (1985) and Fillmore et al. (1986). The distribution and velocity field of H I were studied in detail by van Driel & van Woerden (1994), who also derived using the maximum-disc hypothesis (van Albada & Sancisi 1986) the mass contribution of bulge, disc and dark halo by fitting the combined H/H I rotation curve using the photometric parameters of bulge and disc obtained from Watanabe’s (1983) surface-brightness profile. Other mass models for NGC 3898 have been obtained by Fillmore et al. (1986) using both gas and stellar kinematics and by Kent (1988) and Moriondo, Giovanardi & Hunt (1998b) who adopted the ionized-gas kinematics by Rubin et al. (1985).
2.3 NGC 7782
Surface photometry of NGC 7782 has been obtained in the band (Kodaira et al. 1990), the band (Courteau 1996) and the band (Moriondo et al. 1999). The only available bulge-disc decomposition for NGC 7782 is that of Baggett, Baggett & Anderson (1998) based on the data of Kodaira et al. (1990). No spatially resolved kinematics for the gaseous and stellar components have been obtained for this galaxy either at optical or at radio wavelengths.
3 Observations and data reduction
3.1 Long-slit spectroscopy
The spectroscopic observations of NGC 772, NGC 3898 and NGC 7782 were carried out in two different runs during October and December 1990 at the 4.5-m Multiple Mirror Telescope (MMT) on Mt. Hopkins (Arizona, USA). The 1200 grating blazed at 5767 Å was used in the first order in combination with a slit and the Loral CCD with pixels of . It yielded a wavelength coverage of 650 Å between 4850 and 5500 Å with a reciprocal dispersion of 54.7 . No on-chip binning was performed and every spectrum pixel corresponded to 0.82 Å by .
NGC 3898 was also observed at the Isaac Newton Telescope (INT) in La Palma (Spain) on March 19, 1996. The Intermediate Dispersion Spectrograph (IDS) was used with a slit, the 500 mm camera, the AgRed collimator, and the H1800V grating with 1800 grooves at first order. This instrumental set-up yielded a wavelength coverage of Å between 6650 Å and 6890 Å with a reciprocal dispersion of 9.92 . No on-chip binning was applied on the adopted 10241024 TK1024A CCD. Each 24 m 24 m spectrum pixel corresponds to 0.24 Å by .
| Object | Date | Telescope | texp | P.A. |
|---|---|---|---|---|
| [s] | [∘] | |||
| NGC 772 | 22 Oct 1990 | MMT | 130 | |
| NGC 3898 | 18 Dec 1990 | MMT | 107 | |
| 19 Mar 1996 | INT | 107 | ||
| NGC 7782 | 22 Oct 1990 | MMT | 175 |
At the beginning of each exposure, the slit was centred on the galaxy nucleus using the guiding TV camera and aligned along the galaxy major axis. The details on the slit position and spectra exposure times are given in Table LABEL:tab:log_spectroscopy. At the MMT spectra of a number of late-G and early-K giant stars were obtained with the same set up to serve as templates in measuring the stellar kinematics. In all observing runs, comparison exposures of the arc lamp were taken before and after each object integration to allow an accurate wavelength calibration. Quartz-lamp and twilight-sky flat fields were used to map pixel-to-pixel sensitivity variations and large-scale illumination patterns. The seeing during the observations was typically between and FWHM.
Using standard MIDAS111MIDAS is developed and maintained by the European Southern Observatory routines the spectra were bias subtracted, flat-field corrected and wavelength calibrated. Cosmic rays were identified by comparing the counts in each pixel with the local mean and standard deviation (as obtained by the Poisson statistics of the photons knowing the gain and readout noise of the detector), and corrected by interpolating. The instrumental resolution was derived by measuring the Gaussian FWHM of a dozen of unblended arc-lamp lines distributed over the whole spectral range of a wavelength-calibrated comparison spectrum. We found a mean value of Å and of Å for the MMT spectra obtained in October 1990 and December 1990, respectively. They correspond to an instrumental velocity dispersion of and at 5150 Å. For the INT spectra we measured a mean Å that, in the range of the observed gas emission lines, corresponds to an instrumental velocity dispersion of .
The stellar kinematic parameters were measured from the absorption lines present on MMT spectra using the Fourier Correlation Quotient method (Bender 1990), as applied by Bender, Saglia & Gerhard (1994). The spectra of the G5III star HR 7778 and K2III star HR 6415 provided the best match to galaxy spectra obtained in October and December 1990, respectively, so they were used as templates to measure the galaxy stellar velocities in the two runs. The stellar kinematics of NGC 772, NGC 3898 and NGC 7782 are discussed in Sects. 5.1.1, 5.2.1, and 5.3.1, and the key parameters are tabulated in Tabs. 4, 5 and 6. Each table provides the radial distance from the galaxy centre in arcsec, the observed heliocentric velocity and the velocity dispersion in , and the Gauss-Hermite coefficients and .
The ionized-gas kinematics was derived by measuring the position and width of the [O III] and H emission lines in the MMT and INT spectra, respectively. Using the MIDAS package ALICE we fitted interactively a Gaussian to the emission line and a polynomial to its surrounding continuum. The central wavelength and FWHM (corrected for instrumental FWHM) of the fitting Gaussian were converted into radial velocity and velocity dispersion, respectively. The resulting velocities were corrected to the heliocentric frame of reference. At radii where the intensity of the relevant emission was low, we averaged from 3 to 7 adjacent spectral rows to improve the signal-to-noise ratio of the line. The ionized-gas kinematics of NGC 772, NGC 3898 and NGC 7782 are described in Sects. 5.1.1, 5.2.1, and 5.3.1, and the key parameters are tabulated in Tabs. 7, 8 and 9. Each table provides the radial distance from the galaxy centre in arcsec, the [O III] (and the H only for NGC 3898) observed heliocentric velocity and velocity dispersion in .
3.2 Broad-band imaging
The broad-band imaging of the three galaxies was carried out at the 1.83-m Vatican Advanced Technology Telescope (VATT) operated in the Mt. Graham International Observatory (Arizona, USA) in two observing runs on March and November 1997. A back-illuminated Loral CCD with m2 pixels was used as detector at the aplanatic Gregorian focus (f/9) of the telescope. It yielded a field of view of with an image scale of pixel-1 after a pixel binning. The gain and the readout noise were 1.4 e- ADU-1 and 6.5 e-, respectively.
At regular intervals during each night, different bias frames (typically ten) were taken to check possible slight bias-level variations. All galaxies were observed twice in the Johnson band. The date and the duration of all the exposures are given in Table LABEL:tab:log_imaging. A number of twilight sky flats were taken at the beginning and at the end of the nights. No photometric standard was observed.
| Object | Date | Filter | texp | Seeinga |
|---|---|---|---|---|
| [s] | [′′] | |||
| NGC 772 | 02 Nov 1997 | 1.7 | ||
| 07 Nov 1997 | r6450 | 1.9 | ||
| 07 Nov 1997 | r6630 | 1.8 | ||
| NGC 3898 | 11 Mar 1997 | 1.4 | ||
| 11 Mar 1997 | r6450 | 1.3 | ||
| 11 Mar 1997 | r6580 | 1.3 | ||
| NGC 7782 | 02 Nov 1997 | 2.2 | ||
| 10 Nov 1997 | r6450 | 1.8 | ||
| 10 Nov 1997 | r6680 | 2.2 |
a Seeing FWHM measured on the final resulting frame.
The data reduction was carried out using standard IRAF222IRAF is distributed by the National Optical Astronomy Observatories which are operated by the Association of Universities for Research in Astronomy (AURA) under cooperative agreement with the National Science Foundation. routines. All the frames were bias subtracted and corrected for pixel-to-pixel intensity variations by using a mean flat field for each night. The different frames of each galaxy were shifted and aligned to an accuracy of a few hundredths of a pixel using common field stars as reference. After checking that their point spread functions (PSF) were comparable, the frames were averaged to obtain a single band image. The cosmic rays were identified and removed during the averaging routine. Two-dimensional Gaussian fits to the field stars in the resulting images yielded the final FWHM measurement of seeing PSF listed in Table LABEL:tab:log_imaging. In each final frame the mean value of the sky level was determined in a large number of pixel areas. These areas were selected in empty regions of the frames, which were free of objects and far from the galaxy to avoid the contamination of the light of field stars and galaxies as well as of the target galaxy itself. The sky value of each frame is the average of these mean values. For the estimate of error in the sky determination we adopted half the difference between the maximum and minimum of the mean values obtained for the small areas.
For each galaxy we derived a ‘luminosity growth curve’ by measuring the integrated magnitudes within circular apertures of increasing radius by means of the IRAF task ELLIPSE within the STSDAS package. Absolute calibration was performed by fitting the constant portion of the growth curves (Fig. 1) to the corresponding total magnitude given by RC3.

Before fitting ellipses to the galaxy images, we removed the field stars using the IRAF routines within the DAOPHOT package. Special care was taken to remove satured stars and field galaxies which were edited out by hand, and removed by replacing them with the local average of counts. When bright stars were too close to the galaxy their light was masked out to where the galaxy light started to be dominant. For each galaxy we derived the surface-brightness profile and isophotal shape parameters by ellipse fitting to its isophotes using the isophote fitting program ELLIPSE (see Jedrzejewky 1987 for details on the fitting procedure). The resulting surface brightness, ellipticity, position angle and Fourier coefficient radial profiles for NGC 772, NGC 3898, and NGC 7782 are presented in Sects. 5.1.2, 5.2.2, and 5.3.2, and tabulated in Tabs. 10, 11, and 12. Each table provides the isophotal semi-major axis in arcsec, surface brightness in mag arcsec-2, ellipticity, position angle in degrees, and the Fourier coefficient.
3.3 Narrow-band imaging
The narrow-band H imaging of NGC 772, NGC 3898 and NGC 7782 was performed at the VATT in the same observing runs, during which we obtained the band images.
For each galaxy we obtained at least two emission-band and two continuum-band images using the set of interference filters kindly provided by R.C. Kennicutt. The emission-band images were taken with three different interference filters ( Å, Å, and Å respectively for NGC 772, NGC 3898 and NGC 7782; Å) in order to isolate the spectral region characterized by the redshifted H and [N II] (6548.0, 6583.4 Å) emission lines according to galaxy systemic velocity. The continuum-band images were taken through an interference filter ( Å; Å), which has been selected to observe an emission-free spectral region sufficiently near to that of the emission-band filters in order to subtract off the stellar continuum in the emission-band images. Duration, date and filter of all the in-band and off-band exposures are collected in Table LABEL:tab:log_imaging. Flat-field exposures of the twilight sky were taken at dawn and sunset for each filter.
The narrow-band images of the target galaxies were bias subtracted, flat-field corrected, aligned, averaged and cleaned of cosmic ray events in the same way as for the broad-band images. As result of this standard data reduction we obtained for each galaxy a single emission-band image and a single continuum-band image. The seeing FWHM’s of these images as measured by fitting a two-dimensional Gaussian to the field stars are listed in Table LABEL:tab:log_imaging. For each galaxy the best-seeing image was convolved with a Gaussian PSF to yield the same PSF FWHM of the worst-seeing image. Finally the continuum-band image was suitably scaled and subtracted from the emission-band image to obtain a continuum-free map of the H[N II] emission of the galaxy. The scale factor for the continuum-band image was estimated by comparing the intensity a large number of field stars in the two bandpasses. The resulting continuum-band and continuum-free images of NGC 772, NGC 3898 and NGC 7782 are given in Sects. 5.1.3, 5.2.3, and 5.3.3.
4 Structure models
In order to describe the mass structure of each galaxy, we have to take advantage of both the photometric and kinematic data available.
We describe each galaxy by the superposition of two different components, namely a bulge and a disc. Both the components are assumed to be oblate, with the isodensity surfaces being similar concentric spheroids. In this framework, what we call a ‘disc’ is in fact a spheroidal component with a very high ellipticity, which we assume to be constant with radius.
Once the luminosity density parameters are constrained by the photometry (Sect. 4.1), we use the kinematics to evaluate the mass-to-light ratios and to discuss the gas velocity distribution.
4.1 Photometric decomposition
Conventional bulge-disc photometric decompositions based on elliptically averaged surface-brightness profiles are subject to strong systematic errors due to the different intrinsic shapes of bulge and disc and to the viewing angle of the galaxy (see Byun & Freeman 1995 for an extensive discussion). For this reason we applied to the band images of NGC 772, NGC 3898 and NGC 7782 a two–dimensional parametric decomposition technique. The bulge and disc photometric parameters used as the initial trial in modelling the observed kinematics were derived by fitting directly the galaxy surface-brightness distributions. Our decomposition method is based on the technique developed by Byun & Freeman (1995) which we improved by introducing convolution with the seeing PSF and by weighting the observed surface brightness measured in each pixel according to the associated Poissonian noise and CCD readout noise.
4.1.1 Two-dimensional bulge-disc parametric decomposition
We assumed the galaxy surface-brightness distribution to be the sum of the contributions of an oblate bulge and an infinitely thin disc. We adopted the law (de Vaucouleurs 1948) to describe the surface brightness of the bulge component
| (1) | |||||
where and are respectively the effective surface brightness and effective radius of the bulge. and are the apparent distances from galactic centre along the major and minor axis, and is the apparent axial ratio of bulge. Bulge isophotes are ellipses with constant apparent ellipticity .
The disc component is assumed to have an exponential surface brightness (Freeman 1970)
| (2) |
where and are respectively the disc central surface brightness and scale length. and the apparent distances from galactic centre along the major and minor axis, and is the apparent axial ratio of disc. Disc isophotes are ellipses with constant apparent ellipticity and the disc inclination is .
| Object | Bulge | Disc | Fita | ||||||||
| i | |||||||||||
| [mag arcsec-2] | [′′] | [kpc] | [mag arcsec-2] | [′′] | [kpc] | [∘] | |||||
| NGC 772 | 22.7 | 60.5 | 10.2 | 0.66 | 21.5 | 96.3 | 16.2 | 0.39 | 67 | 1D | |
| 22.8 | 65.4 | 11.0 | 0.77 | 21.3 | 67.0 | 11.3 | 0.62 | 52 | 2D | ||
| NGC 3898 | 20.9 | 25.6 | 2.1 | 0.64 | 21.6 | 45.9 | 3.8 | 0.37 | 68 | 1D | |
| 20.6 | 18.9 | 1.6 | 0.71 | 20.4 | 29.0 | 2.4 | 0.52 | 59 | 2D | ||
| NGC 7782b | 20.2 | 3.6 | 1.3 | 0.85 | 20.5 | 23.3 | 8.5 | 0.41 | 66 | 1D | |
| 19.9 | 2.9 | 1.1 | 0.71 | 20.3 | 21.6 | 7.8 | 0.56 | 56 | 2D | ||
a 1D = parametric fit on the ellipse-averaged profiles, 2D = two-dimensional parametric fit.
b For NGC 7782 the best-fit to the observed surface-brightness distribution has been obtained adopting an exponential bulge (see discussion in Sec. 5.3.4).
To derive the photometric parameters of the bulge (, and ) and the disc (, and ) we fitted iteratively a model of the surface brightness to the observations using a non-linear minimization based on the Levenberg-Marquardt method (e.g. Bevington & Robinson 1992; Press et al. 1996).
The galaxy centre, the bulge and disc position angles, as well as the sky level are not free parameters in our decomposition. The galaxy centre is assumed to be the mean centre of the ellipses which fit the galaxy isophotes. Bulge and disc are assumed to have the same position angle which is the mean value of the major-axis position angle of ellipses which fit the galaxy isophotes. The sky level is estimated as described in Sect. 3. The seeing effects were taken into account by convolving the model image with a circular Gaussian PSF with the FWHM measured using the stars in the image (Table LABEL:tab:log_imaging). The convolution was performed as a product in Fourier domain before the minimization.
For each pixel , the observed galaxy photon counts are compared with those predicted from the model . Each pixel is weighted according to the variance of its total observed photon counts due to the contribution of both galaxy and sky, and determined assuming photon noise limitation. Therefore we can write
| (3) |
with and ranging over the whole pixel image.
To derive the six free parameters of the model surface-brightness distribution, we adopted as the initial trial for minimization the values obtained by performing a standard photometric decomposition with a parametric technique similar to that adopted by Kent (1985). In fact we decomposed the observed surface-brightness profile along both the major axis (obtained by fitting ellipses to isophotes) and the minor axis (obtained from the major-axis profile scaled by the factor ) as the sum of an oblate bulge plus an exponential infinitely thin disc. To take into account the seeing effect, we truncated the major and minor-axis profiles at a radius corresponding to a couple of PSF FWHM from the centre. We assumed the minor-axis profiles of bulge and disc to be the same as the major-axis profile scaled respectively by a factor and . A least-squares fit of the model to the photometric data provided the values of , , , , and to be used as the initial trial parameters for the two-dimensional photometric decomposition.
4.1.2 Test with model galaxies
To test the reliability and accuracy of our two-dimensional technique for bulge-disc photometric decomposition we applied the decomposition program to a set of artificial disc galaxies. We generated 100 images of galaxies with an oblate bulge plus an exponential infinitely thin disc. The scale surface-brightness, scale length, and apparent axial ratios of bulge and disc of the artificial galaxies were randomly chosen in the range of values observed by Kent (1985) for a large sample of S0 and spiral galaxies. The adopted ranges are
| (4) |
| (5) |
| (6) |
for the bulge parameters, and
| (7) |
| (8) |
| (9) |
for the disc parameters. The parameters of the artificial galaxies have also to satisfy the following conditions
| (10) |
| (11) |
All the simulated galaxies were assumed to be at the Virgo Cluster distance ( Mpc, Freedman et al. 1994) corresponding to a scale of pc arcsec-1. The pixel scale used was pixel-1 and the CCD gain and readout noise were respectively 1.4 e- ADU-1 and 6.5 e- in order to simulate the VATT observations. We fixed the seeing FWHM at . We added a sky background level of counts pixel-1 which corresponds to a sky surface brightness of 21.8 mag arcsec-2 in the band adopting the absolute calibration derived from our real observations. This is a typical surface brightness value for a dark sky as reported by Binney & Merrifield (1998). An appropriate level of noise was added to the resulting image to yield a signal-to-noise ratio similar to that of the photometric data we obtained for NGC 772, NGC 3898 and NGC 7782 during the VATT observing runs.
The images of the artificial galaxies have been analyzed as if they were real. The two-dimensional parametric decomposition has been applied using as initial trial parameters the , , , , , and values obtained with a standard parametric decomposition of the major and minor-axis surface brightness profiles measured by fitting ellipses to the galaxy isophotes. The fitting algorithm was able to recover the input parameters within the estimated errors with a scatter consistent with the results of the similar double-blind tests performed by Schombert & Bothun (1987), Byun & Freeman (1995) and Wadadekar, Robbason & Kembhavi (1999).
| Object | Bulge | Disc | Dark halo | Bulge + Disc | ||||||||||
| [%] | [L⊙,V] | [M⊙] | [] | [%] | [L⊙,V] | [M⊙] | [] | [M⊙] | [M⊙] | [] | ||||
| NGC 772 | 52% | 6.6 | 48% | 3.3 | – | 5.0 | ||||||||
| NGC 3898 | 67% | 6.4 | 33% | 4.2 | 5.8 | |||||||||
| NGC 7782 | 11% | 8.3 | 89% | 4.2 | – | 4.6 | ||||||||
4.2 Dynamical models
In order to investigate the gas and stellar kinematics we use the self-consistent dynamical models by Pignatelli & Galletta (1999). We give here just a brief summary of the technique itself and of the general assumptions used.
The galaxy can be described by superposition of different components. For each component, we separately assume:
- -
-
the density distribution is oblate, without triaxial structures;
- -
-
the isodensity surfaces are similar concentric spheroids;
- -
-
the surface density profile follows a simple or an exponential law;
- -
-
the velocity distribution is locally Gaussian;
- -
-
the velocity dispersion is isotropic ();
- -
-
the mass-to-light ratio is constant with radius.
Our model does not consider the possible presence of triaxial structures (bar; triaxial bulge; tilted component; warp) or of anisotropy in the velocity distribution (with predominance of radial or tangential orbits).
With these assumptions, the model has free parameters, where is the number of adopted components: namely the luminosity , scale length ( or ), mass-to-light ratio and flattening of each component plus the inclination angle of the galaxy. In principle, photometry can be used (as explained in Sect. 4.1) to constrain all these parameters except the mass-to-light ratios and the inclination angle , which must be derived by kinematics.
For each given choice of the parameters above, we compute the gravitational potential of the total mass distribution and integrate the Jeans equations for the stellar component, obtaining a self-consistent model of the rotation velocity and velocity-dispersion profiles which include the asymmetric drift effects.
In order to compare the observed data with the prediction of the model, we also need to reproduce the deviations of the LOSVD profiles from a pure Gaussian shape. In fact, in the regions where the bulge and disc luminosities are comparable we expect that the superposition of the rapid rotation of the disc with the slower rotation of the other components will produce a clearly non-Gaussian, and sometimes even 2-peaked, LOSVD even assuming that each individual component has a Gaussian velocity distribution.
We parametrized these deviations in terms of the usual Gauss-Hermite series higher moments and , that we obtained by means of a first-order approximation from the momenta of the model velocity distribution (van der Marel & Franx 1993; Pignatelli & Galletta 1999).
Finally, we convolved the results of the model with the seeing and took into account the instrumental setup used in the different observations (slit width, pixel size). The final model profiles are compared with the observed stellar kinematic data and the best-fit model is found with the help of the standard reduced -analysis. Masses and mass-to-light ratios of different components are given in Table LABEL:tab:masses.
Once the fit of the stellar kinematics has been performed, and the overall potential of the galaxy is known, one can derive the circular velocity directly. By overlaying the obtained in this way (and corrected for inclination) on the observed gas rotation velocity, we can immediately notice any deviation from purely circular motion. The evaluation of the different convolution effects is crucial especially within the innermost regions, where the rise of the velocity curve is smoothed, and the value of the velocity dispersion is increased, by the seeing effects.
5 Results
5.1 NGC 772
5.1.1 Stellar and ionized-gas kinematics
The stellar kinematic data extend to more than ( kpc) on the receding side of NGC 772 and to about ( kpc) on its approaching side (Fig. 2). In the inner ( kpc), the rotation velocity of stars increases to . At larger radii, it rises more gently out to at the last measured point. At the centre the stellar velocity dispersion shows a maximum of about ; away from the nucleus it falls off to at . Outside it remains high, ranging between and .
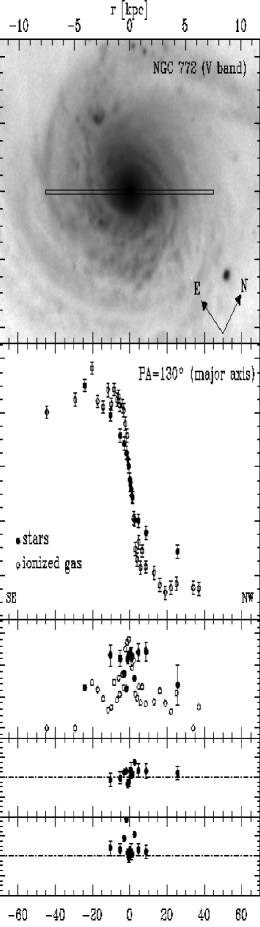
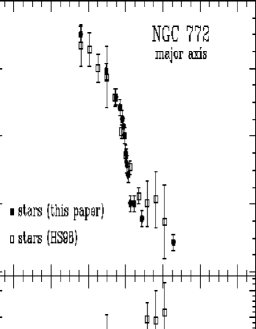
The stellar velocity curve and velocity-dispersion profile we measured along the major axis of NGC 772 are compared in Fig. 3 to those obtained by Heraudeau & Simien (1998). The two data sets cover almost the same radial region and have been collected along two close position angles ( and ). Our line-of-sight velocities agree within the errors with those measured by Heraudeau & Simien (1998). However their velocity dispersions are higher than those we found. This is only due to the different technique adopted in measuring the stellar kinematic parameters rather than to real kinematic features observed at the two different position angles.
The ionized-gas velocity is measured out to ( kpc) on the receding side and to less than ( kpc) on the approaching side (Fig. 2). The ionized-gas rotation velocity has a steeper gradient than the stellar velocity, reaching a value of at ( kpc), increasing to at ( kpc) and then flattening out. The gas velocity dispersion strongly peaks to about in the centre; it drops rapidly to values lower than for .
5.1.2 band surface photometry and bulge-disc decomposition
The band ellipse-averaged radial profiles of surface brightness, ellipticity, position angle and Fourier coefficient of NGC 772 have been measured out to ( kpc) from the centre (Fig. 4).

In the inner ( kpc) the values of ellipticity and position angle show a series of bumps and wiggles, oscillating between and and between and , respectively. These features are due to the inner spiral arms of the galaxy. The bump in the surface-brightness profile at , and the corresponding abrupt variations in the position angle and fourth-order cosine Fourier coefficient can be ascribed to the prominent northern arm (see Fig. 5). At larger radii, the galaxy light is dominated by the contribution of the disc component characterized by an exponential surface-brightness profile and almost constant ellipticity () and position angle ().
In Fig. 4 our data are compared to those obtained by Heraudeau & Simien (1996) in the same band. The photometric profiles of Heraudeau & Simien (1996) extend out to from the centre and their surface brightness is mag arcsec-2 fainter than our. In the inner their position angle and ellipticity data have smoother radial trends than those we measured. We noticed that the position-angle values included by Heraudeau & Simien (1996) in Table 5 of their paper differ from those they plotted in their Fig. 10. In our comparison we adopted the plotted ones. The disagreement between the two sets of data can be explained if the tabulated values result from an isophotal ellipse fitting performed on an image of NGC 772 with an incorrect orientation.
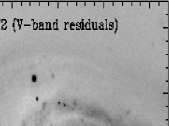
In Fig. 5 we show the result of the bulge-disc photometric decomposition of the surface-brightness distribution of NGC 772, which has been performed with the parametric two-dimensional technique discussed in Sec. 4.1. The spiral arms extending into the very centre of NGC 772 are clearly visible in the residual image obtained by subtracting the model surface brightness of the galaxy from the observed surface brightness. These structures resemble those detected by Carollo et al. (1997, 1998) in several Sa – Sbc galaxies, in which the spiral pattern is visible down to the innermost radius accessible to the HST WFPC2 imaging.
By fitting an exponential profile to the ellipse-averaged surface-brightness profile of NGC 772 measured in the band, Lu (1998) derived the following disc parameters mag arcsec-2, and . Our exponential disc results larger () and slightly more inclined () than that obtained by Lu (1998). This is due to the different decomposition technique we adopted more than to the different bandpass in which we observed. In fact Lu (1998) fitted his exponential disc directly to the observed surface-brightness profile in the radial range between and (which he judged by eye to be disc-dominated) without taking into account any contribution from the conspicuous bulge component.
5.1.3 Ionized-gas distribution
In NGC 772 most of the H II regions visible in our H[N II] image (Fig. 6) lie along the two arms, extending to the northern side of the galaxy, and along the short and double-ended arm opposite to them.
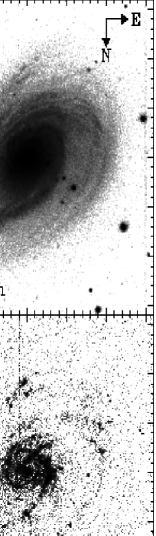
The ionized-gas emission is concentrated in the region of the galaxy () bounded by the pseudo-ring formed by the two tightly-wound northern spiral arms. In the H[N II] emission map it is possible to disentangle an outer region extending between and and characterized by smooth and diffuse emission, from the inner region () characterized by more concentrated emission and contributing about of the total flux.
The ionized gas between and shows the kinematic behaviour typical of a disc () as inferred from its high rotation velocity and low velocity dispersion (Fig. 2).
In the inner region the kinematic behaviour of the gas is different. The observed gas velocity dispersion (ranging between and ) is comparable to that of the stellar component and therefore is far higher than that expected from thermal motion or small-scale turbulence ( ) typically observed in a gaseous disc. This may well be an indication that in this region the gas is being dynamically supported by pressure (i.e. random motions) rather than rotation, as it occurs in the outer part of the galaxy. There is, however, a wide region () in which the gas velocity dispersion is still only marginally greater than 50 , and appears to be lower than its stellar counterpart (see panel (b) in Fig. 7). The high velocity dispersions observed near the nucleus could then only be an observational effect due to seeing. In order to discriminate between the two cases, the application of a dynamical model is required.

5.1.4 Dynamical modelling
In Fig. 7 we show for NGC 772 the comparison between the photometric and kinematic data and the best-fit photometric dynamical models we obtained with the techniques discussed in Sec. 4. The mass-to-light ratios, flattening and masses of bulge and disc stellar components of NGC 772 derived with the dynamical modelling described in Sec. 4.2 are given in Table LABEL:tab:masses.
The agreement between the stellar kinematic data and the predictions of the dynamical model are fairly good at all radii, apart from the features observed in the LOSVD at . At this radius we notice a sharp decrease (from 115 to 80 ) in the observed velocity dispersion and very strong asymmetries in the line shape, while the rotation velocity does not show any significant variation. The model is unable to reproduce these abrupt but radially confined changes in the velocity-dispersion, and profiles. Either absorbing dust or nuclear peculiar motions could be responsible for this feature.
It is worth noting that the model reproduces the observed gaseous and stellar rotation velocity without the need of introducing a dark halo. According to the photometric decomposition, our kinematic data are limited to the bulge-dominated region of NGC 772 where the luminous mass is expected to dominate the galaxy dynamics. In agreement with these results, the dynamical model shows that asymmetric drift has a sizable effect on the stellar component in the whole observed region as it can be desumed by considering that we derived a difference of 35 between stellar rotation velocity and circular speed at the farthest measured point.
Once the convolution with seeing and instrumental setup has been taken into account, the gas appears to rotate in almost circular orbits. We conclude that the gas rotation curve of this galaxy can not be classified as a slowly-rising one, and that the observed central rise in the gas velocity dispersion is due to seeing effects.
5.2 NGC 3898
5.2.1 Stellar and ionized-gas kinematics
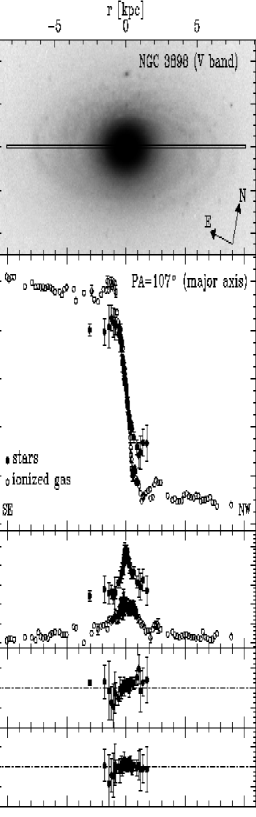
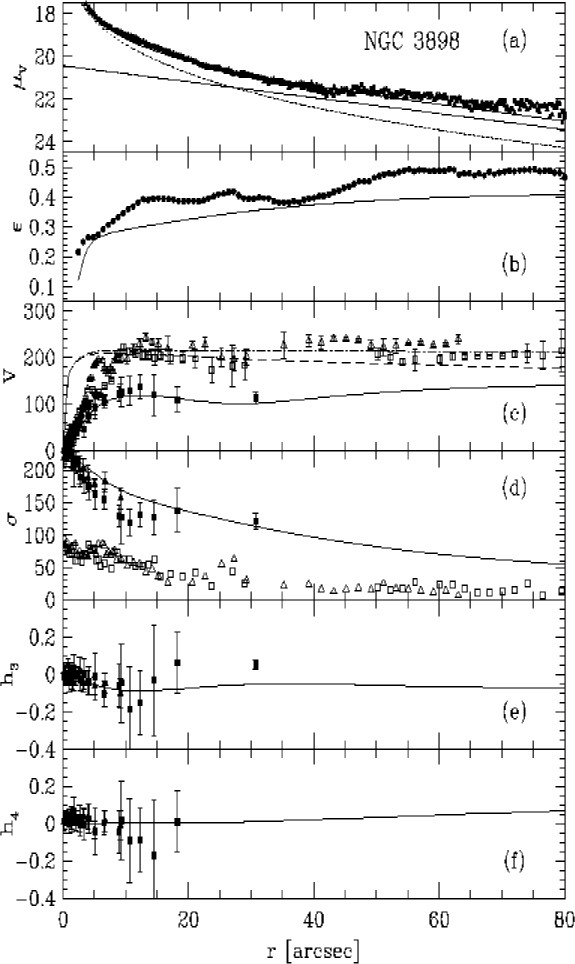
The stellar kinematic parameters are observed out to ( kpc) and ( kpc) on the approaching and receding side of NGC 3898, respectively (Fig. 8). The stellar rotation velocity increases linearly up to in the inner ( kpc), then it decreases to at the last observed radius. At the centre, the stellar velocity dispersion is about 220 , then increases up to a maximum value of at (Fig. 9), suggesting the presence of an unresolved kinematically decoupled core component (see Friedli 1996 for a discussion about this feature in the velcity-dispersion profile). Off the nucleus, the stellar velocity dispersion decreases to on the approaching side and on the receding side.
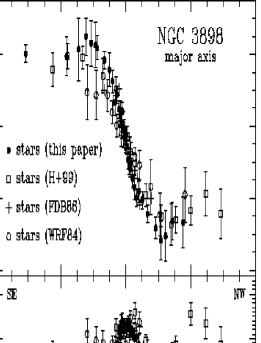
The stellar velocity curve and velocity-dispersion profile measured along the major axis of NGC 3898 are compared in Fig. 9 to those obtained by Whitmore et al. (1984), Fillmore et al. (1986) and by Heraudeau et al. (1999). Although the velocity data agree within the errors, a difference in the central velocity gradients measured by the various groups is present. In particular, there is a velocity discrepancy (ranging between and ) between our outer rotation velocities and those by Whitmore et al. (1984), who also measured a higher velocity dispersion on the receding side.
The ionized-gas kinematic parameters extend to ( kpc) on each side of the nucleus (Fig. 8). The gas rotation velocity has a steeper gradient than the stellar velocity, reaching at and remaining almost constant at this value further out. The gas velocity dispersion is about for decreasing at larger radii () to on both sides of the nucleus.
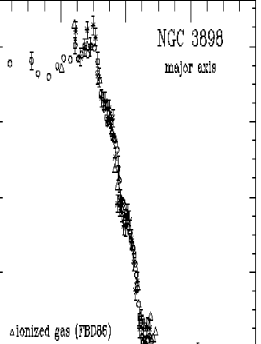
The ionized-gas rotation curves we measured along the major axis of NGC 3898 from the spectra obtained with INT and MMT are compared in Fig. 10 to the H rotation velocities obtained by Rubin et al. (1985) and Fillmore et al. (1986). There is a good agreement between the line-of-sight velocities obtained in the different runs. In particular, all the rotation curves closely match each other, showing the same wiggles and bumps in the velocity for . However, between and on both sides of the nucleus Rubin et al. (1985) measured a slower rotation than either we or Fillmore et al. (1986) derived. As far as the gas velocity dispersion is concerned, only our own data are available. They are based on the line width of the [O III] and H emission lines present in the MMT and INT spectra. The two data set are consistent within the scatter of the points derived from the [O III] line.
5.2.2 band surface photometry and bulge-disc decomposition
The band radial profiles of surface brightness, ellipticity, position angle and Fourier coefficient measured by fitting ellipses to the NGC 3898 isophotes extend out to ( kpc) from the centre (Fig. 11).

The ellipticity rises from to in the inner ( kpc) remaining almost constant out to ( kpc). Between and ( kpc) it increases to a maximum of at ( kpc) and decreases to the initial value of 0.39. Further out it remains almost constant at out to the farthest observed radius. The isophotal position angle is constant at at all radii. The isophotes are slightly disky between and ( kpc) and elliptical elsewhere. The surface-brightness profile is extremely regular with a few small bumps due to the spiral arms.
In Fig. 11 our surface-brightness radial profile is compared to those obtained by Watanabe (1983), and Heraudeau & Simien (1996), who also measured for NGC 3898 the ellipticity and position angle radial profiles. The agreement between our data and those of Heraudeau & Simien (1996) is good. The surface brightness measured by Watanabe (1983) in the radial region between and is mag arcsec-2 fainter than ours. The surface-brightness profile of Kodaira et al. (1990) is not shown in Fig. 11. In their Photometric Atlas of Northern Bright Galaxies only the profiles extracted along the major and minor axes of NGC 3898 are available and there is not an ellipse-averaged profile. This is also true for NGC 7782.
The result of the two-dimensional bulge-disc parametric decomposition of the surface-brightness distribution of NGC 3898 is shown in Fig. 12. The spiral pattern shows up in the panel of the residuals, as well as a central structure due to the difference in this region between the observed ellipticity (increasing from to ) and the constant value () derived for the bulge component.
The surface-brightness profiles of Watanabe (1983) and Kodaira et al. (1990) were fitted with a bulge and an exponential disc by van Driel & van Woerden (1994) and Baggett et al. (1998), respectively. Van Driel & van Woerden (1994) using Burstein’s (1979) method obtained the following photometric parameters mag arcsec-2, , mag arcsec-2, and . The best-fit parameters derived by Baggett et al. (1998), performing an intensity-weighted fit between and to avoid the portion of the profile most affected by seeing, are mag arcsec-2, , mag arcsec-2, and . The results of van Driel & van Woerden (1994) and Baggett et al. (1998) are consistent if we take into account that they used an ellipse-averaged profile and the profile extracted along the galaxy major axis, respectively. The bulge and disc scale parameters we obtained for NGC 3898 are quite different since we have taken properly into account the apparent axial ratios of the two components.
5.2.3 Ionized-gas distribution
Ho, Filippenko & Sargent (1997) classified the nucleus of NGC 3898 as intermediate between an H II nucleus and a LINER. This bright nucleus is also visible in our H[N II] emission image of NGC 3898 (Fig. 13), mapping the ionized-gas distribution of the galaxy. The ionized-gas emission is smooth and featureless in the bulge-dominated region (), where about of the warm gas resides. It shows a clumpy and fragmented distribution in the disc-dominated region where numerous H II regions trace the NGC 3898 multiple-arm structure. The transition between the two regions occurs abruptly at from the centre where the gas emission in the major-axis spectrum (Fig. 8) cuts off. The distribution of the H II regions (which closely follows the continuum isophotes) indicates that the gas and stellar discs are coplanar.
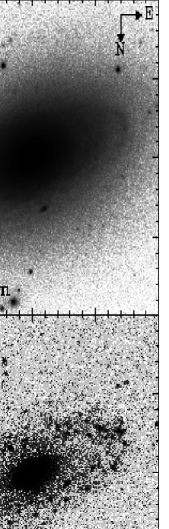
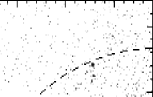
On the SW side of the galaxy two series of emission knots are aligned at a projected angular distance of and from the centre, respectively (Fig. 14). These H II regions trace the two external faint arms located far beyond the galaxy main body as discussed in the Carnegie Atlas of Galaxies (Sandage & Bedke, 1994, Panel 79).
5.2.4 Dynamical modelling
In Fig. 15 we show the comparison between the photometric and kinematic data and the best-fit dynamical model obtained with the technique discussed in Sec. 4.2. The mass-to-light ratios of the bulge and disc stellar component are shown in Table LABEL:tab:masses.
A number of kinematic features highlight the presence of a hot spheroidal component. At both and show the presence of a non Gaussian LOSVD which can be interpreted as due to the superposition of a radiply rotating disk and an almost non-rotating bulge. The stellar rotation velocity is everywhere less than 2/3 of the gas velocity, as a result of the asymmetric drift effect. Finally, for the stellar velocity dispersion shows a plateau at a value of 110 , which is the signature of a thick, dynamically hot component.
The gas rotation velocity is well approximated by the circular velocity of our models for . Out to from the centre the gas rotation curve does not show hints of an asymmetric drift effect and is almost flat at the constant value of about . Kent (1988) and Moriondo et al. (1998b) already pointed out that for the gas rotates more slowly than expected on the basis of the stellar kinematics and of the photometry. The comparison of the observed gas kinematics with our self-consistent dynamical model confirms this result. Moreover, we can also conclude that seeing convolution and finite slit width can not account for this effect, since these parameters were already included in the computation of our modeled velocity curves. We stress that, for this particular object, the gas rotation curve can not be interpreted as a sign of ‘pressure-supported’ gas in the central regions of the galaxy. First, the observed gas velocity dispersion is too low to account for the large differences between the circular velocity computed from the model and the observed gas rotation velocity. Moreover, the gas kinematics show strong asymmetries in the region where the ‘slowly rising’ effect takes place, with a difference of more than 80 in the rotation velocities of the leading and receding sides. Such asymmetries are not seen in the gas velocity-dispersion profile. It is likely that other effects are at work here; however, the available data do not allow us to distinguish between non-axisymmetric distortion of a gaseous disc and possible non-equilibrium motions of the gas.
For this galaxy only we were not able to reproduce the gas rotation velocities at large radii without adding a dark matter halo. For sake of simplicity, we adopted the ‘maximum bulge+disc’ paradigm, in order to minimize the amount of dark matter needed to fit the data. A more precise measurement of the mass and distribution of the dark matter would require a best-fitting procedure of the observed kinematic curves varying simultaneously all the parameters involved, but can not be applied to this object because of the limited extension of the gas rotation curve (; see Persic, Salucci & Stel 1996 for a discussion on the subject). We assumed a pseudo-isothermal profile for the dark halo with a circular velocity, given by:
| (12) |
Due to the limitations of the available data, we were unable to determine both the total mass and scale radius of the halo. Nevertheless, the total mass within at the at the outermost observed radius was quite well constrained and turned out to be M⊙, with an error of less than . We also found that the scale length of the dark halo is so large (), that in the observed radial range the circular velocity contributed by the halo rises almost linearly with radius.
Total mass estimates and mass decompositions for this galaxy are already present in literature (Fillmore et al. 1986; Kent 1998; Moriondo et al. 1998b). Remarkably, despite the various different hypotheses adopted, our result for the total luminous mass agrees within with all these authors: when scaled to our adopted distance of Mpc, Kent (1988) gives M⊙, Fillmore et al. (1986) M⊙, and the most recent estimate, given by Moriondo et al. (1998b) is M⊙, almost identical to our value of M⊙. On the contrary, the mass decomposition of the different authors differs from each other by large factors, being strongly dependent on the hypothesis adopted. Kent (1988) and Moriondo et al. (1998b) derive bulge masses, which are respectively 15 and 3 times lower than the value we obtained. This is due to their assumption that the gas rotation velocities were tracing the potential everywhere. As a consequence unphysical values for the mass-to-light ratios of both components are found, as the authors correctly remarked. This underestimate of the bulge contribution to the total mass content leads also to an overestimate the disc mass (by a factor of 4, if compared with our results), and the mass of the dark halo (in the case of Moriondo et al. 1998b).
Fillmore et al. (1986) derived the mass-to-light ratios from the stellar kinematics rather than from the gas; however, their photometric decomposition is one-dimensional and leads to a smaller and more compact bulge in combination with a larger disc than the ones we derived. Therefore their results are not easily comparable with ours. On the other hand, our two-dimensional photometric decomposition give a bulge-to-disc ratio in good agreement with both Kent (1988) and Moriondo et al. (1998b), who did not use for their decomposition the ellipse-averaged surface-brightness profiles as done by Fillmore et al. (1986).
5.3 NGC 7782
5.3.1 Stellar and ionized-gas kinematics
The stellar velocity curve is observed out to ( kpc) on both sides of NGC 7782 (Fig. 16). The stellar rotation velocity increases linearly up to in the inner ( kpc). It does not change for ( kpc), and further out it shows a shallower gradient rising to at ( kpc). Outwards the stellar rotation velocity remains constant or possibly even rises. At the centre the stellar velocity dispersion peaks to about , then off the nucleus it decreases gradually to less than at the last outermost radii.
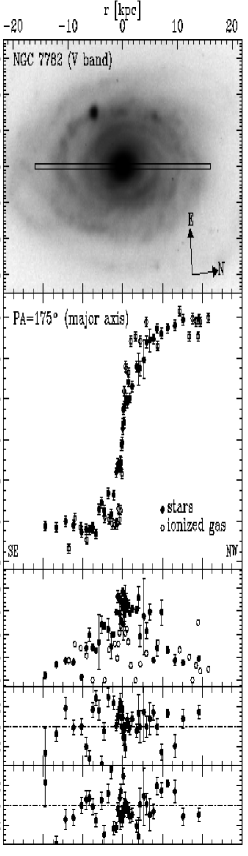
The ionized-gas velocity curve extends to less than ( kpc) on the approaching side and to less than ( kpc) on the receding side of the galaxy (Fig. 16). The gas rotation velocity has a steeper gradient than the stellar curve, rising to at ; then it remains almost constant, becoming similar to the stellar velocity for . The gas velocity dispersion is centrally peaked at about , dropping to values lower than for radii larger than on both sides of the galaxy. Further out it oscillates around values of about . The gas velocity dispersion is not greater than the stellar dispersion over the whole observed radial range.
5.3.2 band surface photometry and bulge-disc decomposition
The band radial profiles of surface brightness, ellipticity, position angle and Fourier coefficient of NGC 7782 are measured out to ( kpc) from the centre (Fig. 17).

The ellipticity increases from to in the first ( kpc), dropping to further out. It then increases again to and flattens around this value for . The position angle is constant at at almost all radii, except for two abrupt changes at and by less than . Isophotes are boxy-shaped around and between and , and almost elliptical elsewhere. The surface-brightness profile is characterized by a plateau at mag arcsec-2 between and . All these features can be explained as due to the spiral pattern (see Fig. 18).
The band surface-brightness radial profile of Koidaira et al. (1990) has been extracted along the galaxy major axis but it is not directly comparable with the ellipse-averaged one we have derived and shown in Fig. 17.
The two-dimensional bulge-disc parametric decomposition of NGC 7782 was performed adopting an exponential bulge since this yielded lower residuals. The map of the residuals obtained as a difference between the observed and the model surface brightness is plotted in Fig. 18. This figure shows the asymmetric pattern of the inner stellar spiral arms.
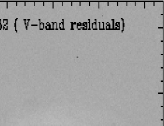
5.3.3 Ionized-gas distribution
The ionized-gas distribution of NGC 7782 is shown in Fig. 19. The map of the H[N II] emission is characterized by the presence of a small and bright nuclear region aligned with the galaxy major axis, and two tightly wound spiral arms which can be followed for forming a sort of double ring-like structure. The gaseous arms are more symmetric than the stellar arms and do not extend to the inner region of the galaxy, starting outside the constant surface-brightness region at from the centre.
As in the case of NGC 772, the bright H[N II] nucleus of NGC 7782 is characterized by a high ionized-gas velocity dispersion ( for ) as shown in Fig. 16, suggesting the possible presence of pressure-supported gas in the bulge region. In spite of its apparent clumpy distribution (Fig. 19) a diffuse component of ionized gas is also present in the disc of NGC 7782, as indicated by the fact that we are able to measure continuously the ionized-gas velocity parameter without gaps along the complete major axis out to and on the two sides of the nucleus (Fig. 16) respectively. The distribution of the H II regions, following the continuum isophotes, indicates that the gas and stellar discs are coplanar.
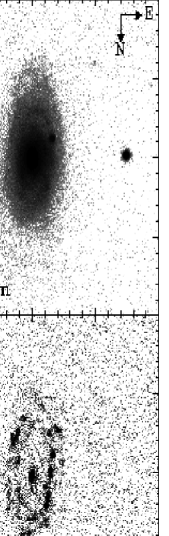
5.3.4 Dynamical modelling
The comparison between the photometric and kinematic data and the best-fit photometric dynamical models we obtained for NGC 7782 is shown in Fig. 20. The mass-to-light ratios, the flattening and the masses of the bulge and disc stellar components derived using the dynamical modelling technique described in Sec. 4.2 are given in Table LABEL:tab:masses.
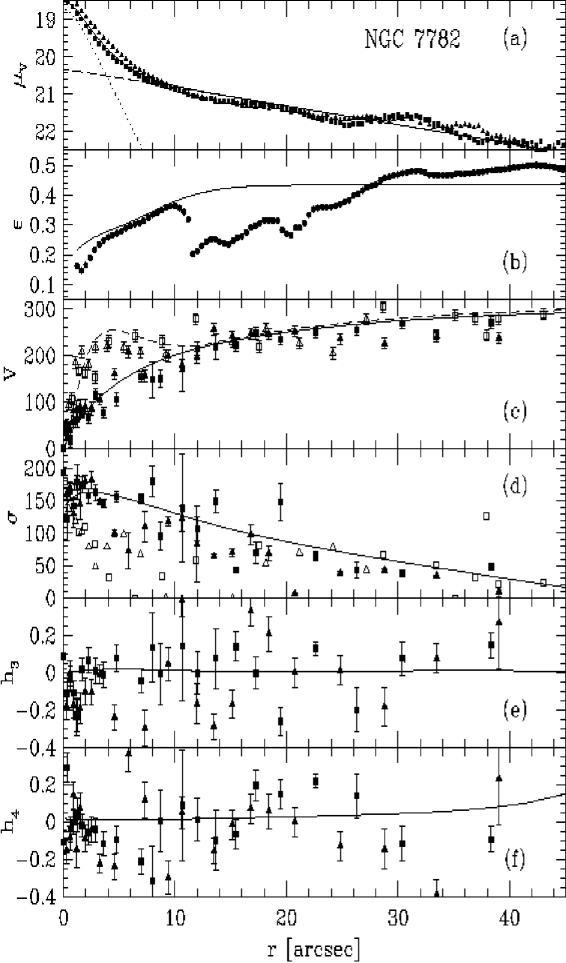
From both the kinematic and the photometric data shown in Fig. 20 we can clearly distinguish the bulge and disc-dominated regions.
An exponential and almost spherical bulge is the main photometric and dynamical component within from the centre. In this region the stellar velocity dispersion shows a plateau at 180 and in agreement with the asymmetric drift effect calculated by the model the stellar rotation velocity is below the value of the circular velocity. In the transition region bewteen the gas rotation curve shows small deviations ( ) from pure circular rotation. Any evidence for possible non-circular motions is marginal and the increase of the gas velocity dispersion towards the nucleus can be better explained as due to a seeing effect.
For the surface brightness and ellipticity profiles of NGC 7782 are dominated by the light contribution of the disc component. Therefore in the outer region asymmetric drift effect is negligible and both gas and stars appear to rotate close to the circular velocity. No dark matter halo is required to reproduced the observed velocity curve out to the last observed radius.
Since the and values are poorly constrained by observations, it is not possible to draw any conclusion about anisotropies in the stellar velocity dispersion.
6 Discussion and conclusions
Non-circular velocities of the ionized gas in the bulge-dominated region of early-to-intermediate type disc galaxies have been detected by different authors (Fillmore et al. 1986; Kent 1988; Kormendy & Westpfahl 1989). The discovery that in a large fraction of S0’s the gas velocity dispersion remains as high as the stellar velocity dispersion over an extended radial range (Bertola et al. 1995) corroborated the early suggestions that at small radii gas could be dynamically hot rather than settled in a cold disc. In this framework, the dynamical modelling by Cinzano et al. (1999) showed that in the S0 galaxy NGC 4036 the difference between the circular velocity curve inferred from stellar kinematics and the rotation curve of the gas is substantially accounted for its high velocity dispersion.
It is usually customary, in measuring mass distribution, to assume that the ionized gas is moving in circular orbits. It is therefore crucial to understand if and when the warm gas in galaxies has a rotation curve which rises more slowly than the gravitational equilibrium circular velocity. Ignoring this effect can lead to a significant underestimate of the masses of the bulge, disc and dark halo (e.g. Kent 1988 for a discussion). Up to now such a direct comparison between the circular velocity inferred from dynamical modelling based on stellar kinematics and surface photometry, and the observed gas rotation velocity has been done for only a small set of lenticulars and early-to-intermediate spirals (see Table LABEL:tab:slowlyrising). The three new cases discussed in this paper represent therefore a useful step in understanding how common the phenomenon of slowly-rising rotation curves is in bulge-dominated galaxies.
For NGC 772, NGC 3898 and NGC 7782 we present a self-consistent Jeans model for the stellar kinematics, adopting the light distribution of bulge and disc derived by means of a two-dimensional parametric photometric decomposition of the observed band surface brightness. This allows us not only to investigate the presence of non-circular gas motions, but also to derive the mass distribution of luminous and dark matter in these objects.
| Object | Morphological Type | Ref. | |||||||||
| [RSA] | [RC3] | [Mpc] | [mag] | [kpc] | [kpc] | [kpc] | [kpc] | ||||
| (1) | (2) | (3) | (4) | (5) | (6) | (7) | (8) | (9) | (10) | (11) | (12) |
| NGC 772 | Sb(rs)I | .SAS3.. | 34.7 | -21.61 | 2.11 | 11.0 | 6.2 | no | - | 0.5 | 1, |
| NGC 2179 | Sa | .SAS0.. | 33.7 | -19.81 | 2.80 | 2.0 | 5.7 | no | - | 0.2 | 2, |
| NGC 2775 | Sa(r) | .SAR2.. | 13.9 | -19.91 | 1.39 | 3.6 | 4.4 | yes | 2.0 | - | 2, |
| NGC 3898 | SaI | .SAS2.. | 17.1 | -19.84 | 3.55 | 1.6 | 2.3 | yes | 0.7 | - | 1, |
| NGC 4036 | S03(8)/Sa | .L.... | 20.1 | -20.03 | 2.04 | 1.2 | 0.7 | yes | 1.0 | 0.4 | 3, |
| NGC 4450 | Sab pec | .SAS2. | 17.0 | -20.40 | 2.69 | 1.7 | 1.4 | yes | ? | 4, | |
| NGC 4569 | Sab(s)I-II | .SXT2.. | 17.0 | -21.36 | 0.08 | 0.3 | 0.4 | yes | 2.6 | ? | 4, |
| NGC 5055 | Sbc(s)II-III | .SAT4.. | 7.5 | -20.35 | 0.12 | 0.4 | 0.3 | yes | 0.5 | ? | 4, |
| NGC 7782 | Sb(s)I-II | .SAS3.. | 74.8 | -21.95 | 0.24 | 1.1 | 1.5 | no | - | 0.4 | 1, |
NOTE – col. 2: morphological type from RSA; col. 3: morphological type from RC3; col. 4: distance derived as with the velocity relative to the centroid of the Local Group obtained from the heliocentric systemic velocity as in RSA and Mpc-1. The heliocentric velocity of NGC 5055 has been taken from RC3. For NGC 4450 and NGC 4569 which belong to the Virgo Cluster the distance has been taken following Freedman et al. (1994); col. 5: absolute corrected magnitude from in RC3; col. 6: bulge-to-disc mass ratio; col. 7: effective radius of the bulge. For NGC 7782 the bulge has an exponential surface-brightness profile; col. 8: radius at which ; col. 9: yes = the ionized-gas component shows a slowly-rising rotation curve (i.e. at small radii), no = the gas rotation traces circular speed at all radii ( at all radii); col. 10: radial range in which ; col. 11: radial range in which , ? = the radial profile of the ionized-gas velocity dispersion is not available; col. 12: references and bands of the data [1 = this paper, 2 = Corsini et al. (1999), 3 = Cinzano et al. (1999), 4 = Fillmore et al. (1986)].
In NGC 772 the observed velocity dispersion of the ionized gas is comparable to the stellar velocity dispersion and is far higher than expected from the thermal motions or small-scale turbulence, typically observed in a gaseous disc. However, dynamical modelling showed that the rotation of the ionized-gas traces the circular velocity and the central rise observed in its velocity dispersion is due to seeing effects, which serves as a warning against over interpretation.
On the contrary, the gas rotation curve of NGC 3898 can be classified as ‘slowly-rising’, since for the inner ionized gas is rotating more slowly than the circular velocity predicted by dynamical modelling. NGC 3898 is the only galaxy of our sample for which previous determinations of the masses of the bulge and disc components are available in the literature (Kent 1988; Fillmore et al. 1986; Moriondo et al. 1998b). Comparison shows that NGC 3898 is a clearcut example that mass decomposition based only on emission-line rotation curves can be unreliable, at least for bulge-dominated galaxies. This error was made and discussed by Kent (1988) and Moriondo et al. (1998b), who assumed the gas to be rotating at circular velocity at all radii and found extraordinarily low values for the mass-to-light ratio of the spheroidal component, as if NGC 3898 was an almost ‘bulge-less’ galaxy in spite of its overall morphology (see Table 1 and Figs. 8, and 13) and bulge-to-disc luminosity ratio (). The asymmetry of the gas rotation curve of NGC 3898 (with a maximum between the two sides of about 80 at from the centre), and the strong difference between the gas ( ) and the stellar velocity dispersion ( with a central peak to ) in the innermost (where we observe almost the same velocity gradient for both gas and stars) are an indication that along with random motions other phenomena could also be contributing to the slowly rise of the gas velocity. This is the case of other galaxies with slowly-rising rotation curves, such as the Sa NGC 2775 (Corsini et al. 1999) and the S0 NGC 4036 (Cinzano et al. 1999). The asymmetry of the inner parts of the gas rotation curve of NGC 2775 has been explained as due to a gaseous component which is not rotating in the galaxy plane, and the possible presence of drag forces between the ionized gas and the hot component of the interstellar medium of NGC 4036 has been suggested (for a discussion of the phenomenon see Cinzano et al. 1999).
Finally, in NGC 7782 the gas rotation curve shows small deviations from pure circular rotation only in the transition region between bulge and disc. Any evidence for possible non-circular motions is marginal and the sharp increase of the gas velocity dispersion towards the nucleus can be better explained as due to a seeing effect as in the case of NGC 772.
As far as the presence of dark matter is concerned, we infer that the mass is essentially traced by light in NGC 772 and NGC 7782, where gas rotation velocities were observed out to and , respectively. For NGC 3898 the combined stellar and gaseous rotation data (which extend out to and respectively) require the presence of a massive dark halo. This result is based on the idea that gas kinematics at large radii is representative of a dynamically cold disc supported by rotation, as suggested by the high gas rotation velocity and low velocity dispersion () for (corresponding to about ). This result also qualitatively agrees with the general dark matter scenario, with the less massive galaxies being the more dark-matter dominated (Salucci & Persic 1999), although these data do not permit a careful measurement of the dark halo properties.
Kent (1988) found that, out of the 14 Sa galaxies he modeled, six show gas rotation curves that rise too slowly for a constant mass-to-light ratio implying they are respectively too low for the bulges and too high for the disc components. According to Table LABEL:tab:slowlyrising, the gas motion is not circular in the inner regions of 6 of the 9 early-to-intermediate disc galaxies, for which dynamical modelling allows the direct comparison between the gaseous and circular speeds (among these only NGC 3898 belongs also to Kent’s sample).
Without pretending to draw any statistical conclusion based on so small number of objects, it nevertheless seems probable that non-circular gas velocities could be a common feature in the central kiloparsec of disc galaxies ranging from S0’s to Sb’s. However, according to the available data, it is not possible to derive a straightforward correlation with the galaxy morphological type, total luminosity, bulge-to-disc mass ratio or bulge size. It seems that even if the gas may be supported by non-circular random motions, this type of dynamical-pressure support may not be the only effect for the ‘slowly-rising’ gas rotation curves. In fact, the central gas velocity dispersion is too low to account for the difference between gas and circular speeds in two of the three galaxies (namely NGC 2775, and NGC 3898) shown in Table LABEL:tab:slowlyrising for which the gas velocity falls short of the circular speed and the velocity-dispersion profile of the gaseous component is available. Dynamical modelling based both on stellar and gaseous kinematics of a larger number of bulge-dominated galaxies is needed to understand the links between slowly-rotating gas and bulge properties, as a first step to put constraints on its physical nature (e.g. Mathews 1990) and origin (e.g. Bertola et al. 1995).
Acknowledgements.
We are grateful to Prof. P.A. Strittmatter, Director of the Steward Observatory and to Dr. G.V. Coyne, S.J., Director of the Vatican Observatory for the allocation of time for our observations. WWZ acknowledges the support of the grant 7914 of the Jubiläumsfonds der Oesterreichischen Nationalbank. This work was partially supported by grant PB97-0214 of the Spanish DGES.
References
- [Baggett, Baggett & Anderson (1998)] Baggett W.E., Baggett S.M., Anderson K.S.J., 1998, AJ, 116, 1626
- [Barbon, Benacchio & Capaccioli (1978)] Barbon R., Benacchio L., Capaccioli M., 1978, A&A, 65, 165
- [Bender (1990)] Bender R., 1990, A&A, 229, 441
- [Bender, Saglia & Gerhard (1994)] Bender R., Saglia R.P., Gerhard O.E., 1994, MNRAS, 269, 785
- [Bertola & Corsini (1999)] Bertola F., Corsini E.M., 1999, in J.E. Barnes, D.B. Sanders (eds.), Galaxy Interactions at Low and High Redshift, IAU Symp. 186, Kluwer Academic Press, Dordrecth, 149
- [Bertola, et al. (1995)] Bertola F., Cinzano P., Corsini E.M., Rix H.-W., Zeilinger W.W., 1995, ApJ, 448, L13
- [Bettoni & Galletta (1997)] Bettoni D., Galletta G., 1997, A&AS, 124, 61
- [Bevington Robinson (1992)] Bevington P.R. Robinson D K., 1992, Data Reduction and Error Analysis for the Physical Sciences. McGraw-Hill, New York
- [Binney & Merrifield (1998)] Binney J., Merrifield M., 1998, Galactic Astronomy. Princeton University Press, Princeton
- [Boroson (1981)] Boroson T. 1981, ApJS, 46, 177
- [Byun & Freeman (1995)] Byun Y.I., Freeman K.C., 1995, ApJ, 448, 563
- [Burstein (1979)] Burstein D., 1979, ApJ, 234, 435
- [Carollo, Stiavelli & Mack (1998)] Carollo C.M., Stiavelli M., Mack J., 1998, AJ, 116, 68
- [Carollo et al. (1997)] Carollo C.M., Stiavelli M., de Zeeuw P.T., Mack J., 1997, AJ, 114, 2366
- [Cinzano, et al. (1999)] Cinzano P., Rix H.-W., Sarzi M., Corsini E.M., Zeilinger W.W., Bertola F., 1999, MNRAS, 307, 433
- [Corsini et al. (1999)] Corsini E.M., Pizzella A., Sarzi M., Cinzano P., Vega Beltrán J.C., Funes J.G., Bertola F., Persic M., Salucci P., 1999, A&A, 342, 671
- [Courteau (1996)] Courteau S., 1996, ApJS, 103, 363
- [de Vaucouleurs (1948)] de Vaucouleurs G. 1948, Annales d’Astrophysique, 11, 247
- [de Vaucouleurs et al. (1991)] de Vaucouleurs G., de Vaucouleurs A., Corwin H.G.Jr., Buta R.J., Paturel G., Fouquè P., 1991, Third Reference Catalogue of Bright Galaxies. Springer-Verlag, New York (RC3)
- [Fillmore, Boroson & Dressler (1986)] Fillmore J.A., Boroson T.A., Dressler A., 1986, ApJ, 302, 208
- [Fisher (1997)] Fisher D., 1997, AJ, 113, 950
- [Freedman et al. (1994)] Freedman W.L., Madore B.F., Mould J.R., Ferrarese L., Hill R., Kennicutt R.C.Jr., Saha A., Stetson P.B., Graham J.A., Ford H., Hoessel J.G., Huchra J., Hughes S.M., Illingworth G.D, 1994, Nature, 371, 757
- [Freeman (1970)] Freeman K.C., 1970, ApJ, 160, 811
- [Friedli (1996)] Friedli, D., 1996, A&A, 312, 761
- [Giovanardi & Hunt (1996)] Giovanardi C., Hunt L.K., 1996, AJ, 111, 1086
- [Guthrie (1992)] Guthrie B.N.G., 1992, A&AS, 93, 255
- [Heraudeau & Simien (1996)] Heraudeau P., Simien F., 1996, A&AS, 118, 111
- [Heraudeau & Simien (1998)] Heraudeau P., Simien F., 1998, A&AS, 133, 317
- [Heraudeau et al. (1999)] Heraudeau P., Simien F., Maubon G., Prugniel P., 1999, A&AS, 136, 509
- [Ho, Filippenko & Sargent (1997)] Ho L.C., Filippenko A.V., Sargent W.L.W., 1997, ApJS, 112, 315
- [Jedrzejewky (1987)] Jedrzejewky R.I., 1987, MNRAS, 226, 747
- [Kent (1985)] Kent S.M., 1985, ApJS, 59, 115
- [Kent (1988)] Kent S.M., 1988, AJ, 96, 514
- [Kodaira, Okamura & Ichikawa (1990)] Kodaira K., Okamura S., Ichikawa S.-I., 1990, Photometric Atlas of Northern Bright Galaxies. University of Tokyo Press, Tokyo
- [Kormendy & Westpfahl (1989)] Kormendy J., Westpfahl D.J., 1989, ApJ, 338, 752
- [Krumm & Salpeter (1980)] Krumm N., Salpeter E.E., 1980, AJ, 85, 1312
- [Lu (1998)] Lu N Y., 1998, ApJ, 506, 673
- [Mathews (1990)] Mathews W.G., 1990, ApJ, 354, 468
- [Moriondo, Giovanardi & Hunt (1998)] Moriondo G., Giovanardi C., Hunt L.K., 1998a, A&AS, 130, 81
- [Moriondo, Giovanardi & Hunt (1998)] Moriondo G., Giovanardi C., Hunt L.K., 1998b, A&A, 339, 409
- [Moriondo et al. (1999)] Moriondo G., Baffa C., Casertano S., Chincarini G., Gavazzi G., Giovanardi C., Hunt L.K., Pierini D., Sperandio M., Trinchieri G., 1999, A&AS, 137, 101
- [Moshir et al. (1990)] Moshir M., Kopan G., Conrow T., et al., 1990, Infrared Astronomical Satellite Faint Source Catalogue, version 2.0
- [Nilson (1973)] Nilson P., 1973, Uppsala General Catalogue of Galaxies. Royal Society of Sciencies of Uppsala, Uppsala (UGC)
- [Persic, Salucci & Stel (1996)] Persic M., Salucci P., Stel F., 1996, MNRAS, 283, 1102
- [Pignatelli & Galletta 1999] Pignatelli E., Galletta G., 1999, A&A, 349, 369
- [Press et al. (1996)] Press W.H., Teukolsky S.A., Vetterling W.T., Flannery B.P., 1996, Numerical Recipes in Fortran 77: The Art of Scientific Computing. Cambridge University Press, Cambridge
- [Rhee & van Albada (1996)] Rhee M.-H., van Albada T.S., 1996, A&AS, 115, 407
- [Rubin et al. (1985)] Rubin V.C., Burstein D., Ford W.K.Jr., Thonnard N., 1985, ApJ, 289, 81
- [Salucci & Persic (1999)] Salucci P., Persic M., 1999, A&A, 351, 442
- [Sandage & Bedke (1994)] Sandage A., Bedke J., 1994, The Carnegie Atlas of Galaxies. Carnegie Institution and Flintridge Foundation, Washington
- [Sandage & Tammann (1981)] Sandage A., Tammann G.A., 1981, A Revised Shapley-Ames Catalog of Bright Galaxies. Carnegie Institution, Washington (RSA)
- [Schombert & Bothun (1987)] Schombert J.M., Bothun G.D., 1987, AJ, 93, 60
- [Simien & de Vaucouleurs (1986)] Simien F., de Vaucouleurs G., 1986, ApJ, 302, 564
- [Sofue & Rubin (2001)] Sofue Y., Rubin V.C., 2001, ARA&A, 39, submitted (astro-ph/0010594)
- [van der Marel & Franx (1993)] van der Marel R.P., Franx M., 1993, ApJ, 407, 525
- [van Albada and Sancisi (1986)] van Albada T.S., Sancisi R., 1986, Royal Society of London Philosophical Transactions Series, 320, 447
- [van Driel & van Woerden (1994(] van Driel W., van Woerden H., 1994, A&A, 286, 395
- [Vega Beltrán (1999)] Vega Beltrán J.C., 1999, Ph.D. thesis, Instituto de Astrofísica de Canarias
- [Vega Beltrán et al. (2000)] Vega Beltrán J.C., Pizzella A., Corsini E.M., Funes J.G., Sarzi M., Zeilinger W.W., Bertola F., 2000, in preparation
- [Wadadekar, Robbason & Kembhavi (1999)] Wadadekar Y., Robbason B., Kembhavi A., 1999, AJ, 117, 1219
- [Watanabe (1983)] Watanabe, M. 1983, Annales of the Tokyo Astronomical Observatory, 19, 121
- [Whitmore, Rubin & Ford (1984)] Whitmore B.C., Rubin V.C., Ford W.K.Jr., 1984, ApJ, 287, 66
- [Young et al. (1989)] Young J.S., Xie S., Kenney J.P.D., Rice W.L., 1989, ApJS, 70, 699