WHERE IS THE [O iii]4363 EMITTING REGION
IN ACTIVE GALACTIC NUCLEI?
Abstract
The emission-line flux ratio of [O iii]4363/[O iii]5007 () is a useful diagnostic for the ionization mechanism and physical properties of emission-line regions in active galactic nuclei (AGNs). However, it is known that simple photoionization models underpredict the [O iii]4363 intensity, being inconsistent with observations. In this paper, we report on several pieces of evidence that a large fraction of the [O iii]4363 emission arises from the dense gas obscured by putative tori: (1) the visibility of high- regions is correlated to that of broad-line regions, (2) higher- objects show hotter mid-infrared colors, (3) higher- objects show stronger highly-ionized emission lines such as [Fe vii]6087 and [Fe x]6374, and (4) higher- objects have broader line width of [O iii]4363 normalized by that of [O iii]5007. To estimate how such a dense component contributes to the total emission-line flux, dual-component photoionization model calculations are performed. It is shown that the observed values of of type 1 AGNs may be explained by introducing a 5% – 20% contribution from the dense component while those of type 2 AGNs may be explained by introducing a 0% – 2% contribution. We also discuss the [O iii]4363 emitting regions in LINERs in the framework of our dual-component model.
Subject headings:
galaxies: nuclei - galaxies: Seyfert - quasars: emission lines1. INTRODUCTION
It has been often considered that emission-line regions around active galactic nuclei (AGNs) are photoionized by the nonthermal continuum radiation from central engines (e.g., Davidson 1977; Yee 1980; Kwan & Krolik 1981; Shuder 1981; Cohen 1983; Cruz-González et al. 1991; Osterbrock 1993; Evans et al. 1999). However, this photoionization scenario has sometimes been confronted with several serious problems.
One of such problems is that any single-zone photoionization models underpredict the [O iii]4363/[O iii]5007 intensity ratio, (e.g., Koski & Osterbrock 1976; Ferland & Netzer 1983; Filippenko & Halpern 1984; Viegas-Aldrovandi & Gruenwald 1988). The reason for the underprediction of is thought to be that photoionization of gas in optically thick condition is hard to accomplish electron temperatures above a few K if density of the gas is typical in narrow-line regions (NLRs). In order to solve this problem, many studies have been carried out. Such attempts can be roughly divided into the following two categories. One is based on the idea that a high density component may contribute to achieve the observed high (e.g., Baldwin 1975; Osterbrock, Koski, & Phillips 1976; Filippenko & Halpern 1984; Filippenko 1985). This idea is attributed to the fact that the critical density () of the [O iii]4363 emission (3.3 cm-3) is higher than that of the [O iii]5007 emission (7.0 cm-3); which leads to high when the gas density is higher than cm-3. The other idea is to introduce high temperature regions whose temperature is more than a few times 104 K. To achieve such high temperatures, either shock-heated regions (e.g., Koski & Osterbrock 1976; Heckman 1980; Dopita & Sutherland 1995) or optically-thin components (e.g., Wilson, Binette, & Storchi-Bergmann 1997) is required.
In addition, some previous studies reported that the values of depend on the AGN type; i.e., type 1 Seyfert nuclei (S1s) exhibit higher than type 2 Seyfert nuclei (S2s) (e.g., Osterbrock et al. 1976; Heckman & Balick 1979; Shuder & Osterbrock 1981; Cohen 1983). This tendency seems to suggest that a part of the [O iii]4363 emission arises from the regions which are obscured only in S2s by any materials, such as dusty tori. However, this tendency may be interpreted by the intrinsic (that is, not due to obscuration effects) difference of NLR properties, such as the size (Schmitt & Kinney 1996; Kraemer et al. 1998) or the ionization states (Schmitt 1998).
To investigate the reason why S1s show high than S2s seems useful to explore where and how the [O iii]4363 emission is radiated. Moreover, these may lead to the new solution to the underprediction problem of . Therefore, in this paper, we present how the observed values of are different among various types of Seyferts based on a large sample of Seyferts compiled from the literature. Then, we compare with various parameters and discuss the nature of the [O iii]4363 emitting regions in AGNs.
2. DATA COMPILATION
2.1. Data
We briefly summarize the policy of classification of Seyfert nuclei in this paper, which is the same as that in Nagao, Taniguchi, & Murayama (2000c). Seyfert nuclei are often divided into three types based on the visibility of broad components of hydrogen recombination lines: i.e., S1, Seyfert 1.5 (S1.5), and S2. The S1s consist of typical S1s (BLS1s; broad-line Seyfert 1 galaxies) and narrow-line Seyfert 1 galaxies (NLS1s; e.g., Osterbrock & Pogge 1985; Boller, Brandt, & Fink 1996). The type of Seyfert 1.2 (S1.2) is included in the type of BLS1 in this paper. We divide the type of S2 into S2+ and S2-; the former one exhibits the evidence for the existence of broad-line regions (BLRs) and the latter does not show such the evidence. For the convenience, both types of S2+ and S2- are referred as S2total when needed; i.e., S2total = S2+ + S2-. There are two populations in the types of S2+: one shows weak symptoms of the existence of BLRs in their optical or near-infrared (NIR) spectra (S2RBLR; type 2 Seyfert with the reddened BLR) and another one exhibits the hidden BLR which is detected only in polarized spectra (S2HBLR). The type of S2RBLR consists of Seyfert 1.8 galaxies (S1.8s), Seyfert 1.9 galaxies (S1.9s), and the Seyfert galaxies with the broad Paschen or Bracket line (S2NIR-BLRs). They are combined into S2+ when statistical treatments are needed.
In order to investigate statistical properties of the observed values of for each type of Seyferts, we compiled from the literature. The number of compiled objects is 214; 26 NLS1s, 56 BLS1s, 54 S1.5s, 4 S1.8s, 16 S1.9s, 5 S2NIR-BLRs, 8 S2HBLRs, and 45 S2-s. We basically referred to Véron-Cetty & Véron (1998) for the AGN type of each object. Though Mrk 335, Mrk 766, Mrk 1126, H 34.06, H 1934–063, HE 1029–1831, and J 13.12 are not classified as NLS1 by Véron-Cetty & Véron (1998), they are treated as NLS1 in this paper because they have been classified as NLS1 (Osterbrock & Pogge 1985; Vaughan et al. 1999; Rodríguez-Ardia, Pastoriza, & Donzelli 2000).
All the objects are listed in Table 1 together with their redshifts, , and the fluxes at 3.5m, 12m, 25m, and 60m. The values of in this table are the averaged ones among the references given there. We do not make the reddening correction for the values of since it is often difficult to measure the narrow Balmer component, particularly for S1s. It is noted that we do not use any upper limit data in this study.
2.2. Selection Bias


| typeaaThe number of objects for each type is written in parenthesis. | Redshift | log ((60m)/) | |
|---|---|---|---|
| NLS1 (26) | 0.0567 0.0532 | 11.694 0.563 | 0.126 0.132 |
| BLS1 (56) | 0.1329 0.1612 | 11.664 0.571 | 0.091 0.077 |
| S1.5 (54) | 0.1192 0.1768 | 11.546 0.499 | 0.107 0.210 |
| S2total (78) | 0.0407 0.0674 | 11.454 0.621 | 0.039 0.044 |
| S2+ (33) | 0.0375 0.0657 | 11.480 0.496 | 0.047 0.054 |
| S1.8 (4) | 0.0996 0.1383 | 11.694 0.387 | 0.097 0.070 |
| S1.9 (16) | 0.0255 0.0401 | 11.368 0.495 | 0.053 0.060 |
| S2NIR-BLR (5) | 0.0594 0.0564 | 11.368 0.109 | 0.029 0.021 |
| S2HBLR (8) | 0.0168 0.0104 | 11.635 0.522 | 0.023 0.011 |
| S2- (45) | 0.0431 0.0685 | 11.429 0.717 | 0.033 0.032 |
| Type | NLS1 | BLS1 | S1.5 | S2+ | S2- |
|---|---|---|---|---|---|
| Redshift | |||||
| NLS1 | 1.671 | 6.734 | 1.831 | 8.579 | |
| BLS1 | 6.818 | 3.525 | 5.410 | ||
| S1.5 | 5.872 | 3.685 | |||
| S2+ | 1.624 | ||||
| S2- | |||||
| (60m) | |||||
| NLS1 | 8.792 | 7.908 | 8.970 | 3.923 | |
| BLS1 | 4.439 | 5.986 | 1.920 | ||
| S1.5 | 4.788 | 6.648 | |||
| S2+ | 7.911 | ||||
| S2- | |||||
| NLS1 | 7.877 | 2.037 | 1.555 | 9.933 | |
| BLS1 | 4.064 | 5.735 | 4.612 | ||
| S1.5 | 2.045 | 4.106 | |||
| S2+ | 1.264 | ||||
| S2- | |||||
Because we do not impose any selection criteria upon our sample, it is necessary to test whether or not the various samples are appropriate for our comparative study. There would be possible biases if there are any systematic differences in the redshift distributions or in the intrinsic nuclear luminosity distributions, thus we investigate those distributions below.
First we investigate the redshift distributions. We show the histograms of redshift in Figure 1. The mean redshift and the 1 deviation for each type are given in Table 2. There seems to be a tendency that the redshifts of the objects in the samples of the BLS1 and the S1.5 are larger than those in the other samples. In order to confirm whether or not this tendency is statistically real, we apply the Kolmogorov-Smirnov (KS) statistical test (see Press et al. 1988). The null hypothesis is that the redshift distributions among the NLS1s, the BLS1s, the S1.5s, the S2+s, and the S2-s come from the same underlying population. The KS probabilities are given in Table 3. The KS test leads to the following results. (1) The redsifts of the NLS1s, of the BLS1s, and of the S1.5s are statistically indistinguishable. (2) The redshifts of the S2+ and of the S2- are also statistically indistinguishable. (3) However, the former and the latter are statistically different. Does this difference of the redshift cause any possible biases against the following comparative study? To investigate this issue, we examine the relation between , which is our main interest in this paper, and redshift (Figure 2). Figure 2 suggests that there is no correlation between and redshift. This means that the redshift difference among the samples is thought not to cause a bias against the investigation of properties of .
Second we consider the intrinsic AGN power. The so-called AGN unified model (Antonucci & Miller 1985; see for a review Antonucci 1993) requires anisotropic nuclear radiation. This may cause systematic differences in intrinsic AGN power among the types of Seyferts depending on selection criteria. Statistical properties of emission-line ratios for each type of Seyferts might suffer from this bias of intrinsic luminosity. Therefore, we investigate the intrinsic AGN power distributions using the IRAS 60m luminosity, which is regarded as rather isotropic emission (e.g., Pier & Krolik 1992; Efstathiou & Rowan-Robinson 1995; Fadda et al. 1998) though this might be contaminated with the influence of circumnuclear star formation. The histograms of the 60m luminosity are shown in Figure 3. The mean 60m luminosities and 1 deviations are given in Table 2. Here we adopt a Hubble constant = 50 km s-1 Mpc-1 and a deceleration parameter = 0. We apply the KS test where the null hypothesis is that the distribution of the 60m luminosity of the samples come from the same underlying population. The resultant KS probabilities are given in Table 3. The KS test suggests that there is no systematic difference in the 60m luminosity among the types of Seyfert galaxies. It is noted that there is no correlation between and the 60m luminosity, i.e., the intrinsic AGN power (Figure 4).
3. RESULTS
3.1. Dependence of on the AGN Type

We show the histograms of for each type of Seyfert galaxies in Figure 5. The mean and the 1 deviation of for each type are given in Table 2. In Figure 5, it is clearly shown that the S2totals exhibit lower than the NLS1s, the BLS1s, and the S1.5s. There seems to be a tendency also in details of the S2totals; i.e., the values of of the S1.8s are higher than those of the S1.9s, and those of the S1.9s are higher than those of the S2NIR-BLRs, the S2HBLRs, and the S2-s although the numbers of the samples are small. These properties can be interpreted that the more the BLR emission suffers the reddening, the lower the observed value of is. We apply the KS test where the null hypothesis is that the distribution of of the various types comes from the same underlying population. The resultant KS probabilities are given in Table 3. The KS test leads to the following results. (1) The NLS1s, the BLS1s, and the S1.5s are statistically indistinguishable in the frequency distribution of . (2) The S2+ and the S2- are also statistically indistinguishable. (3) However, the NLS1s, of the BLS1s, and of the S1.5s have statistically higher values than the S2+s and the S2-s. These results are consistent with the previous works; Osterbrock et al. (1976), Heckman & Balick (1979), and Shuder & Osterbrock (1981) have mentioned that the S1s show higher values than the S2s, and Cohen (1983) has found that the S1.5s also show higher values than the S2s. Nagao, Murayama, & Taniguchi (2000a) recently confirmed that the observed values are statistically indistinguishable between the NLS1s and the BLS1s (see also Rodríguez-Ardia et al. 2000).
It seems possible that the difference in among the types of Seyfert galaxies is attributed to the systematic difference in the amounts of the reddening, because we do not make any reddening correction for the compiled emission-line flux data. Thus we investigate the reddening effect on adopting the Cardelli’s extinction curve (Cardelli, Clayton, & Mathis 1989). It results in that the correction factors for the observed value of is 1.222 for the reddening if we assume = 1.0 mag, which is typical difference in the amounts of reddening for NLRs between S1s and S2s (Dahari & De Robertis 1988; see also De Zotti & Gaskell 1985). This factor is too small to explain the systematic difference of among the types of Seyfert galaxies. Therefore we conclude that the reason of the systematic difference of among the Seyfert types is not the extinction effect but any other mechanism, discussed later.
3.2. Correlation between and MIR-Color

Dust grains within dusty tori in AGNs absorb NIR to soft X-ray photons emitted from the central engine, and re-emit the thermal radiation in the mid-infrared (MIR) regime. Since the tori are quite optically thick, the MIR spectrum has strong dependence on the viewing angle (e.g., Heckman, Chanbers, & Postman 1992; Giuricin, Mardirossian, & Mezzetti 1995; Heckman 1995; Fadda et al. 1998; Murayama, Mouri & Taniguchi 2000). This means that the hot inner surface of dusty tori is seen when the torus is observed from a favored (i.e., more face-on) view but obscured when observed from a unfavored (i.e., more edge-on) view. Therefore, it is interesting to investigate correlations between the MIR colors and .
The dependences of on the flux ratios of IRAS 12 m and band to IRAS 25 m are shown in Figure 6. These two flux ratios are used to investigate the visibility of the hot inner surface of dusty tori in AGNs. The method using the flux ratio of band to IRAS 25 m is proposed by Murayama et al. (2000) for the purpose of reducing the influence of star-formation. In Figure 6, there appears a positive correlation in each diagram. In order to investigate whether or not these positive correlations are statistically significant, we apply the Spearman’s rank test (see Press et al. 1988) where the null hypothesis is that the observed value of is not correlated with the flux ratios of IRAS 12 m and of band to IRAS 25 m. The resulting probabilities are 3.598 for the flux ratio of IRAS 12 m to IRAS 25 m and 3.254 for the flux ratio of band to IRAS 25 m, which mean that the positive correlations shown in Figure 6 are statistically real. This means that the hotter the observed MIR colors are, the higher the observed values of are.
3.3. Correlation between and HINER Components

Pier & Voit (1995) investigated the hydrodynamic and line-emitting properties of dense clouds exposed to an AGN continuum emission at the inner edge of the torus. Since such regions have a large covering factor and a high density ( cm-3), those clouds are thought to be a plausible place to produce the highly-ionized emission lines such as [Fe vii]6087 and [Fe x]6374111 The critical densities of these emission lines are 3.6 cm-3 for [Fe vii]6087 and 4.8 cm-3 for [Fe x]6374 (De Robertis & Osterbrock 1986b). Thus these highly ionized emission lines can be radiated in the clouds of cm-3. However, low-ionization emission lines such as [O iii]5007 are suppressed by a collisional de-excitation in such a dense gas cloud because of low-ionization emission lines are generally low comparing to of the dense gas clouds. . This picture is consistent with the fact that such highly-ionized emission lines are stronger in S1s than in S2s (Murayama & Taniguchi 1998a; Nagao et al. 2000c). That is, a large part of the high-ionization nuclear emission-line regions (HINERs; Binette 1985; Murayama, Taniguchi, & Iwasawa 1998) is located at the region which is obscured in S2s by any materials, such as dusty tori.
Since is higher in S1s than in S2s and of the [O iii]4363 emission is comparable with of [Fe vii]6087, it is interesting to investigate the relation between the intensity of the [O iii]4363 emission and those of the HINER emission lines, [Fe vii]6087 and [Fe x]6374. The flux of these HINER lines is normalized by the flux of [O iii]5007 following the manner of Murayama & Taniguchi (1998a) and Nagao et al. (2000c). The results are shown in Figure 7. There is a positive correlation for each case, especially between and the flux ratio of [Fe vii]6087/[O iii]5007. This means that the strong [O iii]4363 emitting regions are located at the same place as the HINERs.
It should be noted that the value of correlates to the intensity of [Fe x]6374 worse than to that of [Fe vii]6087. This is consistent with the remark of Nagao et al. (2000c) that the intensity of [Fe x]6374 is less suitable to investigate the viewing angle toward tori than that of [Fe vii]6087; they claimed that a part of the [Fe x]6374 emission is radiated from spatially extended, low-density gas (see also Korista & Ferland 1989; Golev et al. 1995; Murayama et al. 1998; Nagao et al. 2000b).
3.4. Kinematical Investigation of [O iii] Emitting Regions

| sample | mean and deviation | |
|---|---|---|
| DRO84 | FWHM([O III]4363) | 684 225 |
| FWHM([O III]5007) | 387 157 | |
| FWHM([O III]4363)/FWHM([O III]5007) | 2.03 0.96 | |
| DRO86 | FWHM([O III]4363) | 492 168 |
| FWHM([O III]5007) | 434 147 | |
| FWHM([O III]4363)/FWHM([O III]5007) | 1.16 0.25 |
| KS Prob. | |
|---|---|
| FWHM([O iii]4363) versus FWHM([O iii]5007) | |
| DRO84 | 0.012 |
| DRO86 | 0.226 |
| DRO84 versus DRO86 | |
| FWHM([O iii]4363) | 0.023 |
| FWHM([O iii]5007) | 0.330 |
| FWHM([O iii]4363)/FWHM([O iii]5007) | 0.023 |
Emission-line width of the NLR emission gives us some pieces of useful information about the kinematical and geometrical properties of gas clouds in the NLRs. Some earlier works have shown that there is a correlation between the emission-line width and of the emission line [e.g., Pelat, Fosbury, & Alloin 1981; Atwood, Baldwin, & Carswell 1982; Filippenko & Halpern 1984; De Robertis & Osterbrock 1984 (DRO84); Filippenko 1985; De Robertis & Osterbrock 1986 (DRO86); Appenzeller & Östreicher 1988; Espey et al. 1994]. This correlation is broadly interpreted as follows. A given emission line is emitted most efficiently from gas clouds whose densities are close to . On the other hand, we can use line width as a rough measure of location of the emitting region if we assume that the NLR line widths are dominated either by random virialized motion or by Keplerian rotation. Therefore the correlation between line width and suggests that high-density gas clouds are located near the central engine relative to low-density gas clouds (DRO84; DRO86; see also Ferguson et al. 1997). This allows us to study the geometrical relationship between the [O iii]4363 and the [O iii]5007 emitting regions.
DRO84 measured the line widths of [O iii]4363 and [O iii]5007 for 11 broad-line Seyfert galaxies (NLS1s, BLS1s, and S1.5s) and DRO86 measured those for 13 narrow-line Seyfert galaxies (S2+s and S2-s). Using these data, which are corrected for the instrumental broadening, we compare the kinematical and geometrical properties between the [O iii]4363 and the [O iii]5007 emitting regions in the two samples. Note that the [O iii]4363 emission is weak and that sometimes the deblending this line from H may be difficult. Therefore we do not attempt to collect the line-width data from a large number of the literature and use only ones presented by De Robertis & Osterbrock. However, the difficulty in the measurement of the line widths may cause any systematical errors, which must be kept in mind. Since the numbers of the samples of DRO84 and DRO86 are small, we do not divide the sample into more detailed ones in this section.
The means and the 1 deviations of the full-width at half maximum (FWHM) of [O iii]4363 and [O iii]5007, and ratios of them are given in Table 4. The histograms of these parameters are shown in Figure 8. In order to investigate whether or not the distributions of the line width of [O iii]4363 and that of [O iii]5007 are statistically different, and whether or not these distributions are statistically different between the samples of DRO84 and DRO86, we apply the KS test. The KS test leads to the following results. (1) For the DRO84 sample, FWHM([O iii]4363) is larger than FWHM([O iii]5007) though the statistical significance is low ( = 0.012). (2) For the DRO86 sample, FWHM([O iii]4363) and FWHM([O iii]5007) are statistically indistinguishable ( = 0.226). (3) FWHM([O iii]4363) of the DRO84 sample is larger than that of the DRO86 sample though the statistical significance is low ( = 0.023). (4) FWHM([O iii]5007) of the DRO84 sample and that of the DRO86 sample are statistically indistinguishable ( = 0.330). And finally, (5) the ratio of FWHM([O iii]4363)/FWHM([O iii]5007) of the DRO84 sample is larger than that of the DRO86 sample though the statistical significance is low ( = 0.023). These results are summarized in Table 5. All these results support the idea that the strong [O iii]4363 emitting region is located at inner region comparing to the [O iii]5007 emitting region, and such a strong [O iii]4363 emitting region is visible only in S1s but obscured in S2s, although a much larger sample will be necessary to confirm these arguments.
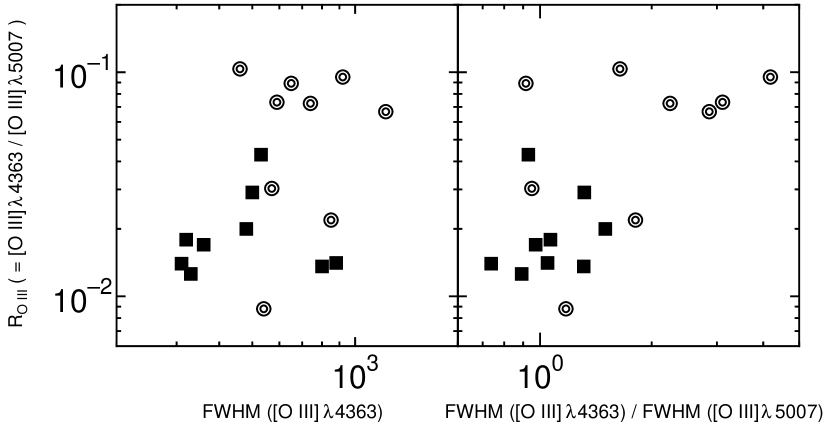
To investigate the relationship between the visibility and kinematics of the [O iii]4363 emitting regions more directly, we examine the dependence of on FWHM([O iii]4363) and that on the ratio of FWHM([O iii]4363)/FWHM([O iii]5007) in Figure 9. In order to examine whether or not there are any correlations in these parameters statistically, we apply the Spearman’s rank test where the null hypothesis is that the observed value of is not correlated with FWHM([O iii]4363) or FWHM([O iii]4363)/FWHM([O iii]5007). The resulting probabilities are 0.165 for FWHM([O iii]4363) and 0.032 for FWHM([O iii]4363)/FWHM([O iii]5007). These results mean that there is no correlation between and FWHM([O iii]4363) while there is a marginal tendency of a positive correlation between and the ratio of FWHM([O iii]4363)/FWHM([O iii]5007). This difference is caused because FWHM([O iii]4363) reflects not only the location of the [O iii]4363 emitting region but also the mass of a supermassive black hole while the effect of the dispersion of the mass of a supermassive black hole among objects is reduced in the value of FWHM([O iii]4363)/FWHM([O iii]5007).
It should be noted that there are some lines of evidence which show that some of broader emission-line widths of highly-ionized emission lines are due to outflows, not to the depth of gravitational potentials (e.g., Moore & Cohen 1996; Kaiser et al. 2000; Nelson et al. 2000; Crenshaw & Kraemer 2000). If this is the case, line widths might not contain the information concerning the geometry of line-emitting gas clouds. However, unfortunately, the present data cannot distinguish these two interpretations.
4. DISCUSSION
4.1. Where is the [O iii]4363 Emitting Region in AGNs?

| Type | NLS1 | BLS1 | S1.5 | S2total |
|---|---|---|---|---|
| NLS1 | 4.291 | 4.394 | 4.445 | |
| BLS1 | 9.312 | 8.359 | ||
| S1.5 | 1.225 | |||
| S2total | ||||
| NLS1 | 2.519 | 2.263 | 4.419 | |
| BLS1 | 7.925 | 2.515 | ||
| S1.5 | 5.194 | |||
| S2total | ||||
In this section, we discuss why the observed values of are higher in S1s than in S2s and how the high comparing to the predicted values by simple photoionization models is achieved.
The first problem is the type dependence of the observed values of , shown in Figure 5. There are two possible interpretations to understand this dependence. One is that the [O iii]5007 emission is stronger in S2s than S1s due to the intrinsically (i.e., not due to inclination effects) larger size of NLRs of S2s as proposed by Schmitt & Kinney (1996). Another is that the strong [O iii]4363 emitting regions exist somewhere but obscured by something on the line of sight when we see S2s. Because the intrinsic AGN luminosity is similar among the various types of Seyferts in our sample as mentioned in Section 2.2, the former case predicts the stronger [O iii]5007 luminosity in S2s than in S1s and similar [O iii]4363 luminosity among the Seyfert types. On the other hand, the latter case predicts the similar [O iii]5007 luminosity among the Seyfert types and the stronger [O iii]4363 luminosity in S1s than in S2s. These two cases may be the extreme ones and the real situation might be intermediate between the two cases. However, it is interesting to investigate which case is close to the observed properties of emission-line spectra. Therefore we compare the observed emission-line luminosity of [O iii]5007 and [O iii]4363 among various types of Seyferts, which is shown in Figure 10. To quantify the statistical significance of the difference in the luminosity distribution among the Seyfert types, we apply the KS test where the null hypothesis is that the distribution of these emission-line luminosities come from the same underlying population. The KS test leads to the following results. (1) The distributions of the [O iii]5007 luminosity are statistically indistinguishable among the BLS1s, the S1.5s, and the S2s though the [O iii]5007 luminosity of the NLS1s are weaker than that of other Seyfert types. (2) The distributions of the [O iii]4363 luminosity are statistically indistinguishable among the NLS1s, BLS1s, and the S1.5s though the [O iii]4363 luminosity of the S2s are weaker than that of the BLS1s and the S1.5s. The KS probabilities are given in Table 6. These results are consistent with the latter case; i.e., the type dependence of the observed values of is not due to the dilution by a more extended NLR in S2s but due to the enhancement of the [O iii]4363 emission in S1s. The reason why the [O iii]5007 luminosity is smaller in the NLS1s than in other types may be that NLS1s are the extreme objects on the “eigenvector 1” of Boroson & Green (1992). More explicitly, there is a relation that the weaker the [O iii]5007 emission is, the narrower the FWHM of H is (e.g., Boroson & Green 1992; Brandt & Boller 1998; Sulentic et al. 2000). Following this relation, NLS1s may tend to exhibit weak [O iii]5007 emissions as shown in Figure 10.
The properties of emission-line width described in Section 3.4 also support the idea that the dependence of on AGN types is not due to the dilution of by extended low density gas in S2s but due to the obscuration of the strong [O iii]4363 emitting region in S2s. The S1s exhibit the broad [O iii]4363 comparing to [O iii]5007 while the S2s do not so. This suggests the existence of the inner, strong [O iii]4363 emitting region which is obscured in S2s. We, therefore, conclude that the dependence of on AGN types is attributed to the obscuration effect.
Now we consider the following problems. Where is the [O iii]4363 emitting region in AGNs? And, how is the high comparing to the predicted values by simple photoionization models achieved? According to the current unified model of AGNs, it is natural to consider that the material obscuring the strong [O iii]4363 emitting regions in S2s is dusty tori. If this is the case, the strong [O iii]4363 emitting region may be either the inner surface of dusty tori described by Pier & Voit (1995) or the dense gas clouds near the central engine, which are obscured by the tori, though these two alternatives cannot be distinguished only by the statistical tests presented in this paper. This is consistent with the similarity of the location between the HINER and the strong [O iii]4363 emitting region, which is suggested by the correlation between the intensity of the HINER emission and (see Section 3.3) because large parts of the HINER emission is thought to arise from such dense clouds (Pier & Voit 1995; Murayama & Taniguchi 1998a, 1998b; Nagao et al. 2000c). The MIR properties described in Section 3.2 also support this geometrical consideration of the [O iii]4363 emitting region; i.e., the correlations between the MIR colors and mean the similarity between the visibility of relatively hot inner surface of dusty tori and that of the strong [O iii]4363 emitting region.
However, some of S2s also exhibit large , which is also difficult to be explained by the simple one-zone photoionization model. They may be have dense gas clouds in NLR, which is not obscured by dusty tori because of the large distance from the nucleus, or the escaping [O iii]4363 emission from the leaky parts of the tori.
4.2. Interpretation Using the Dual-Component Photoionization Model


As described in Section 4.1, high-density gas clouds obscured by tori, which are located either at the inner surface of dusty tori or near the central engine where is obscured by the tori, are thought to emit a large fraction of the [O iii]4363 emission. In order to investigate whether or not such an idea is consistent with photoionization scenarios quantitatively, we perform dual-component photoionization model calculations following the manner of Murayama & Taniguchi (1998b). This method takes account of such high-density gas clouds as a strong [O iii]4363 emitter, in addition to the typical NLR component. Here we assume the second situation, i.e., the strong [O iii]4363 emitting region is not physically associated by the tori. Therefore we do not consider effects of dust, such as depletion of heavy metals, through the following calculations.
Our calculation methods are as follows. We perform photoionization model calculations using the spectral synthesis code Cloudy version 90.04 (Ferland 1996), which solves the equations of statistical and thermal equilibrium and produces a self-consistent model of the run of temperature as a function of depth into the nebula. Here we assume an uniform-density gas cloud with a plane-parallel geometry. The dense component (DC) is assumed to be truncated clouds; i.e., optically thin clouds for the ionizing photons, for the purpose of avoiding unusually strong [O i] emission (see Murayama & Taniguchi 1998b). The parameters for the calculations are (1) the hydrogen density of the cloud ( and ), (2) the ionization parameter ( and ), which is defined as the ratio of the ionizing photon density to the electron density, (3) the thickness of the torus component which is represented by the optical depth for ionizing photons, (4) the chemical compositions of the gas, (5) the shape of the input SED of ionizing photons, and (6) the fraction of DC to the NLR component.
Here we assume cm-3. We perform several model runs covering 101 cm cm-3. The ionization parameter of the NLR component is assumed as . The ionization parameter and the hydrogen column density of DC are determined using following two conditions; ([Fe x]6374/[Fe vii]6087)DC = 0.8 and ([Fe vii]6087/[O iii]5007)DC = 1.0. The former ratio is the typical value of Seyfert galaxies (Nagao et al. 2000c) and the latter condition is introduced by Murayama & Taniguchi (1998b) as a truncated dense gas cloud. As the result, and cm-2 are adopted 222 Because it is known that there is uncertainty in collision strengths for the [Fe x]6374 emission, the derived values of and may also suffer such uncertainties. (see Figure 10). The calculations are stopped when the gas temperature falls to 4000 K for the NLR component. We set the gas-phase elemental abundances to be solar ones taken from Grevesse & Anders (1989) with extensions by Grevesse & Noels (1993). We adopt the power-law continuum as the input spectrum, where the spectral index is assumed as = –1.5 (see Ferland & Netzer 1983) between 10 m and 50 keV for the form . The spectral index is set to = 2.5 at lower energy (i.e., m) and to = –2 at higher energy (i.e., 50 keV). The fraction of DC to the NLR component is treated as a free parameter in our calculations. The further details for this dual-component photoionization model are described in Murayama (1998) and Murayama & Taniguchi (1998b).
We present our results of model calculations and compare them with the observations in Figure 12, which is a diagram of versus [Fe vii]6087/[O iii]5007. We find that the model grids are roughly consistent with the observations if we take the effects of the correction for the extinction into account. Though the dispersion of observation is larger than the model grids, this is thought to be attributed the fact that the parameters, such as , , , and , are different from object to object. It is shown that the of the S1s can be explained by introducing a 5% 20% contribution from DC while the of the S2s can be explained by introducing a 0% 2% contribution from DC. These fractions are consistent with the results of Murayama & Taniguchi (1998b), who introduce a contribution from the dense gas clouds to explain intensities of the HINER emission of S1s.
4.3. in LINERs

| Object Name | Referenceaa References for the data of . Each abbreviation means as follows; F85: Filippenko (1985); FH84: Filippenko & Halpern (1984); HFS93: Ho, Filippenko, & Sargent (1993); HFS96: Ho, Filippenko, & Sargent (1996); and HFS97: Ho, Filippenko, & Sargent (1997a). | |
|---|---|---|
| LINER with a broad component | ||
| NGC 1052 | 0.0606 | HFS93 |
| 0.0353 | HFS97 | |
| NGC 1275 | 0.0923 | HFS93 |
| NGC 3031 | 0.1884 | HFS93 |
| 0.0938 | HFS96 | |
| NGC 3226 | 0.0901 | HFS97 |
| NGC 4278 | 0.1353 | HFS97 |
| NGC 4395 | 0.0312 | HFS93 |
| NGC 4579 | 0.0510 | HFS97 |
| NGC 7213 | 0.2030 | FH84 |
| LINER without a broad component | ||
| NGC 1167 | 0.0090 | HFS93 |
| NGC 1961 | 0.0750 | HFS97 |
| NGC 3504 | 0.0618 | HFS93 |
| NGC 4102 | 0.0300 | HFS97 |
| NGC 6500 | 0.0500 | HFS97 |
| NGC 7714 | 0.0121 | HFS93 |
| PKS 1718-649 | 0.0960 | F85 |
In some low-ionization nuclear emission-line regions (LINERs), the observed values of are far larger than that predicted by one-zone photoionization models. Because of this property, the dominant mechanism for the ionization in LINERs has been frequently regarded as shock ionization (e.g., Fosbury et al. 1978; Heckman 1980; Baldwin, Phillips, & Terlevich 1981). However, Filippenko (1985) pointed out that there is a correlation between the emission-line width and of the emission line over the range 103 cm cm-3 in a LINER PKS 1718-649. This suggests that LINERs may also possess high-density regions up to 107 cm-3, which mean that the high in LINERs may be explained by photoionization models.
Although it is not clear whether or not there is a dusty torus in all LINERs, there is several pieces of evidence that the unified models of AGNs can apply to some of LINERs; i.e., some LINERs exhibit broad components in their optical spectra (e.g., Ho et al. 1997b), in UV spectra (e.g., Barth et al. 1996), or only in polarized spectra (Barth, Filippenko, & Moran 1999a, 1999b). Therefore it is interesting to examine the properties of of LINERs in the framework of our dual component model.
In order to investigate this issue, we compiled of LINERs from the literature. Since the optical spectra of LINERs are often contaminated by stellar features from the host galaxy strongly, careful subtraction of such stellar features from observed spectra is needed to discuss the properties of faint emission lines such as [O iii]4363. Our compiled sample consists of the objects that such careful subtraction was applied to; 8 LINERs with broad components (L1.9s) and 7 LINERs without broad components (L2s). Here it must be kept in mind that some of the L2s may not be AGNs; a part of LINERs may be shock-heated galaxy (e.g., Heckman 1980; Baldwin et al. 1981; Heckman 1986; Gonzárez Delgado & Pérez 1996) and others may be the objects ionized by hot stellar component (e.g., Filippenko & Terlevich 1992; Binette et al. 1994; Alonso-Herrero et al. 2000; Taniguchi, Shioya, & Murayama 2000). It is noted that the compiled samples may be biased in favor of the higher objects because it is often difficult to detect weak [O iii]4363 emission owing to the relatively strong stellar feature. The objects we compiled are given in Table 7, and the histograms of for the L1.9s and the L2s are shown in Figure 13. The means and the deviations of are 0.099 0.054 for the L1.9s and 0.048 0.030 for the L2s. There are a tendency that the values of the L1.9s are higher than those of L2s though these are statistically indistinguishable ( = 0.252).
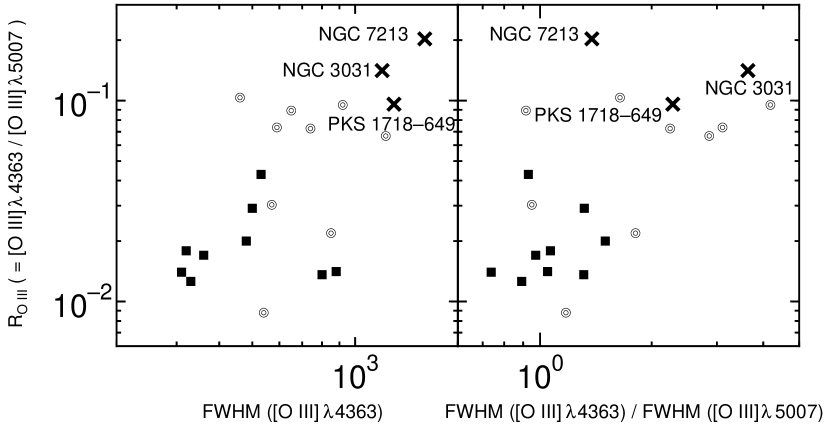
In the sample, the emission-line width of [O iii]4363 has been measured for three LINERs; NGC 3031 (Ho, Filippenko, & Sargent 1996), NGC 7213 (Filippenko & Halpern 1984), and PKS 1718-649 (Filippenko 1985). These data follow our dual component model; i.e., higher objects show larger values of FWHM([O iii]4363) and FWHM([O iii]4363)/FWHM([O iii]5007 (Figure 14).
These results seem to suggest that the [O iii]4363 emitting regions are located at inner than the [O iii]5007 emitting regions and that the [O iii]4363 emission has an anisotropic property for LINERs, too. Further observations are needed to investigate this issue in detail.
5. SUMMARY
In this paper we proposed the idea that a large fraction of [O iii]4363 originates in dense gas clouds obscured by the torus, which cause high values of comparing to predictions of simple one-zone photoionization models. We have shown some observational properties of which support our model.
-
•
The values of of the NLS1s, the BLS1s, and the S1.5s are higher than those of the S2s. This difference suggests a large fraction of [O iii]4363 emission is hidden by the torus in S2s.
-
•
The higher- objects show hotter MIR colors. The hotter MIR colors are thought to be attributed to the hotter dusty grains located at the inner surface of the dusty tori, which can be seen if we see the torus from more face-on view. Therefore, this means that the higher objects are seen from more face-on view toward dusty tori than the lower objects.
-
•
The higher- objects show stronger HINER emission. Since a large fraction of HINER emission is thought to arise from dense gas clouds at the inner surface of the dusty tori (Murayama & Taniguchi 1998a, 1998b), this means that the higher can be attributed to the significant flux contribution from such a high dense cloud as described by Pier & Voit (1995).
-
•
The S1s have wider FWHM([O iii]4363) and FWHM([O iii]4363)/FWHM([O iii]5007) than the S2s. This suggests that the [O iii]4363 emitting regions are located inner than the [O iii]5007 emitting regions and have an anisotropic property.
-
•
The higher- objects show larger FWHM([O iii]4363)/FWHM([O iii]5007) ratios. This also suggests that the [O iii]4363 emitting regions are located inner than the [O iii]5007 emitting regions.
As shown in section 3.4, there is too little information to discuss the kinematical and structural properties of the [O iii]4363 emitting region because it is often difficult to observe this emission line accurately. Therefore further observations are needed to confirm this dual-component model. In particular, the spatial distribution of should be investigated to judge the validity for this model. This dual-component model predicts that the higher ( 0.1) is seen only in nuclear region.
References
- (1)
- (2) Alonso-Herrero, A., Rieke, M. J., Rieke, G. H., & Shields, J. C. 2000, ApJ, 530, 688
- (3) Antonucci, R. R. J. 1993, ARA&A, 31, 473
- (4) Antonucci, R. R. J., & Miller, J. S. 1985, ApJ, 297, 621
- (5) Appenzeller, I., & Östreicher, R. 1988, AJ, 95, 45
- (6) Atwood, B., Baldwin, J. A., & Carswell, R. F. 1982, ApJ, 257, 559
- (7) Baldwin, J. A. 1975, ApJ, 201, L26
- (8) Baldwin, J. A., Phillips, M. M., & Terlevich, R. 1981, PASP, 93, 5
- (9) Barth, A. J., Filippenko, A. V., & Moran, E. C. 1999a, ApJ, 515, L61
- (10) Barth, A. J., Filippenko, A. V., & Moran, E. C. 1999b, ApJ, 525, 673
- (11) Barth, A. J., Reichert, G. A., Filippenko, A. V., Ho, L. C., Shields, J. C., Mushotzky, R. F., & Puchnarewicz, E. M. 1996, AJ, 112, 1829
- (12) Bergvall, N., Johansson, L., & Olofsson, K. 1986, A&A, 166, 92
- (13) Binette, L. 1985, A&A, 143, 334
- (14) Binette, L., Magris, C. G., Stasińska, G., & Bruzual, A. G. 1994, A&A, 292, 13
- (15) Boksenberg, A., Shortridge, K., Allen, D. A., Fosbury, R. A. E., Penston, M. V., & Savage, A. 1975, MNRAS, 173, 381
- (16) Boller, T., Brandt, W. N., & Fink, H. 1996, A&A, 305, 53
- (17) Boroson, T. A., & Green, R. F. 1992, ApJS, 80. 109
- (18) Brandt, W. N., & Boller, Th. 1999, ASP Conf. Ser. 175, in Structure and Kinematics of Quasar Broad Line Regions, ed. Gaskell, C. M. et al. (San Francisco: ASP), 265
- (19) Cardelli, J. A., Clayton, G. C., & Mathis, J. S. 1989, ApJ, 345,245
- (20) Cohen, R. D. 1983, ApJ, 273, 489
- (21) Cohen, R. D., & Osterbrock, D. E. 1981, ApJ, 243, 81
- (22) Costero, R., & Osterbrock, D. E. 1977, ApJ, 211, 675
- (23) Crenshaw, D. M., & Kraemer, S. B. 2000, ApJ, 532, L101
- (24) Crenshaw, D. M., Peterson, B. M., Korista, K. T., Wagner, R. M., & Aufdenberg, J. P. 1991, AJ, 101, 1202
- (25) Cruz-González, I., Carrasco, L., Serrano, A., Guichard, J., Dultzin-Hacyan, D., & Bisiacchi, G. F. 1994, ApJS, 94, 47
- (26) Cruz-González, I., Guichard, J., Serrano, A., & Carrasco, L. 1991, PASP, 103, 888
- (27) Dahari, O., & De Robertis, M. M. 1988, ApJS, 67, 249
- (28) Davidson, K. 1977, ApJ, 218, 20
- (29) Davidson, K., & Kinman, T. D. 1978, ApJ, 225, 776
- (30) De Robertis, M. M., & Osterbrock, D. E. 1984, ApJ, 286, 171 (DRO84)
- (31) De Robertis, M. M., & Osterbrock, D. E. 1986a, ApJ, 301, 98
- (32) De Robertis, M. M., & Osterbrock, D. E. 1986b, ApJ, 301, 727 (DRO86)
- (33) De Zotti, G., & Gaskell, C. M. 1985, A&A, 147, 1
- (34) Diaz, A. I., Prieto, M. A., & Wamsteker, W. 1988, A&A, 195, 53
- (35) Dopita, M. A., & Sutherland, R. S. 1995, ApJ, 455, 468
- (36) Durret, F., & Bergeron, J. 1988, A&AS, 75, 273
- (37) Efstathiou, A., & Rowan-Robinson, M. 1995, MNRAS, 273, 649
- (38) Espey, B. R. et al. 1994, ApJ, 434, 484
- (39) Evans, I., Koratkar, A., Allen, M., Dopita, M., & Tsvetanov, Z. 1999, ApJ, 521, 531
- (40) Fadda, D., Giuricin, G., Granato, G., & Vecchies, D. 1998, ApJ, 496, 117
- (41) Ferguson, J. W., Korista, K. T., Baldwin, J. A., & Ferland, G. J. 1997, ApJ, 487, 122
- (42) Ferland, G. J. 1996, Hazy: A Brief Introduction to Cloudy (Lexington; Univ. Kentucky Dept. Phys. Astron.)
- (43) Ferland, G. J., & Netzer, H. 1983, ApJ, 264, 105
- (44) Ferland, G. J., & Osterbrock, D. E. 1986, ApJ, 300, 658
- (45) Ferland, G. J., & Osterbrock, D. E. 1987, ApJ, 318, 145
- (46) Fillippenko, A. V. 1985, ApJ, 289, 475
- (47) Fillippenko, A. V., & Halpern, J. P. 1984, ApJ, 285, 458
- (48) Fillippenko, A. V., & Terlevich, R. 1992, ApJ, 397, L79
- (49) Fosbury, R. A. E., Mebold, U., Goss, W. M., & Dopita, M. A. 1978, MNRAS, 183, 549
- (50) Fosbury, R. A. E., & Sansom, A. E. 1983, MNRAS, 204, 1231
- (51) Giuricin, G., Mardirossian, F., & Mezzetti, M. 1995, ApJ, 446, 550
- (52) Glass, I. S. 1979, MNRAS, 186, 29
- (53) Glass, I. S. 1981, MNRAS, 197, 1067
- (54) Golev, V., Yankulova, I., Bonev, T., & Jockers, K. 1995, MNRAS, 273, 129
- (55) González Delgado, R. M., & Pérez, E. 1996, MNRAS, 281, 1105
- (56) Grevesse, N., & Anders. E. 1989, in AIP Conf. Proc. 183, Cosmic Abundance of Matter, ed. Waddington, C. J. (New York: AIP), 1
- (57) Grevesse, N., & Noels, A. 1993, in Origin & Evolution of the Elements, ed. Prantzos, N., Vangioni-Flam, E., & Casse, M. (Cambridge Univ. Press), 15
- (58) Heckman, T. M. 1980, A&A, 87, 152
- (59) Heckman, T. M. 1986, PASP, 98, 159
- (60) Heckman, T. M. 1995, ApJ, 446, 101
- (61) Heckman, T. M., & Balick, B. 1979, A&A, 79, 350
- (62) Heckman, T. M., Chambers, K. C., & Postman, M. 1992, ApJ, 391, 39
- (63) Heckman, T. M., Lebofsky, M. J., Rieke, G. H., & Van Breugel, W. 1983, ApJ, 272, 400
- (64) Ho, L. C., Filippenko, A. V., & Sargent, W. L. W. 1993, ApJ, 417, 63
- (65) Ho, L. C., Filippenko, A. V., & Sargent, W. L. W. 1996, ApJ, 462, 183
- (66) Ho, L. C., Filippenko, A. V., & Sargent, W. L. W. 1997a, ApJS, 112, 315
- (67) Ho, L. C., Filippenko, A. V., Sargent, W. L. W., & Peng, C. Y. 1997b, ApJS, 112, 391
- (68) Kaiser, M. E., Bradlew, L. D. II., Hutchings, J. B., Crenshaw, D. M., Gull, T. R., Kraemer, S. B., Nelson, C. H., Ruiz, J., & Weistrop, D. 2000, ApJ, 528, 260
- (69) Kemp, J. C., Rieke, G. H., Lebofsky, M. J., & Coyne, G. V. 1977, ApJ, 215, L107
- (70) Kollatschny, W., & Fricke, K. J. 1983, A&A, 125, 276
- (71) Korista, K. T., & Ferland, G. J. 1989, ApJ, 343, 678
- (72) Koski, A. T. 1978, ApJ, 223, 56
- (73) Koski, A. T., & Osterbrock, D. E. 1976, ApJ, 203, L49
- (74) Kraemer, S. B., Crenshaw, D. M., Filippenko, A. V., & Peterson, B. M. 1998, ApJ, 499, 719
- (75) Kraemer, S. B., Wu, C.-C., Crenshaw, D. M., & Harrington, J. P. 1994, ApJ, 435, 171
- (76) Kunth, D., & Sargent, W. L. W. 1979, A&A, 76, 50
- (77) Kwan, J., & Krolik, J. H. 1981, ApJ, 250, 478
- (78) Lípari, S., Tsvetanov, Z., & Macchetto F. 1993, ApJ, 405, 186
- (79) McLaren, R. A., Maza, J., McAlary, C. W., & McGonegal, R. J. 1983, ApJS, 52, 341
- (80) Moore, D., & Cohen, R. D. 1996, ApJ, 470, 301
- (81) Morris, S. L., & Ward, M. J. 1988, MNRAS, 230, 639
- (82) Moshir, M., et al. 1992, Explanatory Supplement to the IRAS Faint Source Survey (Version 2, JPL-D-10015 8/92; Pasadena: JPL)
- (83) Murayama, T. 1998, Doctor’s thesis, Tohoku Univ.
- (84) Murayama, T., Mouri, H., & Taniguchi, Y. 2000, ApJ, 528, 179
- (85) Murayama, T., & Taniguchi, Y. 1998a, ApJ, 497, L9
- (86) Murayama, T., & Taniguchi, Y. 1998b, ApJ, 503, L115
- (87) Murayama, T., Taniguchi, Y., & Iwasawa, K. 1998, AJ, 115, 460
- (88) Nagao, T., Murayama, T., & Taniguchi, Y. 2000a, ApJ, 545, in press (astro-ph/0008006)
- (89) Nagao, T., Murayama, T., Taniguchi, Y., & Yoshida, M. 2000b, AJ, 119, 620
- (90) Nagao, T., Taniguchi, Y., & Murayama, T. 2000c, AJ, 119, 2605
- (91) Nelson, C. H., Weistrop, D., Hutching, J.B., Crenshaw, D. M., Gull, T. R., Kaiser, M. E., Kraemer, S. B., & Lindler, D. 2000, ApJ, 531, 257
- (92) O’Connell, R. W., & Kingham, K. A. 1978, PASP, 90, 244
- (93) Osterbrock, D. E. 1977, ApJ, 215, 733
- (94) Osterbrock, D. E. 1981, ApJ, 246, 696
- (95) Osterbrock, D. E. 1985, PASP, 97, 25
- (96) Osterbrock, D. E. 1993, ApJ, 404, 551
- (97) Osterbrock, D. E., Koski, A. T., & Phillips, M. M. 1976, ApJ, 206, 898
- (98) Osterbrock, D. E., & Pogge, R. W. 1985, ApJ, 297, 166
- (99) Pelat, D., Fosbury R. A. E., & Alloin, D. 1981, MNRAS, 195, 787
- (100) Phillips, M. M. 1978, ApJ, 226, 736
- (101) Phillips, M. M., Charles, P. A., & Baldwin, J. A. 1983, ApJ, 266, 485
- (102) Phillips, M. M., & Frogel, J. A. 1980, ApJ, 235, 761
- (103) Pier, E. A., & Krolik, J. H. 1992, ApJ, 401, 99
- (104) Pier, E. A., & Voit, G. M. 1995, ApJ, 450, 628
- (105) Press, W. H., Teukolsky, S. A., Vetterling, W. T., & Flannery, B. P. 1988, Numerical Recipes in C (Cambridge University Press)
- (106) Reynolds, C. S., Ward, M. J., Fabian, A. C., & Celotti, A. 1997, MNRAS, 291, 403
- (107) Rieke, G. H. 1978, ApJ, 226, 550
- (108) Rieke, G. H., & Low, F. J. 1972, ApJ, 176, L95
- (109) Rodríguez-Ardia, A., Pastoriza, M. G., & Donzelli, C. J. 2000, ApJS, 126, 63
- (110) Rudy, R. J., Levan, P. D., & Rodríguez-Espinosa, J. M. 1982, AJ, 87, 598
- (111) Schmitt, H. R. 1998, ApJ, 506. 647
- (112) Schmitt, H. R., & Kinney, A. L. 1996, ApJ, 463, 498
- (113) Shuder, J. M. 1980, ApJ, 240, 32
- (114) Shuder, J. M. 1981, ApJ, 244, 12
- (115) Shuder, J. M., & Osterbrock, D. E. 1981, ApJ, 250, 55
- (116) Stauffer, J., Schild, R., & Keel, W. 1983, ApJ, 270, 465
- (117) Stein, W. A., & Weedman, D. W. 1976, ApJ, 205, 44
- (118) Stephens, S. A. 1989, AJ, 97, 10
- (119) Sulentic, J. W., Zwitter, T., Marziani, P., & Dultzin-Hacyan, D. 2000, ApJ, 536, L5
- (120) Taniguchi, Y., Shioya, Y., & Murayama, T. 2000, AJ, 120, 1265
- (121) Terlevich, R., Melnick, J., Masegosa, J., Moles, M., & Copetti, M. V. F. 1991, A&AS, 91, 285
- (122) Ulrich, M. -H., & Péquignot, D. 1980, ApJ, 238, 45
- (123) Vaughan, S., Reeves, J., Warwick, R., & Edelson, R. 1999, MNRAS, 309, 113
- (124) Véron-Cetty, M. -P., & Véron, P. 1998, ESO Sci. Rept. No.18 (European Southern Observatory)
- (125) Viegas-Aldrovandi, S. M., & Gruenwald, R. B. 1988, ApJ, 324, 683
- (126) Ward, M., Penston, M. V., Blades, J. C., & Turtle, A. J. 1980, MNRAS, 193, 563
- (127) Wilson, A. S., Binette, L., & Storchi-Bergmann, T. 1997, ApJ, 482, L131
- (128) Winkler, H. 1992, MNRAS, 257, 677
- (129) Yee, H. K. C. 1980, ApJ, 241, 894
- (130) Zamorano, J., Gallego, J., Rego, M., Vitores, A. G., & Gonzalez-Riestra, R. 1992, AJ, 104, 1000