Period–Luminosity–Colour distribution and classification of Galactic oxygen–rich LPVs††thanks: Based on data from the HIPPARCOS astrometry satellite.
Abstract
The kinematic and Period–Luminosity–Colour distribution of O-rich Long-Period Variable stars of the solar neighbourhood is interpreted in terms of pulsation modes, masses and metallicities. It is first shown that, because of input physics imperfections, the periods and mean colours derived from the existing linear and nonlinear nonadiabatic models must significantly depart from the actual behaviour of the stars. As a consequence systematic corrections have to be applied, as a first approximation, to our linear model grid. These free parameters, as well as the mixing length, are calibrated on the LPVs of the LMC and of some globular clusters, assuming a mean mass of for the LMC Mira-like stars. Then, the masses and metallicities corresponding to the four kinematic/photometric populations of local LPVs are evaluated. The possibility of a varying mixing-length parameter is discussed and taken into account. Stars of the old disk appear pulsating in the fundamental mode : one group, mainly composed of Miras, has mean mass and mean metallicity , both strongly increasing with the period ; a second group, slightly older and mainly composed of SRb’s, has and . Stars of the thin disk appear pulsating in the first and second overtones, with , and . Stars of the extended disk/halo appear pulsating in the fundamental mode, with and . The mixing-length parameter probably decreases along the AGB by no more than 15 % per magnitude. The large, positive period corrections (more than 30 % for the fundamental and 8 % for the first overtone) that have to be applied to the LNA models used in this study do not seem to be explained by imperfect sub-photospheric physics alone, especially when nonlinear effects are taken into account. The origin of the extra period increase (at least 15 % for the fundamental mode) may be the stellar wind, which was neglected by all pulsation codes up to now.
Key Words.:
Stars: variables: Long Period Variables – AGB – fundamental parameters – oscillations1 Introduction
Among the most important and still unsolved issues concerning Long-Period Variable stars (LPV) are the modelling of their pulsation and even the mere identity of the predominant pulsation mode. Linear nonadiabatic (LNA) models are currently used on a wide scale for reasons of simplicity. Relying on LNA relations between the period and the fundamental parameters, and on dynamical models of the photospheric region, the pulsation mode of Mira stars is the fundamental according to the observed velocity amplitude (Hill & Willson 1979, Willson 1982, Bowen 1988, Wood 1990), and the first overtone according to the angular diameter estimates (Haniff et al. 1995, Van Leeuwen et al. 1997), pulsation accelerations (Tuchman 1991) and the PL distribution of globular cluster stars (Feast 1996). One study based on the periods and luminosities of LPVs of the Large Magellanic Cloud (LMC) concluded that Miras were pulsating in the fundamental mode and low-amplitude semi-regulars on the first or second overtone (Wood & Sebo 1996). However, another study, also taking into account a few Miras of the solar neighbourhood and various temperature estimates, supported the first overtone in a majority of Miras (Barthès 1998). Last, still relying on LNA models, Barthès & Tuchman (1994) and Barthès & Mattei (1997) found that the Fourier spectra of a few Miras were more easily explained than were the stars pulsating on the first overtone with the fundamental mode and other overtones also acting.
In fact, the large pulsation amplitude and the complexity of the chemistry and radiative transfer in the photospheric region make the mean effective temperature and radius very uncertain, even for nearby stars (Bessell et al. 1989a, 1996 ; Hofmann et al. 1998 ; Ya’ari & Tuchman 1998). The Hipparcos parallaxes, too, usually have large error bars, and they concern only about two dozen Miras.
Last, most of these studies suffered from
a strong sampling bias, favouring periods longer than 250 days, especially
those ranging from 300 to 400 days.
On the other hand, hydrodynamical models predict that, after thermal
relaxation, Miras pulsate in the fundamental mode with a period either much
shorter than (Ya’ari & Tuchman 1996, 1999) or very close to (Wood 1995,
Bessell et al. 1996, Hofmann et al. 1998) the LNA period. These models mainly
differ by their handling of the convective energy transport and of the
equation of state, but they share the same unrealistic assumption : no wind
and no extended circumstellar envelope at the outer boundary. As a
consequence, the reliability of both the nonlinear and linear nonadiabatic
pulsation models is uncertain, and the pulsation mode is still ambiguous.
An unfortunate result of these theoretical difficulties is that the present
masses and metallicities of the LPVs have always been very uncertain.
Indeed, no direct estimate of mass in binary systems has been possible up to
now, and the chemistry and radiative transfer in the photospheric region are
so complex that no reliable metallicity has been derived.
This paper mainly consists in exploiting the classification (based on kinematic and photometric criteria) and the period–luminosity–colour (PLC) distributions of the Oxygen-rich LPVs of the solar neighbourhood, which were determined in Paper I of this series (Barthès et al. 1999). Its aims are to assess the pulsation models, and to identify the predominant mode and estimate the average mass and metallicity for each kinematic/photometric group.
The data sets are presented in Sect. 2. They include the results of Paper I, i.e. the periods, absorption-corrected absolute magnitudes and de-reddened colours of a sample of stars observed by Hipparcos, but also the de-biased distributions of the four kinematic/photometric groups to which they belong. LPVs found in the LMC and in various globular clusters are also included, with a view to calibrating the free parameters of the models.
Sect. 3 describes the pulsation models to which these data will be confronted : the linear nonadiabatic modelling code and the adopted temperature scale, i.e. colour–temperature–metallicity (CTZ) relations. Sect. 4 then explains the difficulties to be expected because of the physical approximations of the models, and also because of the nonlinear shape of the CTZ relations. We will be led to introduce some systematic correction parameters for the periods and colours.
These free parameters, together with the mixing length, are calibrated in Sect. 5 by confronting the models with the PLC distributions of the LPVs in the LMC and globular clusters. The so-calibrated models are then confronted with the PLC distribution of local stars in Sect. 6, and the pulsation mode, mass and metallicity are derived for each kinematic/photometric group. Finally, the stability and reliability of the results, as well as their consequences concerning the existing pulsation codes, are assessed in Sect. 7.
2 Data
2.1 Solar neighbourhood
Paper I has provided us with the mean absolute magnitudes and indices of about 350 M-type LPVs of the solar neighbourhood. For about 250 stars, is available. The magnitude is known to closely mimic the behaviour of bolometric magnitude. Moreover, as mentioned in Paper I, simple simulations of light curves have shown that the mean magnitude and the magnitude corresponding to the mean flux agree with one another to within a few percent (0.06 mag for a full amplitude of 1 mag). The adopted magnitude is thus a good representative of the actual mean luminosity of each star. We must recall however, that, because of the paucity of the data, which were taken at arbitrary phases, the observational error on is 0.25–0.50 mag.
The mean index was defined in Paper I as the difference between the midpoint magnitude and the mean magnitude. Simulations have shown that the midpoint value of is systematically larger than the mean by, usually, only a few hundredths of mag, or at the very most a few tenths. On the other hand, the magnitudes at minimum brightness tend to be underestimated by visual observers. However, this systematic error (a few tenths of mag ; the half for the mean) depends altogether on the distance, the mean absolute magnitude and the amplitude (which is correlated to the brightness, but with an important scatter). Thus, globally over the sample of stars and the subsamples defined in Paper I, the systematic error on should not exceed mag and thus may be neglected. Besides, the random error is about 0.3 mag. Summarizing, the data used in Paper I are subject to a random error of about 0.5 mag.
The luminosity calibrations performed in that paper led us to identify four groups, differing by their kinematics and/or luminosity :
- Group 1:
-
mainly composed of Mira stars (84%), with a kinematics corresponding to old disk stars ;
- Group 2:
-
mainly composed of SRb stars (56%), also with old disk kinematics ;
- Group 3:
-
mainly composed by SRb stars (82%), with a younger kinematics ;
- Group 4:
-
a small group (14 stars, including 13 Miras) with a kinematics corresponding to extended-disk or halo stars.
The calibration procedure also provided us with the de-biased distributions
of the populations corresponding to these groups. As explained in Paper I,
the overall error bars of their parameters were computed by means of many
Monte-Carlo simulations, taking into account the above-mentioned photometric
errors, the astrometric ones and those of the radial velocities.
Concerning the barycenters of these distributions (i.e. the population
means), the uncertainties are :
about 0.1 mag (Groups 1, 2 & 3) or 0.25 (Group 4) for ; about
0.05 (Groups 1 & 2), 0.08 (Group 3) or 0.1 (Group 4) for .
Last, it must also be mentioned that, for a minor but significant proportion of semi-regular stars, the periods may by erroneous by as much as a factor of 2, either because there are few data and/or we could not check them (see Paper I), or because the light curves and/or Fourier spectra are ambiguous (two or three large-amplitude pseudo-periodicities liable to correspond to a mode – see Mattei et al. [1997]). This means that the period scattering in the groups including a large proportion of semi-regulars (i.e. Groups 2 and 3) is probably overestimated. Here again, the population mean should remain nearly unaffected.
2.2 Globular cluster stars
For oxygen-rich LPV stars belonging to globular clusters (GC) of our Galaxy, periods, mean absolute bolometric magnitudes (derived from blackbody fits to mean, de-reddened data) and mean index values have been found in Whitelock (1986) and Feast (1996). The precision is about 0.1–0.3 mag according to the amplitude and data sampling. That for is 0.03–0.15 as explained above, but most often .
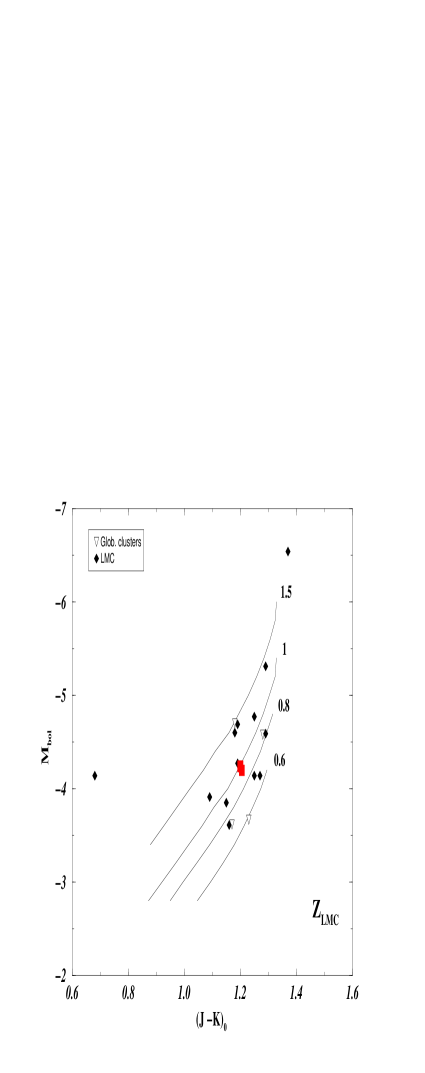
2.3 LMC stars
As hundreds of O-rich Mira-like stars (i.e. LPVs with mag) have been observed in the Large Magellanic Cloud, we will handle them in a synthetic way, by considering their mean Period-Luminosity () and Period-Colour () relations, the scattering about it, and the barycenter of this population. The latter is defined by the mean period, already computed by Reid et al. (1995) and the corresponding mean bolometric magnitude and colour. The PL and PC relations were taken from Feast et al. (1989) and Hughes & Wood (1990) and hold as long as days. Due to the large number of stars, the error bars of the barycenter may be neglected.
We have also derived from Wood & Sebo (1996) mean magnitudes and colours of O-rich LPVs found near a few clusters of the LMC (2 data points per star, taken at arbitrary phases). The magnitudes were then converted into bolometric ones by applying the empirical bolometric correction given by Bessell & Wood (1984). The obtained precision, including intrinsic variability effects, should be roughly 0.3 mag for and for . Two thirds of these stars are obviously pulsating on a higher-order mode than the Mira-like population, since they form a second, parallel strip in the PL plane. That is why we included this sample among the LMC data.
Last, magnitudes and periods of hundreds of pseudoperiodic red variables belonging to the MACHO sample have been found in Wood (1999). Being single-phase observations, these data represent the mean magnitude within about 0.3–0.5 mag. On the other hand, the periods of these stars are secure, since they were derived from MACHO light curves spanning years.
3 Modelling
3.1 LNA pulsation models
The AGB linear nonadiabatic (LNA) pulsation models used in this study are based on the code of Tuchman et al. (1978), modified as explained in Barthès & Tuchman (1994). The equation of state (EOS) includes the radiation and an ideal gas of e-, H2, H, H, H-, H+, He, He+ and He++, as well as a few heavy elements, while abundances are determined by solving the Saha equation. Convection is treated according to the mixing-length formalism of Cox & Giuli (1968), with instantaneous adjustment to pulsation. Recent opacity tables, assuming solar composition and including molecules at low temperature, namely OPAL92 and Alexander (1992) [see Alexander & Ferguson 1994], are used.
The grid of models assumes and covers metallicities and
0.001, masses ranging from 0.8 to 2 , luminosities ranging from 1000
to possibly 50000 , and three values of the mixing–length
parameter : , 1.5 and 2. Then, a log-linear least-squares fit
(excluding the extreme luminosities where isomass lines would turn back)
gives us theoretical relations between the effective temperature or pulsation
mode periods on the one hand, and the mass, metallicity, luminosity and
mixing-length parameter on the other (MLZT and MLZP
relations). Between and 3, the extrapolated periods and effective
temperatures are precise within 1–2 %.


b. The same for . The empirical non-LPV relation (dashed line) is from Bessell et al. (1983).
3.2 Temperature scale and bolometric correction
Comparison between the theoretical models and observational data requires one to convert effective temperatures into or indices.
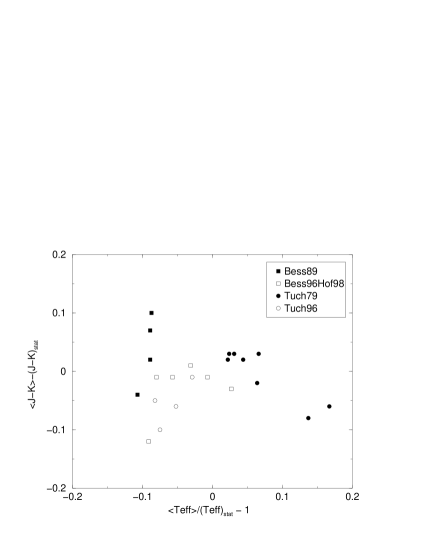
Bessell et al. (1989a, 1996) have computed dynamical models of Mira atmospheres with various fundamental parameters (but always solar metallicity) and derived many colour indices, including and , at various phases, thus various effective temperatures (up to 3770 K), gravities and atmospheric extensions. Recently, Bessell et al. (1998) have published broad-band colours derived from static models of giant star atmospheres for temperatures higher than 3600 K. Comparison with the older static models of Bessell et al. (1989b) (which were the basis of their dynamical models) shows that the recent ones are systematically redder by a few mag for and a few mag for in the small overlapping domain of temperature and gravity. This is due to differences in the opacities and their handling.
On the other hand, van Belle et al. (1999) have published an empirical relation between and (above 3030 K) derived from the interferometric angular diameters of 59 non-LPV giant stars (non-variable or with a very small amplitude). Similar work, extending to lower temperatures, was also performed by Perrin et al. (1998). Moreover, an empirical relation involving has been published by Bessell et al. (1983), again for non-LPV stars.
Considering the inconsistency of all these sources, there is no better way to
derive a colour–temperature (CT) relation for each colour index than to
perform a simple eyeball fit to the model data, as shown in Fig. 1. This
takes into account the above-mentioned dynamical models of Bessell et al.
(1989a, 1996), and the static models of Bessell et al. (1998) at gravities
, 0 and . Roughly, one may estimate that our empirical
relations are precise within 0.5 mag for and 0.05 for (subject to
possible systematic error due to the imperfect modelling of the molecular
lines).
Of course, it was necessary to correct the CT relations for intrinsic metallicity-dependence. The only information that we could find in the literature originated from static models. So, at temperatures K, we applied a parabolic {, (colour)} fit and a series of linear {, (colour)} interpolations to the models XX, X, Y and YY of Bessell et al. (1989b). They correspond respectively to , 0, and , and to evolving from to as the temperature increases, so as to mimic the AGB. At K, we proceeded in the same way with the models listed in Table 5 of Bessell et al. (1998), while extrapolating the gravity sequence initiated by the models of Bessell et al. (1989b).
Around 3480 K, the {, , } relation resulting from
Bessell et al. (1989b) exhibits a crossing-over that appears only around 3800
K in the Bessell et al. (1998) models. As a consequence, the correction
was simply interpolated between 3350 and 3600 K, without considering the
intermediate model data. This does not concern .
On the other hand, wherever necessary (see Sect. 6), we have converted the theoretical bolometric magnitudes into magnitudes, by subtracting the the empirical bolometric correction given by Bessell & Wood (1984). The used is, of course, the value derived from the model temperature.
4 Is theory directly comparable to observations ?
Comparing theoretical models with observational data, with a view to calibrating the internal parameters of the theory and to deriving physical information on the stars (e.g. the pulsation mode and the fundamental parameters) does not make sense if the models are basically wrong or if their predictions are systematically shifted because of imperfections of their input physics. We thus have to assess the reliability of the model grid, including the temperature scale, and to find a way to (partially) compensate its defects.
4.1 Static/LNA modelling
First, one may remember that the core mass–luminosity relation (CMLR) assumed in our calculations corresponds to maximum hydrogen shell luminosity (Paczyński 1970). In fact, even neglecting the very short helium flashes, the luminosity varies by a factor of two over a thermal pulse cycle, and the CMLR approximately holds over only about 25 % of the interflash time (Boothroyd & Sackman 1988a, 1988b ; Wagenhuber & Tuchman 1996). For a global investigation of our sample of stars, we would perhaps do better adopt an ”effective” CMLR that would be, say, 30 % less luminous. Doing so, at given total mass and luminosity, the effective temperature becomes 1 % higher, and the period decreases by a few %.
Our calculations also assume that the convective flux and velocity instantly adjust themselves to pulsation, i.e. that the mean eddy lifetime is about zero. In fact, it is roughly a third of the fundamental period (Ostlie & Cox 1986), which induces a significant phase lag. In order to estimate the resulting uncertainty, we have recomputed some of our models while assuming a frozen-in convection, i.e. infinite eddy lifetime. The obtained fundamental periods are shorter by 5–10%, and the first overtone longer by 1–4%. In other terms, as long as convection phase lag is concerned, the fundamental periods predicted by our model grid are probably overestimated by roughly 5 %, while the first overtone is underestimated by perhaps 2 %.
On the other hand, Ostlie & Cox (1986) have attempted to improve the standard LNA modelling by a horizontal opacity averaging scheme, which accounts in a simplified way for the coexistence of rising and falling convective elements in the same mass shell. Periods then increase by less than 10 %. Moreover, the same authors have investigated the effects of turbulent pressure : the obtained period shifts range from to % for the fundamental mode and from to % for the first overtone. Turbulent viscosity and energy have negligible effects (Cox & Ostlie 1993).
Summarizing, one may expect the model grid described in Sect. 3 to
underestimate the fundamental period by as much as 40% for the fundamental
mode and 25% for the first overtone, and the relative shift of the latter
mode is always more than a third of the former.
It is worth noting that the often quoted models of Wood (Wood 1974, Fox & Wood 1982, Wood 1990, Bessell et al. 1996, Hofmann et al. 1998, Wood et al. 1999), which include a phase-lagged convection scheme, unfortunately use an outdated equation of state. As far as we know, this is the only important difference with Tuchman’s code. The EOS is thus probably the reason why Wood’s linear fundamental and first overtone periods are longer by 15–70% than the ones predicted by our models, with the same opacity tables and composition regardless of our treatment of convection111Wood’s periods increase much faster than ours with luminosity and metallicity. The relative shift is always about the same for the two modes. Interestingly, the fundamental period shift is the same order of magnitude as that wich would result from opacity averaging and turbulent pressure together. As a consequence, Wood’s fundamental pulsation models can often reach a reasonable agreement with the observations, but first overtone periods derived from this code are strongly overestimated, as also noted by Xiong et al. (1998).

4.2 Nonlinear effects
The periods of the pulsation modes predicted by LNA models correspond to small-amplitude oscillations of the static stellar envelope. The effective temperature, too, is that of the static star. In fact, the large-amplitude pulsation of an LPV is strongly nonlinear and makes the outer envelope expand. As a consequence, the mean value of the effective temperature, as well as the periods and growth-rates of the pulsation modes, do not necessarily equal the values given by a linear model of the same star.
According to the various hydrodynamical calculations performed up to now (Wood 1974, Tuchman et al. 1979, Perl & Tuchman 1990, Tuchman 1991, Ya’ari & Tuchman 1996 & 1999, Bessell et al. 1996) the static effective temperature may differ from the mean of the corresponding pulsating star by plus or minus 1–5 %.
On the other hand, some recent calculations (Ya’ari & Tuchman 1996, 1999) have shown that the period of the nonlinear fundamental mode may, after thermal relaxation, be shorter than the LNA value by as much as 35% (depending, at least, on the luminosity). But models based on Wood’s code (Wood 1995, Bessell et al. 1996, Hofmann et al. 1998) predict only a small increase of the fundamental period, even after spontaneous thermal relaxation (models P, M and O of Hofmann et al. [1998]). As stated above, the main difference between these two families of models are the treatment of time-dependent convection and the equation of state, which both have important thermal effects. As phase-lagged convection tends to increase the nonadiabaticity of the pulsation, it is likely that the EOS is the main cause of the more ”quiet” behaviour of Wood’s models (as long as the numerical scheme is not at stake).

4.3 Outer boundary
Ya’ari & Tuchman (1996) report that their nonlinear results appear basically insensitive to the various outer boundary conditions that they have tried. However, all abovementioned models neglect the fact that dust condensates in the levitating circumstellar layers and, as an effect of radiation pressure, generates a significant stellar wind, ranging from to yr for Miras and semi-regulars (Jura 1986, Jura 1988, Jura et al. 1993, Kerschbaum & Hron 1992). The physics of this phenomenon was extensively described by Fleischer et al. (1992) and Höfner & Dorfi (1997).
Due to the extension of the envelope, the outgoing waves are only partially reflected in the photospheric region, and this does not occur at a fixed level but at the sonic point, which depends on the wind. Pijpers (1993) has shown, in the case of polytropic AGB star models, that the adiabatic fundamental period may increase by more than a factor 5 if a mass-loss rate of /yr is assumed. It would be surprising if such a large shift of the adiabatic periods had no effect on the nonadiabatic ones. Even though polytropic models are just a rough aproximation, one may also expect some effects of this kind in real stars.
4.4 Temperature scale
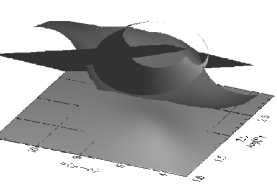
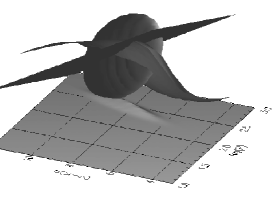
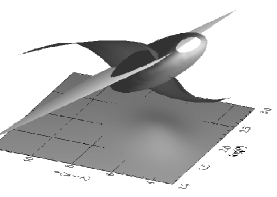
The nonlinear shape of the temperature–colour relations is another source of difficulty : it may generate a significant mismatch between the mean colour index and the colour corresponding to the mean temperature, depending on the latter and on the pulsation amplitude.
It is thus clear that a linear model having the fundamental parameters of a given LPV (in particular its static temperature), the correct mixing length, and predicting the correct period, will nevertheless disagree with the observed colours by a significant amount. In order to estimate the overall colour mismatch (, ) that may be expected we have applied the above-defined temperature–colour relations to simulated temperature oscillations based on the dynamical models of Tuchman et al. (1979), Bessell et al. (1989), Bessell et al. (1996), Ya’ari & Tuchman (1996) and Hofman et al. (1998), which have very diverse fundamental parameters and amplitudes (usually 1 , but up to 6 in Tuchman et al. [1979] ; 1800–35000 ; 2250–3500 K [static] ; 15–40 ). The results are shown in Fig. 2. The mean shifts and standard deviations are and 0.95 for (but 4/5 of the models lie within 0.7 of the mean), and and 0.05 for . No obvious correlation with any fundamental parameter or with the pulsation period or amplitude was found. It is likely that the colour mismatch depends on a non-trivial combination of these parameters.
4.5 Consequences
All this discussion leads us to conclude that no linear model grid can be expected to directly fit the observations, and that the existing nonlinear models are not yet able to provide a reliable grid, or even an a priori correction of the linear models. As a consequence, linear models must be complemented by additional free parameters, to be added prior to comparison with the observations. As a first-order approximation, these parameters can be some systematic corrections of the colour ( or ) and, for each pulsation mode, of the period (). Before trying to interpret the results of Paper I, these parameters and the mixing length have to be calibrated by fitting the models to independent data, namely the LPVs observed in globular clusters and in the LMC.
5 Models calibration : clusters and LMC stars
The sample of globular cluster stars can be divided in three sets : one with
the metallicity of the LMC () ; a second one with about the
metallicity of the SMC () ; and the last one with
.
Only the two first sets (hereafter called LMC-like and SMC-like) will be
used, because the adopted log-linear model fit and colour–temperature
relation are no longer reliable at very low metallicities and masses. In
fact, each set may be divided in two sub-sets, obviously corresponding to two
different pulsation modes (they are well separated in the PL and PC planes,
see Fig. 5). Each set will be represented by two points, namely the
barycenters (mean periods, magnitudes and colours) of its two
sub-sets222The calculation of the means excludes one SMC-like star
lying right in between the two subsets, and three outlying LMC-like stars.
This facilitates the model fitting, reduces the observational error bars
down to low levels ( on ), and reduces the possible effects
of the scattering of down to .
In fact, there are only four stars in LMC-like globular clusters. We thus
prefered to merge them with the sets of LMC stars (i.e. two with the
Mira-like stars and two with the higher-order pulsators).
As an additional constraint, we assume that the mean mass of the Mira-like population of the LMC is 1 . This ensures that, whatever the choice of the free parameters, the masses of the sample LPVs of the LMC do not exceed 1.5 , consistent with the evolutionary calculations (Wood & Sebo 1996). Then, for every value of , the theoretical MLZT and MLZP relations give us the single possible value of and of . The pulsation mode that gives the better fit to Mira-like stars is always the fundamental.
Then, keeping the three parameters unchanged, we obtain two masses for the barycenter of the SMC-like subset corresponding to the fundamental mode : one derived from the period, the other from the colour. The calibration thus consists in minimizing the difference of these two masses. As shown in Fig. 3, the mass discrepancy decreases as the period (and colour) shift increases. The model fit starts being acceptable () at . The mean colour shift derived from the dynamical models (Fig. 2), viz. and thus and , gives a reasonable fit : . We adopt this solution, for which the most probable value of is already known (, of course, i.e. the mean of the a priori estimates of Sect. 4). Indeed, considering all uncertainties (especially concerning and the CTZ relation) as well as the lack of solid theoretical ground, it would make little sense to look for an exact agreement of the masses by further increasing the correction parameters (see Sect. 7 for further discussion).
As a last step, we can now determine the period correction of the first overtone, which must ensure that consistent masses are obtained from the MLZT and MLZP relations at the barycenters of the subsets corresponding to this mode. We obtain , with negligible mass discrepancies.
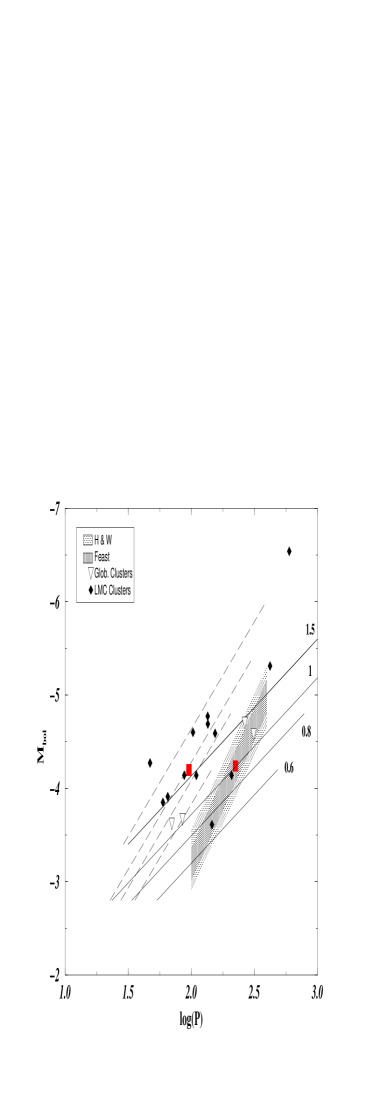
The so-calibrated model grid is represented in Figs. 4 & 5 by a series of
isomass lines (0.6, 0.8, 1 and 1.5 ). The results of this
calibration are summarized in the upper-left quarter of Table 1. Let us
however recall that masses as low as 0.6 are probably slightly
underestimated by the log-linear fit scheme.
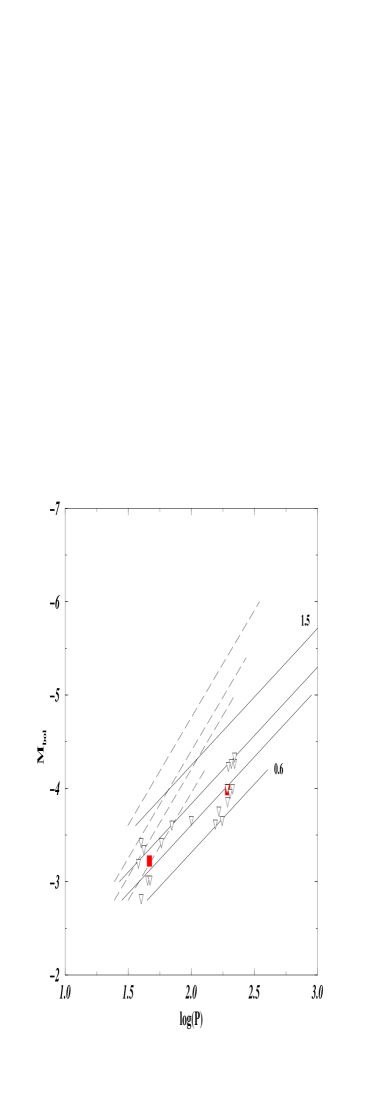
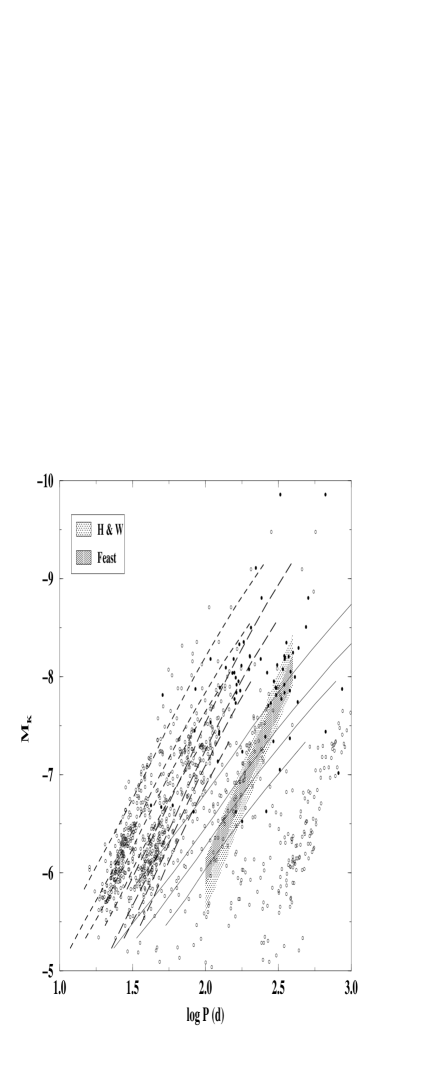
The likelihood of the calibrated model grid can be checked by confronting it
to the magnitudes and periods of the MACHO sample of Wood (1999).
As can be seen in Fig. 6, the strip corresponding to Mira-like stars
still fits the fundamental mode, with mean mass 1 . The strip
immediately on its left fits the first overtone. Last, a third strip obviously
corresponds to the second overtone. We could not calibrate its correction
parameter but, having noticed that , we adopted .
Our interpretation is consistent with that of Wood et al. (1999) and
Wood (1999), who also considered the stars lying on the right of the figure
as probable binaries or stars pulsating on a thermal mode coupled to the
fundamental.
| Mode | Mode | ||||||
| LMC (Mira-like) | F | 0.008 | 1.00 | F | idem | idem | |
| LMC | 1ov | 0.008 | 0.95 | 1ov | idem | 0.95 | |
| GC | F | 0.004 | 0.8 | F | idem | 0.75 | |
| GC | 1ov | 0.004 | 0.6 | 1ov | idem | 0.5 | |
| Group 1 pop. | F | 0.020 | 0.9 | F | 0.020 | 0.9 | |
| sample | F | 0.04 | 1.7 | F | 0.024 | 1.85 | |
| Group 2 pop. | F | 0.027 | 0.95 | F | 0.07 | 0.85 | |
| sample | F | 0.035 | 1.2 | F | 0.05 | 1.1 | |
| Group 3 pop. | 1ov | 0.04 | 1.1 | 1ov | 0.07 | 1.0 | |
| 2ov | 0.04 | 0.75a | — | — | — | ||
| Group 4 pop. | F | 0.009 | 1.1 | F | 0.010 | 1.1 | |
| sample | F | 0.014 | 1.65 | F | 0.010 | 1.7 | |
| a Lower boundary. | |||||||
6 Application to the solar neighbourhood
Having fully calibrated the models, we can now investigate the results of
Paper I, i.e. the four de-biased PLC distributions of the local LPVs and the
calibrated and de-biased individual data (sample stars). For the sake of
clarity, members of the old disk (Groups 1 & 2 as defined in Paper I),
thin-disk (Group 3) and exended-disk/halo (Group 4) populations will be
separately investigated. Mathematically speaking, the work to be done consists
in determining the pulsation mode, mass and metallicity corresponding to the
barycenter of the de-biased distribution of each group, by solving the
MLZT and MLZP equations with the above-calibrated free
parameters.
At each barycenter, the absolute magnitude was converted into the
bolometric one by applying the bolometric correction defined in Sect. 3.2.,
using the corresponding . Then, the period and colour correction
parameters ( or 0.056 and ) were
subtracted from the data points before solving the two equations. It must be
mentioned, however, that Figures 7 through 11 were plotted keeping the
observations unchanged, i.e. using magnitudes. We thus applied to the
models bolometric corrections that were deduced from the theoretical
after adding . The results are detailed in the next subsections
and summarized in the left-hand part of Table 1. The isomass lines in the
figures correspond to 0.8, 1 and 1.5 .
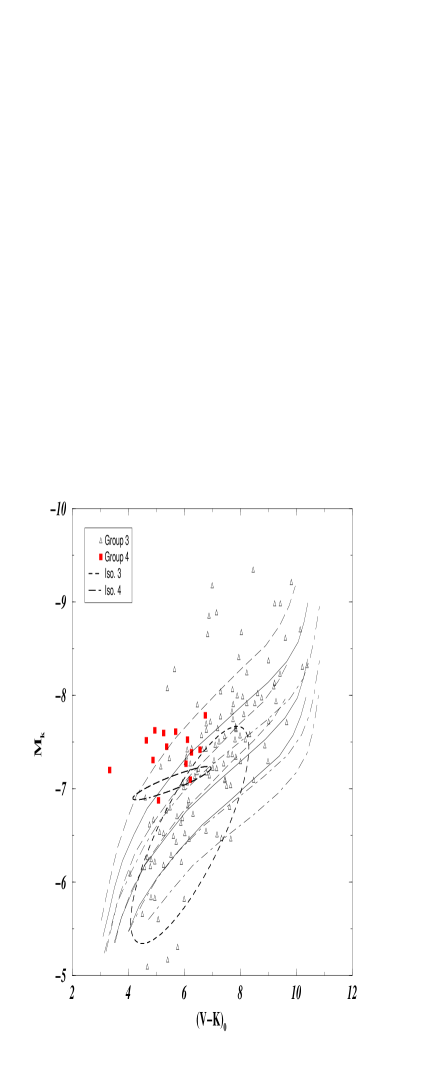
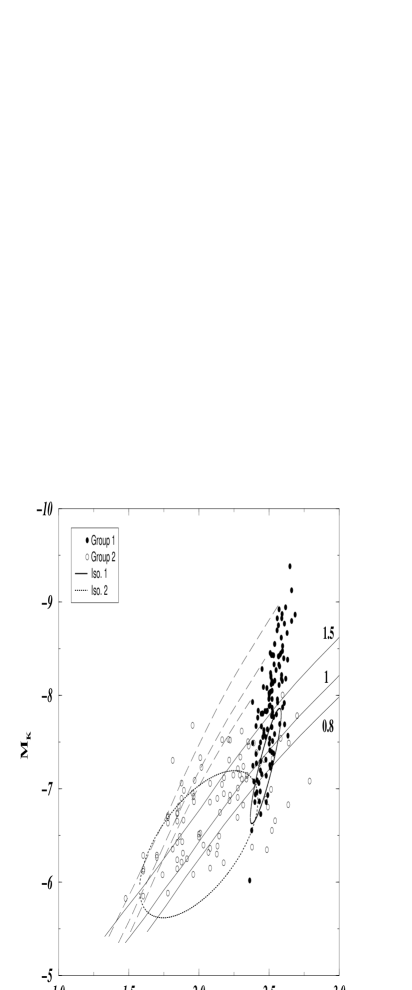
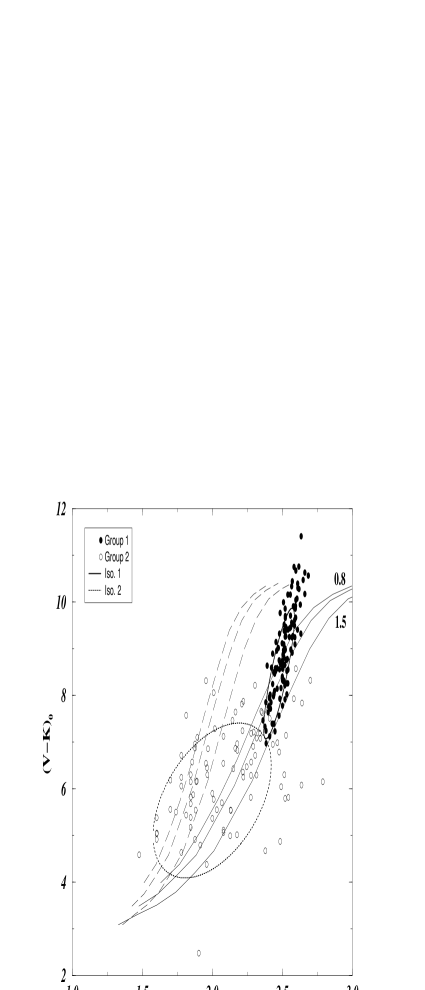
The de-biased 3D distribution of each Group, shown in Fig. 7, appears as a quasi-elipsoidal volume containing 60 % of the population. In the three fundamental planes, it is represented by a quasi-elliptical contour which is the projection of the elliptical iso-probability contour defined in the main symmetry plane (see Paper I). Then, the pulsation mode and the mean mass and metallicity are given by the barycenter of the de-biased distribution, i.e. the center of the “ellipsoid” or “ellipse” : if the models have been well calibrated and if their adopted metallicity equals the actual population mean, the surface corresponding to one theoretical mode in the 3D diagram must include the barycenter. In the three 2D figures, this point must lie on the same iso-mass line, which property was used above for calibrating the models. Another advantage of working on the barycenter is that we avoid the projection effects that occur when the “ellipsoid” crosses the single-mode single-metallicity PLC surfaces with a high incidence.
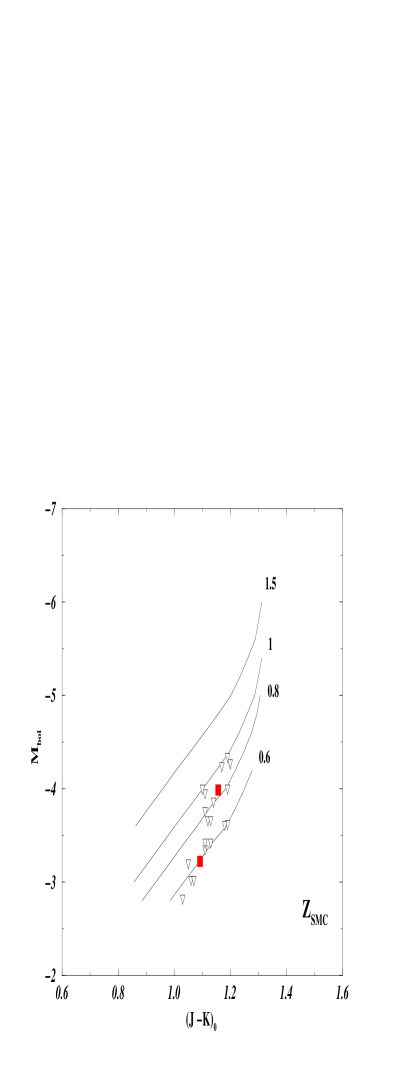
Right: The same for clusters with LMC-like metallicity and for the barycenter of the Mira-like population of the LMC with d ; assumed.
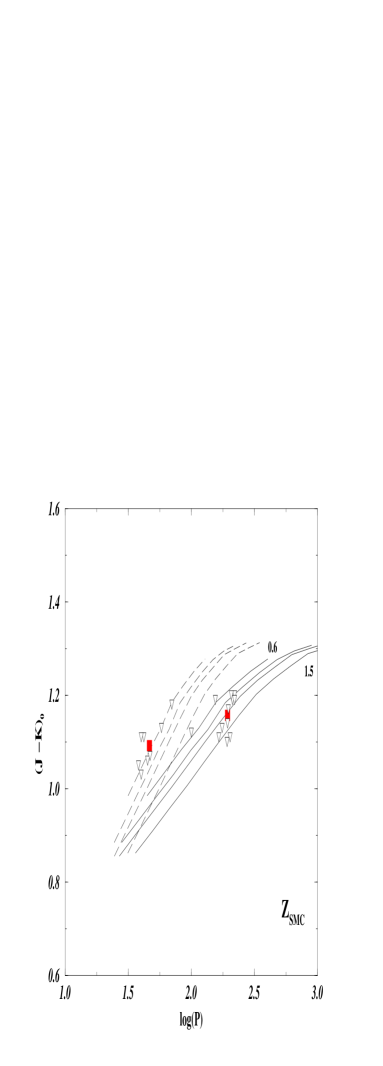
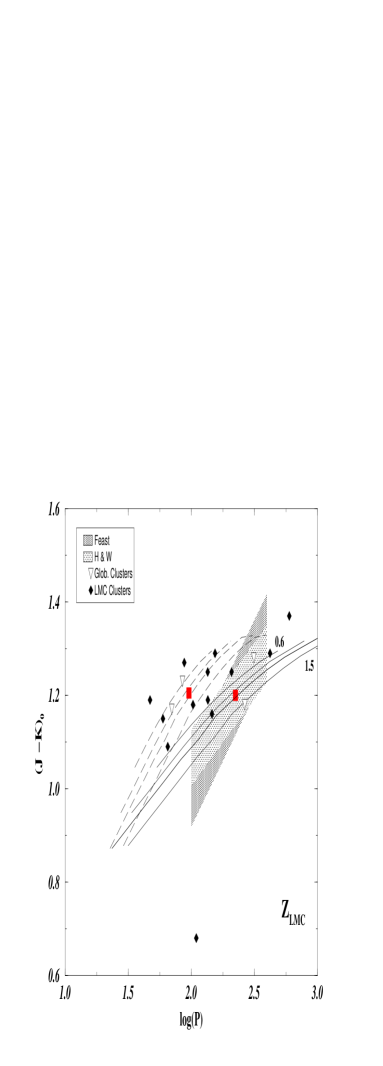
Left: SMC-like metallicity. Right: LMC-like metallicity. The superimposed linear strips correspond to the whole Mira-like population of the LMC with d : mean PL and PC relations (and the standard deviations about them) given by Feast et al. (1989) and Hughes & Wood (1990).
6.1 Old disk stars
For Group 1, the only possible pulsation mode is the fundamental. The metallicity is and the mass 0.9 . On the other hand, Group 2 pulsates on the same mode, but with and .
As in the preceding section, a careful look at the PL and LC diagrams on the one hand and the PC on the other, shows a contradiction if a single metallicity is assumed within Group 1. Indeed, when increasing the period and colour, the mass decreases in the latter plane, while it increases in the two former. This is the 2D translation of the fact that, in 3D, the main symmetry plane of the population is much inclined with respect to the single- single-mode theoretical surfaces. If is supposed to increase by any reasonable amount with the period, the problem is only slightly attenuated. If too is assumed to depend on the period, then it has to reach about at the top of the Group 1 sample. This is at the limit of (or exceeds) the a priori estimates, which anyway exhibit no obvious correlation with the period (see Sect. 4 and Fig. 2). Therefore, complete explanation of the PLC distribution of Group 1 probably requires the metallicity to significantly increase with the period. The mass, too, must strongly increase with the period (even if only the colour shift is invoked). Actually, if the correction parameters are kept unchanged, a metallicity of 0.04 is found at the barycenter of the Group 1 sample, together with a mass of 1.7 . Concerning the Group 2 sample, the metallicity (0.035) differs just a little from the population mean, and the mass is 1.2 .
6.2 Thin-disk stars
Group 3 stars cannot pulsate in the fundamental mode, since this would require . If we assume that they are pulsating on the first overtone, the mean mass and metallicity are and , which seems a bit too metallic for stars of the solar neighbourhood.
However, the MACHO sample (see Fig. 6) suggests that this group may be a mixture of first and second overtone pulsators. That is, the “ellipse” representing the population would, in fact, be a global fit to two steeper, less extended ones. Unfortunately, we were unable to separate these two sub-groups (modes) when doing the luminosity calibration, probably because of the paucity of the sample in view of the obervational error bars. We are thus deprived of any direct estimate of the barycenter of each overtone population. Nevertheless, we can use the MACHO sample as a guide to determine two points, typical of the first and second overtone pulsators of the Group 3 population. To this purpose, we first have to shift the MACHO sample by 0.1 magnitude (roughly corresponding to the luminosity and colour shifts involved by the metallicity difference between the LMC and our Galaxy), so that the Group 3 “ellipse” crosses the two bulges at the bottom of the PL strips, and the top-left limit of the Group 3 sample matches that of the MACHO data. Then the intersections of the strips with the de-biased period–luminosity relation defined by the “ellipse” can be picked out. They are found around and 1.85. The corresponding colours are given by the PLC relation found in Paper I. The models fit these points with and for the first overtone pulsators, and the same metallicity but for the second overtone. The latter value is, in fact, a lower boundary of the mean mass, since the adopted point lies at the bottom edge of the second overtone population.
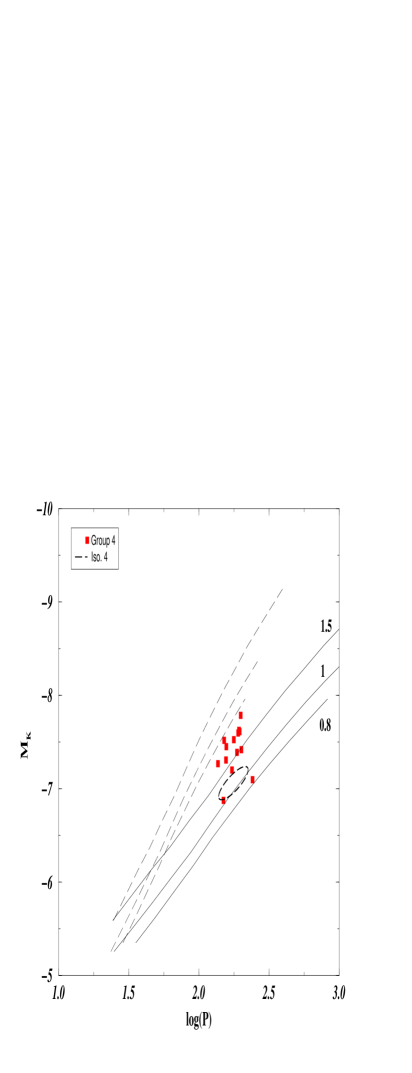
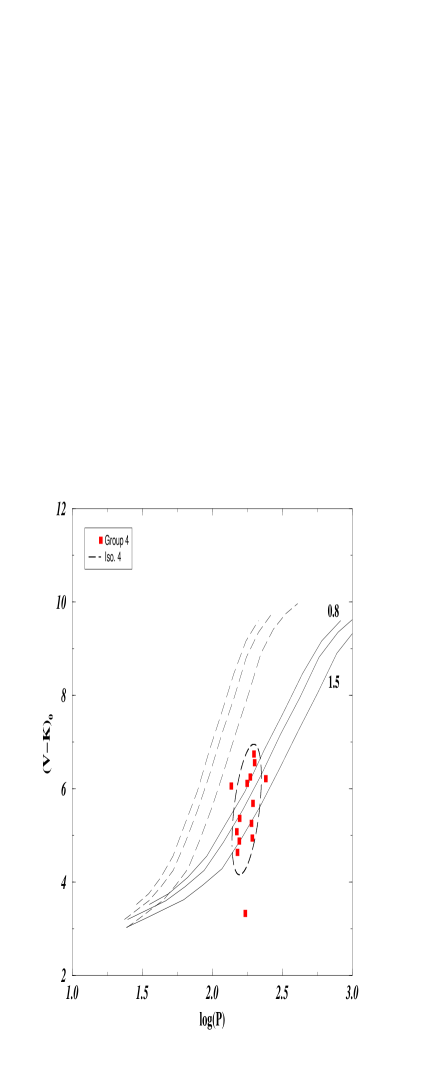
6.3 Extended disk and halo stars
Group 4 stars (Figs 8 & 11) appear pulsating on the fundamental mode with and 1.1 (0.014 and 1.65 for the sample). No solution is found for the first overtone. However, these results must be taken with some caution, because of the paucity of the sample in view of the data error bars (see Sect. 2.1).
7 Discussion
7.1 A problem of mixing length ?
A single value of the mixing-length parameter has been used throughout this work. We did not possess enough data on LMC and globular cluster stars to securely calibrate variations of and of the correction parameters, but some discussion of this deserves attention and is given below.
Comparison between the mixing-length theory and 2D numerical simulations of stellar convection indicate that, at the bottom of the RGB, the mixing-length parameter should exceed the solar value by at least 5 % – or even 10% according to some 3D calculations. Low-mass K sub-giant models have –15 %, and this parameter is a decreasing function of the effective temperature while it increases with the surface gravity (Freytag & Salaris 1999, Ludwig et al. 1999).
Empirical results are also available : Chieffi & Straniero (1989), Castellani et al. (1991), Bergbusch & Vandenberg (1997), Vandenberg et al. (2000) were able to fit the Red Giant Branch (RGB) of Globular Clusters (masses ) with the same mixing length parameter as for solar-like stars. However, Stothers & Chin (1995) as well as Keller (1999), showed that the mixing length parameter must exceed by roughly 35 % at 3 and strongly decrease at larger masses (and luminosities) if the red giants and supergiants of Galactic open clusters and of young clusters of the Magellanic Clouds are to be fitted. This non-monotonic behaviour illustrates the competition between the mass and the luminosity in determining the gravity and temperature. No clear metallicity-dependence was found (Stothers & Chin 1996, Keller 1999). Concerning the Horizontal Branch and the Early-AGB, Castellani et al. (1991) found the solar mixing length to be suitable for Globular Cluster stars with masses .
Although the LPVs are TP-AGB stars, with much higher and diverse
luminosities, these previous works give us the order of magnitude of the
possible variations of between the mean mass or luminosity that were
the basis of the calibration (barycenter of the LMC Mira-like stars) and
3 or the maximum luminosity of the sample. We have thus derived
a mass–mixing-length relation from the RGB results, by performing a
spline interpolation and scaling so as to match the and mass that
were obtained at the barycenter of the LMC Mira-like stars.
On the other hand, when investigating the possibility of a
luminosity-dependence, we have assumed that varies by %
every 2 magnitudes.
If depends on the mass, the isomass lines in this paper must move
away from each other in the PL and LC diagrams below and get
closer again at larger masses. This means that, in the previous sections, the
masses that appeared larger than 1 and the corresponding
metallicities were respectively over- and underestimated. As a consequence, a
totally unlikely metallicity () is now required in a large part of
Group 1. The Group 4 sample, too, gets unlikely high mass and metallicity in
view of its kinematics. Moreover, the period corrections also have to be
increased, which makes the model fit more unlikely in view of the theoretical
background. The mixing-length parameter is thus probably not or is little
dependent on the mass. The same arguments also allow us to rule out the
hypothesis that it increase with the luminosity.
On the other hand, let us assume that is a decreasing function of . Then, the slopes of the isomass lines get smaller in the PL and LC diagrams. The same combination of , and as in the preceding sections gives a better fit, with a mass discrepancy for the SMC-like GC fundamental pulsators. However, we get for the first overtone pulsators. As a compromise, we may adopt , and , yielding and for both modes. Then, the deviation of from the mean of its a priori estimates (see Sect. 4.4), expressed in units of standard deviation, defines a scaling to apply to , which yields .
As a first consequence, this hypothesis helps to solve a puzzling contradiction that we found in Figs. 4 and 5 : while the theoretical mass increases along the Mira-like strip of the LMC in the PL and PC planes it decreases in the PC diagram if a constant mixing length is assumed. A bit of metallicity dispersion and of period-dependence of the correction parameters might also help.
The barycenter masses and metallicities of the local, LMC and GC populations are shown in Table 1, together with the ones obtained with a constant . One can see that and are nearly constant for Groups 1 and 4. For Groups 2 and 3 (1st ov.), the mean masses decrease by 10%, but the metallicities reach high values that are unlikely for old stars of the solar neighbourhood. Moreover, no solution is found for the Group 3 second-overtone pulsators, even when varying by a factor 3. All of this, together with the very low mass found for GC 1st overtone pulsators, suggests that is actually less luminosity-dependent than the adopted rate333New calculations performed while allowing to vary with the luminosity have shown that can not decrease by more than 8 % per magnitude along the AGB if the mean mass of the 1st overtone pulsators is required to be ..
If we further increase the luminosity-dependence of the mixing length, smaller
or even null period corrections of the fundamental and first overtone modes
can be adopted. For example, if varies by 70 % every 2 magnitudes,
the compromise is reached at , and
, yielding . However, the
fit is not better ( for both modes) and the mean mass
of the SMC-like GC first-overtone pulsators becomes definitely unlikely ().
Concluding, the mixing-length parameter probably decreases along the AGB, but its variation should not exceed 15 % per magnitude. Clearly positive period corrections are anyway required, especially for the fundamental mode ( %) but also for the first overtone ( %) and the latter relative shift is always smaller than a third of the former.


7.2 Stability, consistency and error bars
Our results form a consistent set including seven or eight populations with five or six different mean metallicities, three pulsation modes and two colour indices. If we vary by 0.1 the assumed mean mass of the LMC Mira-like stars, all other masses simply get shifted by a similar amount. The metallicities of the local stars remain unchanged, and the period and colour correction parameters vary by only about 0.05 and 0.015 () respectively.
In the single- case, the period and colour correction parameters were taken a minima, i.e. a better fit (smaller ) would have been obtained with larger corrections. As a test, let us increase and by one standard deviation of the a priori estimates (Fig. 2), this corresponds to for the fundamental mode and 0.101 for the first overtone. Then, the mean masses of Groups 1 through 3 increase by less than 2% and the metallicities by only 0.002. This is of course negligible. Thus, our results are stable, which is confirmed by their similarity when a luminosity-dependent mixing length is adopted (see Table 1).
On the other hand, the error bars of the periods, magnitudes and colours at the barycenter of each population (LMC, Globular Clusters and solar neighbourhood) are small (see Sect. 2 and 5) and yield uncertainties of a few percent on masses and, for the solar neighbourhood, 5–15 % on metallicities (except perhaps for Group 4).
Since any change of the adopted temperature scale would automatically
translate into the colour correction parameters (the calibrated
values as well as the a priori estimates shown in Fig. 2) and into the
luminosity dependence of , the uncertainty of this relation
does not significantly affect our results at constant . However,
metallicity differences with respect to the LMC might be a little
overestimated, if molecular opacities were significantly underestimated in
the atmospheric models.
Support for this model may be seen in the consistency of the mean masses and metallicities of the local populations of LPVs with their respective kinematics, determined in Paper I, and their similar evolutionary stages :
Group 1, which has the kinematics of old disk stars and is mostly composed of Miras, is actually found having about the solar metallicity, just as usually assumed.
Concerning Group 3, first and second overtone pulsators have the same, higher mean metallicity, consistent with the thin-disk kinematics.
Also consistently with its kinematics (extended disk and halo), Group 4 has a lower metallicity than the others.
Last, compared to Group 1, Group 2 is found to be much more metallic and a bit less massive (-dependent ) or a little more metallic and massive (single ). Since these stars are slightly less evolved and may lose in roughly years, the mean initial mass must be similar to or smaller than that of Group 1. So, in both cases, Group 2 stars must be a little older (Vassiliadis & Wood 1993). This is consistent with the larger velocity dispersion and scale height found in Paper I. The evolutionary aspects of this work will be further investigated in a forthcoming paper.
7.3 Theoretical interpretation
The significant, positive period correction that has to be applied to linear models contradicts the hydrodynamical calculations. Indeed, we have seen in Sect. 4.2 that our would range from to if the models of Ya’ari & Tuchman (1996, 1998) did represent real stars. This would lead to large mass discrepancies () for the fundamental pulsators of the SMC-like clusters, even with a luminosity-dependent mixing length. Moreover, the corresponding colour corrections would be extreme values among the a priori estimates calculated in Sect. 4 : and . This is quite a bit for an average behaviour !
Another interesting – though weaker – argument is derived from evolutionary considerations. For the predicted period shifts, the mean metallicity and mass ratios of Group 1 to Group 2 are and . Detailed evolutionary calculation is beyond the scope of this paper but if the periods predicted by Ya’ari & Tuchman were right, Group 2 would probably be a little younger than Group 1, in contradiction with the kinematics.
Summarizing, the nonlinear behaviour calculated by Ya’ari & Tuchman (1996)
is unlikely in view of the available data. Let us try to explain this :
As stated in Sect. 4.1, the core mass–luminosity relation assumed in our calculations holds over a limited part of the thermal pulsation cycle, but the effect on the period and temperature is very small and the opposite sign of the calibrated period and colour correction parameters.
The same section also shows that phase-lagged convection, horizontal opacity averaging and turbulent pressure all together might yield a period increase by as much as 40 % for the fundamental and 25 % for the first overtone, the relative shift of the latter always being larger than a third of the former. In case of negligible nonlinear effects, this could explain the correction parameters of the fundamental or the first overtone but not both, since the ratio would be wrong444The same remark holds a fortiori for the calculations based on Wood’s code, which give both modes about the same shift.. Furthermore, the nonlinear effects predicted by Ya’ari & Tuchman would strongly reduce the final period of the fundamental while not significantly changing the first overtone, so that both modes would finally exhibit similar shifts with respect to our LNA models.
In other terms, if an improved physics of the sub-photospheric regions manages to explain the observed first overtone, then there must remain a significant, positive shift of the actual fundamental mode ( %, possibly much more) with respect to its theoretical period. The only explanation seems to be the coupling of the stellar envelope with the circumstellar layers and the subsequent wind, evoked in Sect. 4.3 above.


8 Conclusion
The aim of this paper was to interpret the results of Barthès et al. (1999) in terms of pulsation modes and fundamental parameters, i.e. the fact that the Long-Period Variable stars of the solar neighbourhood are distributed among four groups (according to kinematic and photometric criteria), and to study the period–luminosity–colour distributions of these groups. This was done by confronting them with a grid of linear nonadiabatic pulsation models.
Preliminary discussion of the colour–temperature relations and of the existing linear and nonlinear modelling codes showed that the periods and colours predicted by LNA models may significantly differ from the observed values, even if the adopted fundamental parameters are the true ones. In order to mimic this behaviour, we added a few free parameters to the LNA models: a systematic period correction for each mode, and systematic colour corrections and . These parameters, as well as the mixing length, were then calibrated by demanding that consistent masses be derived from the period and from the colour, for the fundamental and first-overtone pulsators of the LMC and of globular clusters with LMC or SMC metallicity. It was assumed that the mean mass of the Mira-like stars (fundamental pulsators) of the LMC is 1 . Then, the mean mass of the LMC first-overtone pulsators was found to be about 0.95 , while that of the fundamental and first-overtone pulsators with SMC metallicity was 0.8 and 0.6 respectively (or down to 0.75 and 0.5 if the mixing-length parameter is allowed to strongly vary with the luminosity).
We were thus able to determine the pulsating mode and the mean masses and metallicities of the neighbouring LPV populations :
-
•
Group 1 stars (old disk LPVs, mostly Miras) are pulsating on the fundamental mode. The mean mass is and the mean metallicity , both strongly increasing with the period.
-
•
Group 2 stars (old disk LPVs, mostly SRb’s) are pulsating on the fundamental mode also, with and . Metallicity variations of about 50 % are likely.
-
•
Group 3 stars (thin-disk LPVs, mostly SRb’s) are pulsating on the first and second overtones, with , and .
-
•
Group 4 stars (extended disk and halo) appear to be pulsating on the fundamental mode with and . This result must however be taken with caution.
These findings, based on the index as a temperature estimator, have been checked and confirmed by using . They were proven to be stable and consistent with the kinematics. The error bars of the masses are about 5 %. If one shifts the reference mass of the LMC Miras by any reasonable amount, all other masses are simply similarly shifted and the metallicities remain nearly unchanged. Metallicity differences with respect to the LMC may be a little overestimated if molecular opacities have been significantly underestimated in the atmospheric models. Nevertheless, the hierarchy holds anyway.
The mixing-length parameter probably decreases along the AGB, but its variation should not exceed 15 % per magnitude. This was taken into account in the abovementioned results.
This study confirms the findings in Paper I, the discrimination between Miras
and semiregulars is not pertinent : Groups 1 and 2 not only have similar
kinematics but also the same pulsation mode.
It has also been shown that both the linear and nonlinear models that were the
basis of all previous studies of LPV pulsation are probably far from the real
pulsational behaviour of these stars. While dynamical calculations including a
modern equation of state predict a strong reduction of the fundamental
nonlinear period with respect to the linear one, important, positive
systematic corrections have to be applied to the periods of our linear models
(30–45 % for the fundamental mode and 8–13 % for the first overtone).
Improvements of the physics of the sub-photospheric envelope (phase lagged
convection, turbulent pressure, horizontal opacity averaging…) appear
insufficient to explain these two shifts altogether, so that the actual
fundamental period should always exceed the theoretical one by at least
15 %. This led us to conclude that all existing linear and nonlinear
pulsation codes probably suffer from neglecting the stellar wind generated by
the interaction with the circumstellar envelope.
As a consequence, the works of Barthès & Tuchman (1994) and Barthès & Mattei (1997), who confronted LNA models with the Fourier components of the lightcurves of a few nearby Miras and concluded in favour of the first overtone, should now be reconsidered by taking into account the necessary period corrections and the variations of metallicity and, possibly, mixing-length parameter.
This study may also have consequences in AGB evolutionary calculations,
especially those that use the period as a substitute for a fundamental
parameter ( or ) or as the variable in the empirical
mass-loss function (e.g. Whitelock 1986, Vassiliadis & Wood 1993, Reid et
al. 1995, Marigo et al. 1996). Indeed, these studies are based on pulsation
models by Wood that appear to strongly overestimate the periods and
their dependence on luminosity and metallicity, probably because of the
equation of state. Concerning the fundamental mode, this peculiarity allows
Wood’s models to roughly mimic the abovementioned systematic period shifts
and variation of the mixing length parameter, but with an uncertainty
that remains to be assessed. Moreover, while many Long Period Variables are
obviously pulsating on the first or second overtone, this possibility is
usually neglected in evolutionary calculations, and Wood’s models appear
definitely inapropriate for these modes. These issues will be investigated in
a forthcoming paper.
Acknowledgements.
This work was supported by the European Space Agency (ADM-H/vp/922) and by the Hispano–French Projet International de Coopération Scientifique (PICS) No 348. We thank the referees, Drs. Bessell and Bono, for numerous comments that helped us to improve this paper.References
- (1) Alexander D.R., 1992, private communication
- (2) Alexander D.R., Ferguson J.W., 1994, ApJ 437, 879
- (3) Barthès D., Mattei J.A., 1997, AJ 113, 373
- (4) Barthès D., 1998, A&A 333, 647
- (5) Barthès D., Luri X., Alvarez R., Mennessier M.O., 1999, A&AS 140, 1 (Paper I)
- (6) Barthès D., Tuchman Y., 1994, A&A 289, 429
- (7) Bergbusch P.A., Vandenberg A.A., 1997, AJ 114, 2604
- (8) Bessell M.S., Wood P.R., Lloyd Evans T., 1983, MNRAS 202, 59
- (9) Bessell M.S., Wood P.R., 1984, PASP 96, 247
- (10) Bessell M.S., Brett J.M., Scholz M., Wood P.R., 1989a, A&A 213, 209
- (11) Bessell M.S., Brett J.M., Scholz M., Wood P.R., 1989b, A&AS 77, 1
- (12) Bessell M.S., Scholz M., Wood P.R., 1996, A&A 307, 481
- (13) Bessell M.S., Castelli F., Plez B., 1998, A&A 333, 231
- (14) Boothroyd A.I., Sackmann I.J., 1988a, ApJ 328, 632
- (15) Boothroyd A.I., Sackmann I.J., 1988b, ApJ 328, 641
- (16) Boothroyd A.I., Sackmann I.J., 1992, ApJ 393, L21
- (17) Bowen G.H., 1988, ApJ 329, 299
- (18) Castellani V., Chieffi A., Pulone L., 1991, ApJS 76, 911
- (19) Chieffi A., Straniero O., 1989, ApJS 71, 47
- (20) Cox J.P., Giuli R.T., 1968, Principles of Stellar Structure, Gordon and Breach, New York
- (21) Cox A.N., Ostlie D.A., 1993, ApSS 210, 311
- (22) Feast M., 1996, MNRAS 278, 11
- (23) Feast M.W., Glass I.S., Whitelock P.A., Catchpole R.M., 1989, MNRAS 241, 375
- (24) Fleischer A.J., Gauger A., Sedlmayr E., 1992, A&A 266, 321
- (25) Fox M.W., Wood P.R., 259, 198
- (26) Haniff C.A., Scholz M., Tuthill P.G., 1995, MNRAS 276, 640
- (27) Hill, S.J., Willson, L.A., 1979, ApJ 229, 1029
- (28) Höfner S., Dorfi E.A., 1997, A&A 319, 648
- (29) Hofmann K.H., Scholz M., Wood P.R., 1998, A&A 339, 846
- (30) Hughes S.M.G., Wood P.R., 1990, AJ 99, 784
- (31) Jura M., 1986, ApJ 303, 327
- (32) Jura M., 1988, ApJS 66, 33
- (33) Jura M., Yamamoto A., Kleinmann S.G., 1993, ApJ 413, 298
- (34) Keller S.C., 1999, AJ 118, 889
- (35) Kerschbaum F., Hron J., 1992, A&A 263, 97
- (36) Ludwig H.G., Freytag B., Steffen M., 1999, A&A 346, 111
- (37) Luri X., Mennessier M.O., Torra J., Figueras F., 1996a, A&AS 117, 405
- (38) Luri X., Mennessier M.O., Torra J., Figueras F., 1996b, A&A 314, 807
- (39) Marigo P, Bressan A., Chiosi C., 1996, A&A 313, 545
- (40) Mattei J.A., Foster G., Hurwitz L.A., Malatesta K.H., Willson L.A., Mennessier M.O., 1997, In: Battrick B. (ed.), Hipparcos Venice ’97, ESA SP-402, p. 269
- (41) Ostlie D.A., Cox A.N., 1986, ApJ 311, 864
- (42) Paczyński B., 1970, Acta Astron. 20, 47
- (43) Perl M., Tuchman Y., 1990, ApJ 360, 554
- (44) Perrin G., Coudé du Foresto V., Ridgway S.T., Mariotti J.M., Traub W.A., Carleton N.P., Lacasse M.G., 1998, A&A 331
- (45) Pijpers F.P., 1993, A&A 267, 471
- (46) Reid I.N., Hughes S.M.G., Glass I.S., 1995, MNRAS 275, 331
- (47) Stellingwerf R.F., 1975, ApJ 195, 441
- (48) Stothers R.B., Chin C.W., 1995, ApJ 440, 297
- (49) Stothers R.B., Chin C.W., 1996, ApJ 469, 166
- (50) Tuchman Y., 1991, ApJ 383, 779
- (51) Tuchman Y., Sack N., Barkat Z., 1978, ApJ 219, 183
- (52) Tuchman Y., Sack N., Barkat Z., 1979, ApJ 234, 217
- (53) van Belle G.T., Lane B.F., Thompson R.R., et al., 1999, AJ 117, 521
- (54) van Leeuwen F., Feast M. W., Whitelock P.A., Yudin B., 1997, MNRAS 287, 955
- (55) Vandenberg D.A., Swenson F.J., Rogers F.J., Iglesias C.A., Alexander D.R., 2000, ApJ 532, 430.
- (56) Vassiliadis E., Wood P.R., 1993, ApJ 413, 641
- (57) Wagenhuber J., Tuchman Y., 1996, A&A 311, 509
- (58) Whitelock P.A., 1986, MNRAS 219, 525
- (59) Willson L.A., 1982, In: Cox J.P. & Hansen C.J. (eds.), Pulsations in Classical and Cataclysmic Variable Stars, Joint Inst. Lab. Astroph. Ed., Boulder, p. 269
- (60) Wood P.R., 1974, ApJ 190, 609
- (61) Wood P.R., 1990, In: Mennessier M.O. & Omont A. (eds.), From Miras to Planetary Nebulae: Which Path for Stellar Evolution?, Editions Frontieres, Gif–sur–Yvette, p. 67
- (62) Wood P.R., 1995, In: Stobie R.S. & Whitelock P.A. (eds.), Astrophysical Applications of Stellar Pulsation, ASP Conf. Ser. 83, p. 127
- (63) Wood P.R. et al., 1999, In: Le Bertre T., Lèbre A., Waelkens C. (eds.), AGB Stars (Proc. IAU Symp. 191), ASP, p. 151
- (64) Wood P.R., 1999, Pub. Astron. Soc. Austr. 17 (1), 18
- (65) Wood P.R., Sebo K.M., 1996, MNRAS 282, 958
- (66) Xiong D.R., Deng L., Cheng Q.L., ApJ 499, 355
- (67) Ya’ari A., Tuchman Y., 1996, ApJ 456, 350
- (68) Ya’ari A., Tuchman Y., 1999, ApJ 514, L35